
Filed Pursuant to Rule 497
Registration Statement No. 333-141828
PROSPECTUS SUPPLEMENT TO PROSPECTUS DATED MAY 16, 2007
8,000,000 Shares
Common Stock
We are offering 8,000,000 shares of our common stock. Our common stock is listed on the Nasdaq Global Market under the symbol “HTGC.” The last reported sale price on June 4, 2007 was $13.87 per share. We are an internally-managed, non-diversified closed-end investment company that has elected to be treated as a business development company under the Investment Company Act of 1940, as amended.
The underwriters have an option to purchase a maximum of 1,200,000 additional shares to cover over-allotments of shares.
Please read this prospectus supplement, and the accompanying prospectus, before investing, and keep it for future reference. The prospectus supplement and the accompanying prospectus contain important information about us that a prospective investor should know before investing in our common stock. We file annual, quarterly and current reports, proxy statements and other information about us with the Securities and Exchange Commission. This information is available free of charge by contacting us at 400 Hamilton Avenue, Suite 310, Palo Alto, California 94301, or by telephone by calling collect at (650) 289-3060 or on our website at www.herculestech.com. The information on our website is not incorporated by reference into this prospectus or the accompanying prospectus. The SEC also maintains a website at www.sec.gov that contains such information.
An investment in our common stock involves risks, including the risk of a total loss of investment. In addition, the companies in which we invest are subject to special risks. See “ Risk Factors” beginning on page 12 of the accompanying prospectus to read about risks that you should consider before investing in our common stock, including the risk of leverage.
| Price to Public | Underwriting Discounts and Commissions |
Proceeds to us(1) | |||||||
| Per Share |
$ | 13.50 | $ | 0.675 | $ | 12.825 | |||
| Total |
$ | 108,000,000 | $ | 5,400,000 | $ | 102,600,000 | |||
| (1) | Expenses payable by us are estimated to be $250,000. |
Delivery of the shares of common stock will be made on or about June 8, 2007.
Neither the Securities and Exchange Commission nor any state securities commission has approved or disapproved of these securities or determined if this prospectus supplement or the accompanying prospectus is truthful or complete. Any representation to the contrary is a criminal offense.
| Credit Suisse Sole Bookrunning Manager |
JMP Securities Joint Lead Manager |
| A.G. Edwards | ||||
| Piper Jaffray |
||||
| Ferris, Baker Watts Incorporated | ||||
The date of this prospectus supplement is June 4, 2007.
You should rely only on the information contained in this document or to which we have referred you. We have not authorized anyone to provide you with information that is different. This document may only be used where it is legal to sell these securities. The information in this document may only be accurate on the date of this document.
This document is in two parts. The first part is this prospectus supplement, which describes the terms of this offering of common stock and also adds to and updates information contained in the accompanying prospectus. The second part is the accompanying prospectus, which gives more information. To the extent the information contained in this prospectus supplement, differs from the information contained in the accompanying prospectus the information in this prospectus supplement shall control.
Unless the context requires otherwise, in this prospectus supplement the terms “we,” “us,” and/or “the Company” refer to Hercules Technology Growth Capital, Inc. and its subsidiaries.
S-1
The following table is intended to assist you in understanding the various costs and expenses that an investor in our common stock will bear directly or indirectly assuming that the underwriters do not exercise their over-allotment option. However, we caution you that some of the percentages indicated in the table below are estimates and may vary. Except where the context suggests otherwise, whenever this prospectus contains a reference to fees or expenses paid by “you” or “us” or that “we” will pay fees or expenses, stockholders will indirectly bear such fees or expenses as investors in Hercules Technology Growth Capital.
| Stockholder Transaction Expenses (as a percentage of the public offering price): |
|||
| Sales load (as a percentage of offering price)(1) |
5.0 | % | |
| Offering expenses |
0.2 | %(2) | |
| Dividend reinvestment plan fees |
— | %(3) | |
| Total stockholder transaction expenses (as a percentage of the public offering price) |
5.2 | % | |
| Annual Expenses (as a percentage of net assets attributable to common stock):(4) |
|||
| Operating expenses |
5.1 | %(5)(6) | |
| Interest payments on borrowed funds |
2.8 | %(7) | |
| Fees paid in connection with borrowed funds |
0.3 | %(8) | |
| Acquired fund fees and expenses(9) |
— | % | |
| Total annual expenses |
8.2 | %(10) | |
| (1) | Represents the underwriting discount with respect to the shares to be sold by us in this offering. |
| (2) | The percentage reflects estimated offering expenses of approximately $250,000. |
| (3) | The expenses associated with the administration of our dividend reinvestment plan are included in “Operating expenses.” We pay all brokerage commissions incurred with respect to open market purchases, if any, made by the administrator under the plan. For more details about the plan, see “Dividend Reinvestment Plan.” |
| (4) | “Average net assets attributable to common stock” equals estimated weighted average net assets for 2007 which is approximately $265.6 million. |
| (5) | “Operating expenses” represent our estimated expenses for the year ending December 31, 2007. This percentage for the year ended December 31, 2006, was approximately 8.4%. |
| (6) | We do not have an investment adviser and are internally managed by our executive officers under the supervision of our Board of Directors. As a result, we do not pay investment advisory fees, but instead we pay the operating costs associated with employing investment management professionals. |
| (7) | “Interest payments on borrowed funds” represents estimated annualized interest payments on borrowed funds for 2007. Citigroup has an equity participation right through a warrant participation agreement on the pool of loans, warrants and shares underlying the warrants collateralized under the Citigroup facility. Pursuant to the warrant participation agreement, we granted to Citigroup a 10% participation in all warrants held as collateral. As a result, Citigroup is entitled to 10% of the realized gains on the warrants until the realized gains paid to Citigroup pursuant to the agreement equals $3,750,000 (the “Maximum Participation Limit”). The obligations under the warrant participation agreement continue even after the Citigroup facility is terminated until the Maximum Participation Limit has been reached. Since inception of the agreement in 2005, we have paid Citigroup approximately $292,000 under the warrant participation agreement thereby reducing our realized gains. During 2006, we reduced our realized gain by $221,000 and recorded a liability and reduced our unrealized gain by approximately $35,000 for unrealized gains in our warrant and equity investments due Citigroup under our warrant participation agreement. During the three months ended March 31, 2007, we reduced our realized gain by approximately $16,000 for Citigroup’s participation in the gain on sale of an equity security and we recorded an additional liability and reduced our unrealized appreciation by approximately $55,000 for Citigroup’s participation in unrealized appreciation in the warrant portfolio. Based on our average borrowings for the year ending December 31, 2006 and the amount |
S-2
| of the reduction we recorded for our realized and unrealized gains for 2006, the additional cost of our borrowings as a result of the warrant participation agreement could be approximately 0.31%. There can be no assurances that the unrealized gains on the warrants will not be higher or lower in future periods due to fluctuations in the value of the warrants, thereby increasing or reducing the effect on the cost of borrowing. The value of their participation right on unrealized gains in the related equity investments since inception of the agreement was approximately $432,000 at March 31, 2007 and is included in accrued liabilities and reduces the unrealized gain recognized by the us at March 31, 2007. |
| (8) | “Fees paid in connection with borrowed funds” represents estimated fees paid in connection with borrowed funds for 2007. |
| (9) | For the year ended December 31, 2006, we did not have any investments in shares of Acquired Funds that are not consolidated and, as a result, we did not directly or indirectly incur any fees from Acquired Funds. |
| (10) | “Total annual expenses” is the sum of “operating expenses,” “interest payments on borrowed funds” and “fees paid in connection with borrowed funds.” |
Example
The following example demonstrates the projected dollar amount of total cumulative expenses that would be incurred over various periods with respect to a hypothetical investment in our common stock. These amounts are based upon our payment of annual operating expenses at the levels set forth in the table above and assume no additional leverage.
| 1 Year | 3 Years | 5 Years | 10 Years | |||||||||
| You would pay the following expenses on a $1,000 investment, assuming a 5% annual return |
$ | 126.44 | $ | 272.22 | $ | 409.04 | $ | 715.39 | ||||
The example and the expenses in the tables above should not be considered a representation of our future expenses, and actual expenses may be greater or lesser than those shown. Moreover, while the example assumes, as required by the applicable rules of the SEC, a 5% annual return, our performance will vary and may result in a return greater or lesser than 5%. In addition, while the example assumes reinvestment of all dividends and distributions at net asset value, participants in our dividend reinvestment plan may receive shares valued at the market price in effect at that time. This price may be at, above or below net asset value. See “Dividend Reinvestment Plan” for additional information regarding our dividend reinvestment plan.
S-3
Our Company
We are a specialty finance company that provides debt and equity growth capital to technology-related and life sciences companies at all stages of development. Our investment objective is to maximize our portfolio’s total return by generating current income from our debt investments and capital appreciation from our equity-related investments. We are an internally-managed, non-diversified closed-end investment company that has elected to be treated as a business development company under the Investment Company Act of 1940.
We primarily finance privately-held companies backed by leading venture capital and private equity firms and also may invest in select publicly-traded companies that lack access to public capital or are sensitive to equity ownership dilution. Our principal executive office is located in Silicon Valley, and we have additional offices in the Boston, Boulder, Chicago, Costa Mesa and Columbus areas. Our goal is to be the leading structured mezzanine capital provider of choice for venture capital and private equity backed technology-related and life sciences companies requiring sophisticated and customized financing solutions. Our strategy is to evaluate and invest in a broad range of ventures active in the technology and life science industries and to offer a full suite of capital products at all levels of the capital structure. We invest primarily in structured mezzanine debt and, to a lesser extent, in senior debt and equity. We use the term “structured mezzanine debt investment” to refer to any debt investment, such as a senior or subordinated secured loan, that is coupled with an equity component, including warrants, options or rights to purchase common or preferred stock. Our structured mezzanine debt investments will typically be secured by some or all of the assets of the portfolio company.
We focus our investments in companies active in technology industry sub-sectors characterized by products or services that require advanced technologies, including computer software and hardware, networking systems, semiconductors, semiconductor capital equipment, information technology infrastructure or services, Internet consumer and business services, telecommunications, telecommunications equipment, media and life sciences. Within the life sciences sub-sector, we focus on medical devices, bio-pharmaceutical, health care services and information systems companies. We refer to all of these companies as “technology-related” companies and intend, under normal circumstances, to invest at least 80% of the value of our assets in such businesses.
Our primary business objectives are to increase our net income, net operating income and net asset value by investing in structured mezzanine debt and equity of venture capital and private equity backed technology-related companies with attractive current yields and the potential for equity appreciation and realized gains. Our structured debt investments typically include warrants or other equity interests, giving us the potential to realize equity-like returns on a portion of our investment. In some cases, we receive the right to make additional equity investments in our portfolio companies in connection with future equity financing rounds. Capital that we provide directly to venture capital and private equity backed technology-related companies is generally used for growth, and in select cases for acquisitions or recapitalizations.
Our portfolio is comprised of, and we anticipate that our portfolio will continue to be comprised of, investments in technology-related companies at various stages of their development. Consistent with regulatory requirements, we invest primarily in United States based companies and to a lesser extent in foreign companies. To date, our emphasis has been primarily on private companies following or in connection with their first institutional round of equity financing, which we refer to as emerging-growth companies, and private companies in later rounds of financing, which we refer to as expansion-stage companies. In 2007, we expect to increase our investment activity in established companies, comprised of private companies in one of their final rounds of equity financing prior to a liquidity event or select publicly-traded companies that lack access to public capital or are sensitive to equity ownership dilution.
Our investment professionals, including Manuel A. Henriquez, our co-founder, Chairman, President and Chief Executive Officer, is currently comprised of 17 professionals who have, on average, more than 15 years of
S-4
experience in venture capital, structured finance, commercial lending or acquisition finance with the types of technology-related companies that we are targeting. We believe that we can leverage the experience and relationships of our management team to successfully identify attractive investment opportunities, underwrite prospective portfolio companies and structure customized financing solutions.
Since inception through March 31, 2007, we have made debt commitments of $573.7 million to 74 portfolio companies and equity commitments of $7.5 million to 15 companies. At March 31, 2007, our portfolio had a fair value of $342.5 million in 65 companies.
From April 1, 2007 through May 22, 2007, we entered into binding agreements to invest approximately $65.0 million in structured mezzanine debt in five new portfolio companies and $750,000 in an equity investment in one existing portfolio company.
During this same period, we funded the following debt investments totaling $51.2 million in eight new portfolio companies and four existing portfolio companies and funded $1.0 million in equity to two portfolio companies.
| Company |
Type
of |
Principal Business |
Funded Investment | ||||
| Cittio, Inc. |
Senior Debt | Software | $ | 1,000,000 | |||
| Cornice, Inc. |
Senior Debt | Electronics and Computer Hardware | 256,821 | ||||
| Guava Technologies, Inc. |
Senior Debt | Biotechnology Tools | 1,000,000 | ||||
| iWatt, Inc. |
Senior Debt | Semiconductors | 1,200,000 | ||||
| Neosil, Inc. |
Senior Debt | Drug Discovery | 2,000,000 | ||||
| NEXX Systems, Inc. |
Senior Debt | Semiconductors | 3,000,000 | ||||
| NuGEN Technologies, Inc. |
Senior Debt | Biotechnology Tools | 1,000,000 | ||||
| Rubicon Technology, Inc. |
Senior Debt | Advanced Specialty Materials and Chemicals | 8,100,000 | ||||
| Seven Networks, Inc. |
Senior Debt | Communications and Networking | 4,000,000 | ||||
| Solutionary, Inc. |
Senior Debt | Information Services | 5,500,000 | ||||
| Tectura Corporation |
Senior Debt | Communications and Networking | 22,000,000 | ||||
| VeriWave, Inc. |
Senior Debt | Electronics and Computer Hardware | 2,163,271 | ||||
| Solutionary, Inc. |
Equity | Information Services | 250,000 | ||||
| Quatrx Pharmaceuticals Company |
Equity | Specialty Pharmaceuticals | 750,001 | ||||
| Total Investments | $ | 52,220,093 | |||||
In addition, at May 22, 2007, we had unfunded commitments totaling approximately $85.6 million. These commitments will be subject to the same underwriting and ongoing portfolio maintenance as the financial instruments that we hold. Since these commitments may expire without being drawn upon, the total commitment amount does not necessarily represent future cash requirements. In addition, we had extended non-binding term sheets to 17 prospective new portfolio companies representing approximately $127.9 million of structured mezzanine debt investments. These investments are subject to finalization of our due diligence and approval process as well as negotiation of definitive agreements with the prospective portfolio company and, as a result, may not result in completed investments.
From April 1, 2007 through May 22, 2007, four of our portfolio companies closed on new rounds of equity funding. Portola Pharmaceuticals, Aveo Pharmaceuticals, QuatRx Pharmaceuticals and Intelliden raised approximately $70.0 million, $53.0 million, $44.0 million and $10.0 million, respectively, in new equity funding.
S-5
On May 22, 2007, Sirtris Pharmaceuticals completed their initial public offering of common stock at $10.00 per share. In addition, two of our portfolio companies, Power Medical and Aegerion Pharmaceuticals, have filed registration statements with the Securities and Exchange Commission, to register shares for an initial public offering of their common stock.
During this same period, one portfolio company, Pathfire, announced it had been acquired by DG FastChannel. In addition, Inxight Software announced that it had entered into a definitive agreement to be acquired by Business Objects, and Baby Universe announced it entered into a definitive agreement to merge with eToysDirect, Inc.
As of May 22, 2007, we had $130.0 million outstanding under our securitization credit facility.
Our Market Opportunity
We believe that technology-related companies compete in one of the largest and most rapidly growing sectors of the U.S. economy and that continued growth is supported by ongoing innovation and performance improvements in technology products as well as the adoption of technology across virtually all industries in response to competitive pressures. We believe that an attractive market opportunity exists for a specialty finance company focused primarily on structured mezzanine investments in technology-related and life sciences companies for the following reasons:
| • | Technology-related companies have generally been underserved by traditional lending sources; |
| • | Unfulfilled demand exists for structured debt financing to technology-related companies; |
| • | Structured mezzanine debt products are less dilutive and complement equity financing from venture capital and private equity funds; and |
| • | Valuations currently assigned to technology-related companies in private financing rounds, while increasing in recent years, still provide a good opportunity for attractive capital returns. |
Technology-Related Companies Underserved by Traditional Lenders. We believe many viable technology-related companies backed by financial sponsors have been unable to obtain sufficient growth financing from traditional lenders, including financial services companies such as commercial banks and finance companies, in part because traditional lenders have continued to consolidate and have adopted a more risk-averse approach to lending that has resulted in tightened credit standards in recent years. More importantly, we believe traditional lenders are typically unable to underwrite the risk associated with financial sponsor-backed emerging-growth or expansion-stage companies effectively.
The unique cash flow characteristics of many technology-related companies include significant research and development expenditures and high projected revenue growth thus often making such companies difficult to evaluate from a credit perspective. In addition, the balance sheets of emerging-growth and expansion-stage companies often include a disproportionately large amount of intellectual property assets, which can be difficult to value. Finally, the speed of innovation in technology and rapid shifts in consumer demand and market share add to the difficulty in evaluating technology-related companies.
Due to the difficulties described above, we believe traditional lenders are generally refraining from entering the structured mezzanine debt marketplace for emerging-growth and expansion-stage companies, instead preferring the risk-reward profile of senior debt. Traditional lenders generally do not have flexible product offerings that meet the needs of technology-related companies. The financing products offered by traditional lenders typically impose on borrowers many restrictive covenants and conditions, including limiting cash outflows and requiring a significant depository relationship to facilitate rapid liquidation.
S-6
Unfulfilled Demand for Structured Debt Financing to Technology-Related Companies. Private debt capital in the form of structured debt financing from specialty finance companies continues to be an important source of funding for technology-related companies. We believe that the level of demand for structured debt financing to emerging-growth and expansion-stage companies is a function of the level of annual venture equity investment activity. In 2006, venture capital-backed companies received, in approximately 2,454 transactions, equity financing in an aggregate amount of approximately $25.8 billion, representing an 8% increase over the preceding year, as reported by Dow Jones VentureOne. In addition, according to VentureOne, overall, the median equity round size in 2006 was $7 million, up from $6.5 million in 2005, and the highest annual median since 2000. For the second year in a row, equity investors are focusing more than a third of their investment activity on early-stage financings. Overall, seed- and first-round deals made up 36% of the deal flow in 2006, and about the same concentration of deal flow went to later-stage deals. As a result, we believe a range of $20 billion to $25 billion in annual equity investments to venture-backed companies will be sustainable for future years.
We believe that demand for structured debt financing is currently unfulfilled, in part because historically the largest debt capital providers to technology-related companies exited the market during 2001 while at the same time lending requirements of traditional lenders have become more stringent. We therefore believe this is an opportune time to be active in the structured lending market for technology-related companies.
Structured Mezzanine Debt Products Complement Equity Financing From Venture Capital and Private Equity Funds. We believe that technology-related companies and their financial sponsors will continue to view structured debt securities as an attractive source of capital because it augments the capital provided by venture capital and private equity funds. We believe that our structured mezzanine debt products provide access to growth capital for technology-related companies that otherwise may only be available through incremental investments by existing equity investors. As such, we provide portfolio companies and their financial sponsors with an opportunity to diversify their capital sources. Generally, we believe emerging-growth and expansion-stage companies target a portion of their capital to be debt in an attempt to achieve a higher valuation through internal growth. In addition, because financial sponsor-backed companies have recently been more mature prior to reaching a liquidity event, we believe our investments could provide the debt capital needed to grow or recapitalize during the extended period prior to liquidity events.
Lower Valuations for Private Technology-Related Companies. During the downturn in technology industries that began in 2000, the markets saw sharp and broad declines in valuations of venture capital and private equity-backed technology-related companies. According to Dow Jones VentureOne, median pre-money valuations for venture capital-backed companies in 2000 was $25.1 million declining to a low of $10.0 million in 2003. In addition, as of December 31, 2006 median pre-money valuations for venture capital-backed companies in 2006 was $18.5 million compared to $15.0 million in 2005. While pre-money valuations have been steadily increasing since 2003, we believe the valuations currently assigned to venture capital and private equity-backed technology-related companies in private financing rounds are still relatively low and should allow us to continue to build a portfolio of equity-related securities at attractive valuation levels.
Our Business Strategy
Our strategy to achieve our investment objective includes the following key elements:
Leverage the Experience and Industry Relationships of Our Management Team and Investment Professionals. We have assembled a team of experienced investment professionals with extensive experience as venture capitalists, commercial lenders, and originators of structured debt and equity investments in technology-related companies. Our investment professionals have, on average, more than 15 years of experience as equity investors in, and/or lenders to, technology-related companies. In addition, our team members have originated structured mezzanine investments in over 200 technology-related companies, representing over $1.0 billion in investments, and have developed a network of industry contacts with investors and other participants within the
S-7
venture capital and private equity communities. In addition, members of our management team also have operational, research and development and finance experience with technology-related companies. We have established contacts with leading venture capital and private equity fund sponsors, public and private companies, research institutions and other industry participants, which should enable us to identify and attract well-positioned prospective portfolio companies.
We concentrate our investing activities in industries in which our investment professionals have investment experience. We believe that our focus on financing technology-related companies will enable us to leverage our expertise in structuring prospective investments, to assess the value of both tangible and intangible assets, to evaluate the business prospects and operating characteristics of technology-related companies and to identify and originate potentially attractive investments with these types of companies.
Mitigate Risk of Principal Loss and Build a Portfolio of Equity-Related Securities. We expect that our investments have the potential to produce attractive risk adjusted returns through current income, in the form of interest and fee income, as well as capital appreciation from equity-related securities. We believe that we can mitigate the risk of loss on our debt investments through the combination of loan principal amortization, cash interest payments, relatively short maturities, security interests in the assets of our portfolio companies, covenants requiring prospective portfolio companies to have certain amounts of available cash at the time of our investment and the continued support from a venture capital or private equity firm at the time we make our investment.
In addition, historically our structured debt investments typically include warrants or other equity interests, giving us the potential to realize equity-like returns on a portion of our investment. We expect, in some cases, to receive the right to make additional equity investments in our portfolio companies in connection with future equity financing rounds. We believe these equity interests will create the potential for long-term capital gains in connection with the future liquidity events of these technology-related companies.
Provide Customized Financing Complementary to Financial Sponsors’ Capital. We offer a broad range of investment structures and possess expertise and experience to effectively structure and price investments in technology-related companies. Unlike many of our competitors that only invest in companies that fit a specific set of investment parameters, we have the flexibility to structure our investments to suit the particular needs of our portfolio companies. We offer customized financing solutions ranging from senior debt to equity capital, with a focus on structured mezzanine debt.
We use our relationships in the financial sponsor community to originate investment opportunities. Because venture capital and private equity funds typically invest solely in the equity securities of their portfolio companies, we believe that our debt investments will be viewed as an attractive source of capital, both by the portfolio company and by the portfolio company’s financial sponsor. In addition, we believe that many venture capital and private equity fund sponsors encourage their portfolio companies to use debt financing for a portion of their capital needs as a means of potentially enhancing equity returns, minimizing equity dilution and increasing valuations prior to a subsequent equity financing round or a liquidity event.
Invest at Various Stages of Development. We provide growth capital to technology-related companies at all stages of development, from emerging-growth companies, to expansion-stage companies and established companies. Established companies are comprised generally of private companies in one of their final rounds of financing prior to a liquidity event or select publicly-traded companies that lack access to public capital or are sensitive to equity ownership dilution. We believe that this provides us with a broader range of potential investment opportunities than those available to many of our competitors, who generally focus their investments on a particular stage in a company’s development. Because of the flexible structure of our investments and the extensive experience of our investment professionals, we believe we are well positioned to take advantage of these investment opportunities at all stages of prospective portfolio companies’ development.
S-8
Benefit from Our Efficient Organizational Structure. We believe that the perpetual nature of our corporate structure enables us to be a long-term partner for our portfolio companies in contrast to traditional mezzanine and investment funds, which typically have a limited life. In addition, because of our access to the equity markets, we believe that we may benefit from a lower cost of capital than that available to private investment funds. We are not subject to requirements to return invested capital to investors nor do we have a finite investment horizon. Capital providers that are subject to such limitations are often required to seek a liquidity event more quickly than they otherwise might, which can result in a lower overall return on an investment.
Deal Sourcing Through Our Proprietary Database. We have developed a proprietary and comprehensive structured query language-based (SQL) database system to track various aspects of our investment process including sourcing, originations, transaction monitoring and post-investment performance. As of March 31, 2007, our proprietary SQL-based database system included over 10,900 technology-related companies and over 3,000 venture capital private equity sponsors/investors, as well as various other industry contacts. This proprietary SQL system allows us to maintain, cultivate and grow our industry relationships while providing us with comprehensive details on companies in the technology-related industries and their financial sponsors.
Recent Developments
On May 2, 2007, the SEC published a notice regarding our exemptive application to grant shares of restricted stock to our officers, employees and directors. The order was issued on May 23, 2007. Awards of restricted stock are also subject to the approval by our stockholders of the amended and restated 2004 Equity Incentive Plan to provide for issuances of restricted stock. If we receive such approval, we intend to make grants of restricted stock in accordance with the plan and the SEC exemptive order.
Under the securities rules that apply to business development companies, non-employee directors cannot receive any options or other equity compensation without an SEC exemptive order specifically allowing the grant of such equity awards. On February 15, 2007, we received an order of the SEC allowing us to issue options to non-employee directors. Under that original SEC order and the plan approved by the stockholders in 2006, we were permitted to issue options to purchase 20,000 shares per year to each non-employee director. No options have been issued to directors since the receipt of the order. We cannot change the number of shares granted to a non-employee director absent a new exemptive order from the SEC. We submitted an application for a new order on May 23, 2007. Subject to our stockholders’ approval of the amended and restated 2006 Non-Employee Director Plan and our receipt of a revised order of the SEC granting amended exemptive relief with respect to the options, non-employee directors are expected to receive options to purchase 10,000 shares of common stock upon their first election to the board and an additional grant of options to purchase 15,000 shares of common stock upon each subsequent reelection to the board. There can be no assurances as to when we will receive a revised exemptive order.
S-9
We estimate that our net proceeds from the sale of the 8,000,000 shares of common stock we are offering will be approximately $102.4 million and approximately $117.7 million, if the underwriters’ option is exercised in full, based on a public offering price of $13.50 per share and after deducting the underwriting discounts and commissions and estimated offering expenses payable by us.
We expect to use the net proceeds from this offering to reduce borrowings and to invest in debt and equity securities and for other general corporate purposes. Amounts repaid under our securitized credit facility will remain available for future borrowings. At May 22, 2007, our securitized credit facility bore interest at one month LIBOR plus 120 basis points and there was approximately $130.0 million outstanding. This securitized credit facility expires on May 1, 2008. We have not yet determined the amount of net proceeds to be used specifically for each of the foregoing purposes. Accordingly, our management will have flexibility in applying the net proceeds of this offering.
We anticipate that substantially all of the net proceeds from this offering will be used within six to twelve months, but in no event longer than two years. Pending such uses and investments, we will invest the net proceeds primarily in cash, cash equivalents, U.S. government securities or high-quality debt securities maturing in one year or less from the time of investment.
S-10
Subject to the terms and conditions of the underwriting agreement between us and the underwriters, the underwriters, for whom Credit Suisse Securities (USA) LLC is acting as representative, have agreed to purchase from us the following number of shares of our common stock described in this prospectus supplement at the offering price less the underwriting discounts and commissions set forth on the cover page of this prospectus.
| Underwriters |
Number of Shares | |
| Credit Suisse Securities (USA) LLC |
3,200,000 | |
| JMP Securities LLC |
2,000,000 | |
| A.G. Edwards & Sons, Inc. |
1,600,000 | |
| Piper Jaffray & Co. |
720,000 | |
| Ferris, Baker Watts, Incorporated |
480,000 | |
| Total |
8,000,000 |
The underwriting agreement provides that the obligations of the underwriters are subject to certain conditions precedent and that the underwriters will purchase all such shares of the common stock if any of these shares are purchased. The underwriters are obligated to take and pay for all of the shares of common stock offered hereby, if any are taken.
The underwriters have advised us that they propose to offer the shares of common stock to the public at the offering price set forth on the cover page of this prospectus supplement and to certain dealers at such price less a concession not in excess of $0.405 per share.
We have granted to the underwriters a 30-day option to purchase on a pro rata basis up to 1,200,000 additional shares. The option may be exercised only to cover any over-allotments of common stock.
The following table provides information regarding the per share and total underwriting discounts and commissions that we will pay to the underwriters in connection with this offering. These amounts are shown assuming both no exercise and full exercise of the underwriters’ option to purchase up to an additional shares of common stock from us.
| Per Share | Total | ||||||||
| No Exercise | Full Exercise | ||||||||
| Public offering price |
$ | 13.50 | $ | 108,000,000 | $ | 124,200,000 | |||
| Underwriting Discounts and Commissions |
$ | 0.675 | $ | 5,400,000 | $ | 6,210,000 | |||
| Proceeds, before expenses, to us |
$ | 12.825 | $ | 102,600,000 | $ | 117,990,000 | |||
The underwriters propose to offer the common stock directly to the public initially at the offering price set forth on the cover page of this prospectus supplement. If all the shares are not sold at the public offering price, the representatives may change the offering price and the other selling terms.
We expect to incur total expenses of approximately $250,000, excluding underwriting discounts and commissions, in connection with this offering.
We have agreed to indemnify the underwriters against certain liabilities, including liabilities under the Securities Act of 1933.
We, our directors and senior executive officers have agreed that during the 75 days after the date of this prospectus supplement, subject to certain exceptions, they will not, without the prior written consent of Credit Suisse Securities (USA) LLC, offer to sell, contract to sell, or otherwise sell, dispose of, loan, pledge or grant any rights with respect to (collectively, a “Disposition”), any shares, any options or warrants to purchase any shares or any securities convertible into or redeemable or exchangeable for shares now owned or hereafter acquired
S-11
directly by such person or with respect to which such person has or hereafter acquires the power of disposition. The foregoing restriction has been expressly agreed to preclude the holder of the securities from engaging in any hedging or other transaction which is designed to or reasonably expected to lead to or result in a disposition of securities during the Lock-Up period, even if such securities would be disposed of by someone other than the holder. Such prohibited hedging or other transactions would include, without limitation, any short sale (whether or not against the box) or any purchase, sale or grant of any right (including, without limitation, any put or call option) with respect to any securities. Notwithstanding anything herein to the contrary, if (i) during the last 17 days of the Lock-Up Period, the Company issues an earnings release or material news or a material event relating to the Company occurs or (ii) prior to the expiration of the Lock-Up Period, the Company announces that it will release earnings results during the 16-day period beginning on the last day of the Lock-Up Period, the foregoing restrictions shall continue to apply until the expiration of the 18-day period beginning on the issuance of the earnings release or the occurrence of the material news or material event. These lock-up agreements will cover approximately 646,632 shares of our outstanding common stock and shares underlying warrants in the aggregate and will not cover shares of common stock received as a result of participation in our dividend reinvestment plan or shares received as a result of the exercise of options and will not cover the issuance by the Company of shares pursuant to any employee or director compensation, dividend reinvestment, savings or benefit plan or distributions to the Company’s directors upon such director’s election to receive shares in lieu of cash compensation. Credit Suisse Securities (USA) LLC may, in its sole discretion, allow any of these parties to dispose of common stock or other securities prior to the expiration of the 75 day period. There are, however, no agreements between Credit Suisse Securities (USA) LLC and the parties that would allow them to do so as of the date of this prospectus supplement.
Until the distribution of the common stock is completed, rules of the Securities and Exchange Commission may limit the ability of the underwriters and certain selling group members to bid for and purchase the common stock. As an exception to these rules, the underwriters are permitted to engage in certain transactions that stabilize, maintain or otherwise affect the price of the common stock.
In connection with this offering, the underwriters may engage in stabilizing transactions, over-allotment transactions, syndicate covering transactions, penalty and market making bids in accordance with Regulation M under the Securities Act of 1934.
| • | Stabilizing transactions permit bids to purchase the underlying security so long as the stabilizing bids do not exceed a specified maximum. |
| • | Over-allotment transactions involve sales by the underwriters of the shares of common stock in excess of the number of shares the underwriters are obligated to purchase, which creates a syndicate short position. The short position may be either a covered short position or a naked short position. In a covered short position, the number of shares over-allotted by the underwriters is not greater than the number of shares that they may purchase in the over-allotment option. In a naked short position, the number of shares involved is greater than the number of shares in the over-allotment option. The underwriters may close out any covered short position by either exercising their over-allotment option and/or purchasing shares in the open market. |
| • | Syndicate covering transactions involve purchases of the shares of common stock in the open market after the distribution has been completed in order to cover syndicate short positions. In determining the source of shares to close out the short position, the underwriters will consider, among other things, the price of shares available for purchase in the open market as compared to the price at which they may purchase shares through the over-allotment option. If the underwriters sell more shares than could be covered by the over-allotment option, a naked short position, the position can only be closed out by buying shares in the open market. A naked short position is more likely to be created if the underwriters are concerned that there could be downward pressure on the price of the shares in the open market after pricing that could adversely affect investors who purchase in the offering. |
S-12
| • | Penalty bids permit representatives to reclaim a selling concession from a syndicate member when the shares of common stock originally sold by the syndicate member are purchased in a stabilizing or syndicate covering transaction to cover syndicate short positions. |
| • | In passive market making, market makers in the common stock who are underwriters or prospective underwriters may, subject to limitations, make bids for or purchases of our common stock until the time, if any, at which a stabilizing bid is made. |
These stabilizing transactions, syndicate covering transactions and penalty bids may have the effect of raising or maintaining the market price of our common stock or preventing or retarding a decline in the market price of the common stock. As a result the price of our common stock may be higher than the price that might otherwise exist in the open market.
The underwriters will deliver an accompanying prospectus and prospectus supplement to all purchasers of shares of common stock in the short sales. The purchases of shares of common stock in short sales are entitled to the same remedies under the federal securities laws as any other purchaser of shares of common stock covered by this prospectus supplement.
The underwriters are not obligated to engage in any of the transactions described above. If they do engage in any of these transactions, they may discontinue them at any time.
In relation to each Member State of the European Economic Area which has implemented the Prospectus Directive (each, a Relevant Member State), each underwriter represents and agrees that with effect from and including the date on which the Prospectus Directive is implemented in that Relevant Member State (the Relevant Implementation Date) it has not made and will not make an offer of securities to the public in that Relevant Member State prior to the publication of a prospectus in relation to the securities which has been approved by the competent authority in that Relevant Member State or, where appropriate, approved in another Relevant Member State and notified to the competent authority in that Relevant Member State, all in accordance with the Prospectus Directive, except that it may, with effect from and including the Relevant Implementation Date, make an offer of Securities to the public in that Relevant Member State at any time,
| • | to legal entities which are authorized or regulated to operate in the financial markets or, if not so authorized or regulated, whose corporate purpose is solely to invest in securities; |
| • | to any legal entity which has two or more of (1) an average of at least 250 employees during the last financial year; (2) a total balance sheet of more than €43,000,000 and (3) an annual net turnover of more than €50,000,000, as shown in its last annual or consolidated accounts; |
| • | in any other circumstances which do not require the publication by the issuer of a prospectus pursuant to Article 3 of the Prospectus Directive. |
For the purposes of this provision, the expression an “offer of Shares to the public” in relation to any Shares in any Relevant Member State means the communication in any form and by any means of sufficient information on the terms of the offer and the Shares to be offered so as to enable an investor to decide to purchase or subscribe the Shares, as the same may be varied in that Member State by any measure implementing the Prospectus Directive in that Member State and the expression Prospectus Directive means Directive 2003/71/EC and includes any relevant implementing measure in each Relevant Member State.
Each of the underwriters severally represents, warrants and agrees as follows:
| • | it has only communicated or caused to be communicated and will only communicate or cause to be communicated an invitation or inducement to engage in investment activity (within the meaning of section 21 of FSMA) to persons who have professional experience in matters relating to investments falling with Article 19(5) of the Financial Services and Markets Act 2000 (Financial Promotion) Order 2005 or in circumstances in which section 21 of FSMA does not apply to the company; and |
S-13
| • | it has complied with, and will comply with all applicable provisions of FSMA with respect to anything done by it in relation to the shares in, from or otherwise involving the United Kingdom. |
Our common stock is quoted on the Nasdaq Global Market under the trading symbol “HTGC.”
In the ordinary course of their businesses, the underwriters and/or their affiliates have in the past performed, and many continue to perform, investment banking, broker dealer, lending, financial advisory or other services for us for which they have received, or may receive, customary compensation.
The principal address of Credit Suisse Securities (USA) LLC is Eleven Madison Avenue, New York, NY 10010. The principal address of JMP Securities LLC is 600 Montgomery Street, Suite 1100, San Francisco, California 94111. The principal address of A.G. Edwards & Sons, Inc. is 333 South Hope Street, Los Angeles, California 90071. The principal address of Piper Jaffray & Co. is 800 Nicollet Mall, Minneapolis, Minnesota 55402. The principal address of Ferris, Baker Watts, Incorporated is 100 Light Street, Baltimore, Maryland 21202.
This offering is being conducted in compliance with Rule 2810 of the Conduct Rules of the National Association of Securities Dealers, Inc.
Resale Restrictions
The distribution of the common stock in Canada is being made only on a private placement basis exempt from the requirement that we prepare and file a prospectus with the securities regulatory authorities in each province where trades of common stock are made. Any resale of the common stock in Canada must be made under applicable securities laws which will vary depending on the relevant jurisdiction, and which may require resales to be made under available statutory exemptions or under a discretionary exemption granted by the applicable Canadian securities regulatory authority. Purchasers are advised to seek legal advice prior to any resale of the common stock.
Representations of Purchasers
By purchasing common stock in Canada and accepting a purchase confirmation a purchaser is representing to us and the dealer from whom the purchase confirmation is received that:
| • | the purchaser is entitled under applicable provincial securities laws to purchase the common stock without the benefit of a prospectus qualified under those securities laws, |
| • | where required by law, that the purchaser is purchasing as principal and not as agent, |
| • | the purchaser has reviewed the text above under Resale Restrictions, and |
| • | the purchaser acknowledges and consents to the provision of specified information concerning its purchase of the common stock to the regulatory authority that by law is entitled to collect the information. |
Further details concerning the legal authority for this information is available on request.
Rights of Action—Ontario Purchasers Only
Under Ontario securities legislation, certain purchasers who purchase a security offered by this prospectus supplement and prospectus during the period of distribution will have a statutory right of action for damages, or while still the owner of the common stock, for rescission against us in the event that the prospectus or this
S-14
prospectus supplement contains a misrepresentation without regard to whether the purchaser relied on the misrepresentation. The right of action for damages is exercisable not later than the earlier of 180 days from the date the purchaser first had knowledge of the facts giving rise to the cause of action and three years from the date on which payment is made for the common stock. The right of action for rescission is exercisable not later than 180 days from the date on which payment is made for the common stock. If a purchaser elects to exercise the right of action for rescission, the purchaser will have no right of action for damages against us. In no case will the amount recoverable in any action exceed the price at which the common stock were offered to the purchaser and if the purchaser is shown to have purchased the securities with knowledge of the misrepresentation, we will have no liability. In the case of an action for damages, will not be liable for all or any portion of the damages that are proven to not represent the depreciation in value of the common stock as a result of the misrepresentation relied upon. These rights are in addition to, and without derogation from, any other rights or remedies available at law to an Ontario purchaser. The foregoing is a summary of the rights available to an Ontario purchaser. Ontario purchasers should refer to the complete text of the relevant statutory provisions.
Enforcement of Legal Rights
All of our directors and officers as well as the experts named herein may be located outside of Canada and, as a result, it may not be possible for Canadian purchasers to effect service of process within Canada upon us or those persons. All or a substantial portion of our assets and the assets of those persons may be located outside of Canada and, as a result, it may not be possible to satisfy a judgment against us or those persons in Canada or to enforce a judgment obtained in Canadian courts against us or those persons outside of Canada.
Taxation and Eligibility for Investment
Canadian purchasers of common stock should consult their own legal and tax advisors with respect to the tax consequences of an investment in the common stock in their particular circumstances and about the eligibility of the for investment by the purchaser under relevant Canadian legislation.
Certain legal matters with respect to the validity of the shares of common stock we are offering will be passed upon for us by Sutherland Asbill & Brennan LLP, Washington, D.C. Certain legal matters related to the offering will be passed upon for the underwriters by Fried, Frank, Harris, Shriver & Jacobson LLP, Washington, D.C.
S-15

12,000,000 Shares Common Stock
This prospectus relates to the offer, from time to time, of 12,000,000 shares of our common stock, par value $0.001 per share by us and the resale of up to 479,568 shares of our common stock by certain current stockholders.
We may offer, from time to time, up to 12,000,000 shares of our common stock in one or more offerings. The shares of common stock may be offered at prices and terms to be described in one or more supplements to this prospectus. The offering price per share of our common stock less any underwriting commissions or discounts will not be less than the net asset value per share of our common stock at the time we make the offering.
The shares of our common stock which are offered for resale by this prospectus are offered for the accounts of the current holders of such common stock, whom we refer to as the selling holders. We will not receive any of the proceeds from the shares of common stock sold by the selling holders. We have agreed to bear specific expenses in connection with the registration and sale of the common stock being offered by the selling holders.
We are a specialty finance company that provides debt and equity growth capital to technology-related and life sciences companies at all stages of development. We primarily finance privately-held companies backed by leading venture capital and private equity firms and also may finance certain publicly-traded companies that lack access to public capital or are sensitive to equity ownership dilution. We source our investments through our principal office located in Silicon Valley, as well as additional offices in the Boston, Boulder and Chicago areas. Our goal is to be the leading structured mezzanine capital provider of choice for venture capital and private equity backed technology-related and life sciences companies requiring sophisticated and customized financing solutions. We invest primarily in structured mezzanine debt and, to a lesser extent, in senior debt and equity.
Our investment objective is to maximize our portfolio’s total return by generating current income from our debt investments and capital appreciation from our equity-related investments. We are an internally-managed, non-diversified closed-end investment company that has elected to be treated as a business development company under the Investment Company Act of 1940.
Our common stock is traded on the Nasdaq Global Market under the symbol “HTGC.” On May 8, 2007 the last reported sale price of a share of our common stock on the Nasdaq Global Market was $14.44.
An investment in our common stock involves risks and involves a heightened risk of total loss of investment. In addition, the companies in which we invest are subject to special risks. See “ Risk Factors” beginning on page 12 to read about risks that you should consider before investing in our common stock, including the risk of leverage.
This prospectus contains important information you should know before investing in our common stock. Please read it before making an investment decision and keep it for future reference. Shares of closed-end investment companies have in the past frequently traded at a discount to their net asset value. If our shares trade at a discount to net asset value, it may increase the risk of loss for purchasers in this offering.
Neither the Securities and Exchange Commission nor any state securities commission has approved or disapproved of these securities or determined if this prospectus is truthful or complete. Any representation to the contrary is a criminal offense.
We file annual, quarterly and current reports, proxy statements and other information about us with the Securities and Exchange Commission. The information is available free of charge by contacting us at 400 Hamilton Avenue, Suite 310, Palo Alto, California 94301 or by telephone calling collect at (650) 289-3060 or on our website at www.herculestech.com. The SEC also maintains a website at www.sec.gov that contains such information.
The date of this prospectus is May 16, 2007
You should rely only on the information contained in this prospectus. We have not authorized any dealer, salesperson or other person to provide you with different information or to make representations as to matters not stated in this prospectus. If anyone provides you with different or inconsistent information, you should not rely on it. This prospectus is not an offer to sell, or a solicitation of an offer to buy, any shares of common stock by any person in any jurisdiction where it is unlawful for that person to make such an offer or solicitation or to any person in any jurisdiction to whom it is unlawful to make such an offer or solicitation. The information in this prospectus is accurate only as of its date, and under no circumstances should the delivery of this prospectus or the sale of any common stock imply that the information in this prospectus is accurate as of any later date or that the affairs of Hercules Technology Growth Capital, Inc. have not changed since the date hereof. This prospectus will be updated to reflect material changes.
| Page | ||
| 1 | ||
| 8 | ||
| 10 | ||
| 12 | ||
| 29 | ||
| 30 | ||
| 31 | ||
| Management’s Discussion and Analysis of Financial Condition and Results of Operations |
33 | |
| 50 | ||
| 63 | ||
| 76 | ||
| 76 | ||
| 78 | ||
| 95 | ||
| 98 | ||
| 100 | ||
| 108 | ||
| 113 | ||
| 114 | ||
| 122 | ||
| 123 | ||
| 123 | ||
| 124 | ||
| 125 | ||
| 125 | ||
| 125 | ||
| 125 | ||
| F-1 |
Hercules Technology Growth Capital, Inc., our logo and other trademarks of Hercules Technology Growth Capital, Inc. mentioned in this prospectus are the property of Hercules Technology Growth Capital, Inc. All other trademarks or trade names referred to in this prospectus are the property of their respective owners.
This summary highlights some of the information in this prospectus and may not contain all of the information that is important to you. You should read carefully the more detailed information set forth under “Risk Factors” and the other information included in this prospectus. The following summary is qualified in its entirety by reference to the more detailed information and financial statements appearing elsewhere in this prospectus. In this prospectus, unless the context otherwise requires, the “Company,” “Hercules Technology Growth Capital,” “we,” “us” and “our” refer to Hercules Technology Growth Capital, Inc. and our wholly-owned subsidiaries Hercules Technology II, L.P., Hercules Technology SBIC Management, LLC., Hydra Management LLC and Hydra Management Co., Inc.
Our Company
We are a specialty finance company that provides debt and equity growth capital to technology-related and life sciences companies at all stages of development. Our investment objective is to maximize our portfolio’s total return by generating current income from our debt investments and capital appreciation from our equity-related investments. We are an internally-managed, non-diversified closed-end investment company that has elected to be treated as a business development company under the Investment Company Act of 1940.
During the first quarter of 2007, we entered into approximately $108.5 million of investment commitments and invested approximately $80.2 million in 9 new portfolio companies and 11 existing portfolio companies.
We primarily finance privately-held companies backed by leading venture capital and private equity firms and also may invest in select publicly-traded companies that lack access to public capital or are sensitive to equity ownership dilution. Our principal executive office is located in Silicon Valley, and we have additional offices in the Boston, Boulder, Chicago, Costa Mesa and Columbus areas. Our goal is to be the leading structured mezzanine capital provider of choice for venture capital and private equity backed technology-related and life sciences companies requiring sophisticated and customized financing solutions. Our strategy is to evaluate and invest in a broad range of ventures active in the technology and life science industries and to offer a full suite of capital products at all levels of the capital structure. We invest primarily in structured mezzanine debt and, to a lesser extent, in senior debt and equity. We use the term “structured mezzanine debt investment” to refer to any debt investment, such as a senior or subordinated secured loan, that is coupled with an equity component, including warrants, options or rights to purchase common or preferred stock. Our structured mezzanine debt investments will typically be secured by some or all of the assets of the portfolio company.
We focus our investments in companies active in technology industry sub-sectors characterized by products or services that require advanced technologies, including computer software and hardware, networking systems, semiconductors, semiconductor capital equipment, information technology infrastructure or services, Internet consumer and business services, telecommunications, telecommunications equipment, media and life sciences. Within the life sciences sub-sector, we focus on medical devices, bio-pharmaceutical, health care services and information systems companies. We refer to all of these companies as “technology-related” companies and intend, under normal circumstances, to invest at least 80% of the value of our assets in such businesses.
Our primary business objectives are to increase our net income, net operating income and net asset value by investing in structured mezzanine debt and equity of venture capital and private equity backed technology-related companies with attractive current yields and the potential for equity appreciation and realized gains. Our structured debt investments typically include warrants or other equity interests, giving us the potential to realize equity-like returns on a portion of our investment. In some cases, we receive the right to make additional equity investments in our portfolio companies in connection with future equity financing rounds. Capital that we provide directly to venture capital and private equity backed technology-related companies is generally used for growth, and in select cases for acquisitions or recapitalizations.
1
Our portfolio is comprised of, and we anticipate that our portfolio will continue to be comprised of, investments in technology-related companies at various stages of their development. Consistent with regulatory requirements, we invest primarily in United States based companies and to a lesser extent in foreign companies. To date, our emphasis has been primarily on private companies following or in connection with their first institutional round of equity financing, which we refer to as emerging-growth companies, and private companies in later rounds of financing, which we refer to as expansion-stage companies. In 2007, we expect to increase, our investment activity in established companies, comprised of private companies in one of their final rounds of equity financing prior to a liquidity event or select publicly-traded companies that lack access to public capital or are sensitive to equity ownership dilution.
Our investment professionals, including Manuel A. Henriquez, our co-founder, Chairman, President and Chief Executive Officer, is currently comprised of 17 professionals who have, on average, more than 15 years of experience in venture capital, structured finance, commercial lending or acquisition finance with the types of technology-related companies that we are targeting. We believe that we can leverage the experience and relationships of our management team to successfully identify attractive investment opportunities, underwrite prospective portfolio companies and structure customized financing solutions.
Our Market Opportunity
We believe that technology-related companies compete in one of the largest and most rapidly growing sectors of the U.S. economy and that continued growth is supported by ongoing innovation and performance improvements in technology products as well as the adoption of technology across virtually all industries in response to competitive pressures. We believe that an attractive market opportunity exists for a specialty finance company focused primarily on structured mezzanine investments in technology-related and life sciences companies for the following reasons:
| • | Technology-related companies have generally been underserved by traditional lending sources; |
| • | Unfulfilled demand exists for structured debt financing to technology-related companies; |
| • | Structured mezzanine debt products are less dilutive and complement equity financing from venture capital and private equity funds; and |
| • | Valuations currently assigned to technology-related companies in private financing rounds, while increasing in recent years, still provide a good opportunity for attractive capital returns. |
Technology-Related Companies Underserved by Traditional Lenders. We believe many viable technology-related companies backed by financial sponsors have been unable to obtain sufficient growth financing from traditional lenders, including financial services companies such as commercial banks and finance companies, in part because traditional lenders have continued to consolidate and have adopted a more risk-averse approach to lending that has resulted in tightened credit standards in recent years. More importantly, we believe traditional lenders are typically unable to underwrite the risk associated with financial sponsor-backed emerging-growth or expansion-stage companies effectively.
The unique cash flow characteristics of many technology-related companies include significant research and development expenditures and high projected revenue growth thus often making such companies difficult to evaluate from a credit perspective. In addition, the balance sheets of emerging-growth and expansion-stage companies often include a disproportionately large amount of intellectual property assets, which can be difficult to value. Finally, the speed of innovation in technology and rapid shifts in consumer demand and market share add to the difficulty in evaluating technology-related companies.
Due to the difficulties described above, we believe traditional lenders are generally refraining from entering the structured mezzanine debt marketplace for emerging-growth and expansion-stage companies, instead
2
preferring the risk-reward profile of senior debt. Traditional lenders generally do not have flexible product offerings that meet the needs of technology-related companies. The financing products offered by traditional lenders typically impose on borrowers many restrictive covenants and conditions, including limiting cash outflows and requiring a significant depository relationship to facilitate rapid liquidation.
Unfulfilled Demand for Structured Debt Financing to Technology-Related Companies. Private debt capital in the form of structured debt financing from specialty finance companies continues to be an important source of funding for technology-related companies. We believe that the level of demand for structured debt financing to emerging-growth and expansion-stage companies is a function of the level of annual venture equity investment activity. In 2006, venture capital-backed companies received, in approximately 2,454 transactions, equity financing in an aggregate amount of approximately $25.8 billion, representing an 8% increase over the preceding year, as reported by Dow Jones VentureOne. In addition, according to VentureOne, overall, the median round size in 2006 was $7 million, up from $6.5 million in 2005, and the highest annual median since 2000. For the second year in a row, equity investors are focusing more than a third of their investment activity on early-stage financings. Overall, seed- and first-round deals made up 36% of the deal flow in 2006, and about the same concentration of deal flow went to later-stage deals. As a result, we believe a range of $20 billion to $25 billion in annual equity investments to venture-backed companies will be sustainable for future years.
We believe that demand for structured debt financing is currently unfulfilled, in part because historically the largest debt capital providers to technology-related companies exited the market during 2001 while at the same time lending requirements of traditional lenders have become more stringent. We therefore believe this is an opportune time to be active in the structured lending market for technology-related companies.
Structured Mezzanine Debt Products Complement Equity Financing From Venture Capital and Private Equity Funds. We believe that technology-related companies and their financial sponsors will continue to view structured debt securities as an attractive source of capital because it augments the capital provided by venture capital and private equity funds. We believe that our structured mezzanine debt products provide access to growth capital that otherwise may only be available through incremental investments by existing equity investors. As such, we provide portfolio companies and their financial sponsors with an opportunity to diversify their capital sources. Generally, we believe emerging-growth and expansion-stage companies target a portion of their capital to be debt in an attempt to achieve a higher valuation through internal growth. In addition, because financial sponsor-backed companies have recently been more mature prior to reaching a liquidity event, we believe our investments could provide the debt capital needed to grow or recapitalize during the extended period prior to liquidity events.
Lower Valuations for Private Technology-Related Companies. During the downturn in technology industries that began in 2000, the markets saw sharp and broad declines in valuations of venture capital and private equity-backed technology-related companies. According to Dow Jones VentureOne, median pre-money valuations for venture capital-backed companies in 2000 was $25.1 million declining to a low of $10.0 million in 2003. In addition, as of December 31, 2006 median pre-money valuations for venture capital-backed companies in 2006 was $18.5 million compared to $15.0 million in 2005. While pre-money valuations have been steadily increasing since 2003, we believe the valuations currently assigned to venture capital and private equity-backed technology-related companies in private financing rounds are still relatively low and should allow us to continue to build a portfolio of equity-related securities at attractive valuation levels.
Our Business Strategy
Our strategy to achieve our investment objective includes the following key elements:
Leverage the Experience and Industry Relationships of Our Management Team and Investment Professionals. We have assembled a team of experienced investment professionals with extensive experience as venture capitalists, commercial lenders, and originators of structured debt and equity investments in technology-
3
related companies. Our investment professionals have, on average, more than 15 years of experience as equity investors in, and/or lenders to, technology-related companies. In addition, our team members have originated structured mezzanine investments in over 200 technology-related companies, representing over $1.0 billion in investments, and have developed a network of industry contacts with investors and other participants within the venture capital and private equity communities. In addition, members of our management team also have operational, research and development and finance experience with technology-related companies. We have established contacts with leading venture capital and private equity fund sponsors, public and private companies, research institutions and other industry participants, which should enable us to identify and attract well-positioned prospective portfolio companies.
We concentrate our investing activities in industries in which our investment professionals have investment experience. We believe that our focus on financing technology-related companies will enable us to leverage our expertise in structuring prospective investments, to assess the value of both tangible and intangible assets, to evaluate the business prospects and operating characteristics of technology-related companies and to identify and originate potentially attractive investments with these types of companies.
Mitigate Risk of Principal Loss and Build a Portfolio of Equity-Related Securities. We expect that our investments have the potential to produce attractive risk adjusted returns through current income, in the form of interest and fee income, as well as capital appreciation from equity-related securities. We believe that we can mitigate the risk of loss on our debt investments through the combination of loan principal amortization, cash interest payments, relatively short maturities, security interests in the assets of our portfolio companies, covenants requiring prospective portfolio companies to have certain amounts of available cash at the time of our investment and the continued support from a venture capital or private equity firm at the time we make our investment.
In addition, historically our structured debt investments typically include warrants or other equity interests, giving us the potential to realize equity-like returns on a portion of our investment. We expect, in some cases, to receive the right to make additional equity investments in our portfolio companies in connection with future equity financing rounds. We believe these equity interests will create the potential for long-term capital gains in connection with the future liquidity events of these technology-related companies.
Provide Customized Financing Complementary to Financial Sponsors’ Capital. We offer a broad range of investment structures and possess expertise and experience to effectively structure and price investments in technology-related companies. Unlike many of our competitors that only invest in companies that fit a specific set of investment parameters, we have the flexibility to structure our investments to suit the particular needs of our portfolio companies. We offer customized financing solutions ranging from senior debt to equity capital, with a focus on structured mezzanine debt.
We use our relationships in the financial sponsor community to originate investment opportunities. Because venture capital and private equity funds typically invest solely in the equity securities of their portfolio companies, we believe that our debt investments will be viewed as an attractive source of capital, both by the portfolio company and by the portfolio company’s financial sponsor. In addition, we believe that many venture capital and private equity fund sponsors encourage their portfolio companies to use debt financing for a portion of their capital needs as a means of potentially enhancing equity returns, minimizing equity dilution and increasing valuations prior to a subsequent equity financing round or a liquidity event.
Invest at Various Stages of Development. We provide growth capital to technology-related companies at all stages of development, from emerging-growth companies, to expansion-stage companies and established companies. Established companies are comprised generally of private companies in one of their final rounds of financing prior to a liquidity event or select publicly-traded companies that lack access to public capital or are sensitive to equity ownership dilution. We believe that this provides us with a broader range of potential investment opportunities than those available to many of our competitors, who generally focus their investments
4
on a particular stage in a company’s development. Because of the flexible structure of our investments and the extensive experience of our investment professionals, we believe we are well positioned to take advantage of these investment opportunities at all stages of prospective portfolio companies’ development.
Benefit from Our Efficient Organizational Structure. We believe that the perpetual nature of our corporate structure enables us to be a long-term partner for our portfolio companies in contrast to traditional mezzanine and investment funds, which typically have a limited life. In addition, because of our access to the equity markets, we believe that we may benefit from a lower cost of capital than that available to private investment funds. We are not subject to requirements to return invested capital to investors nor do we have a finite investment horizon. Capital providers that are subject to such limitations are often required to seek a liquidity event more quickly than they otherwise might, which can result in a lower overall return on an investment.
Deal Sourcing Through Our Proprietary Database. We have developed a proprietary and comprehensive structured query language-based (SQL) database system to track various aspects of our investment process including sourcing, originations, transaction monitoring and post-investment performance. As of December 31, 2006, our proprietary SQL-based database system included over 10,900 technology-related companies and over 3,000 venture capital private equity sponsors/investors, as well as various other industry contacts. This proprietary SQL system allows us to maintain, cultivate and grow our industry relationships while providing us with comprehensive details on companies in the technology-related industries and their financial sponsors.
Asset Management
We may engage in the asset management business by providing investment advisory services to externally managed funds that may be formed in the future. Such funds may focus on our lower yielding assets, such as senior debt, equipment based only financing or equity only funding. We may contribute assets currently in our portfolio to such funds to the extent that our management and Board of Directors deems it appropriate. We may, from time to time, serve as the investment manager of such funds and may receive management and other fees for such services. Such funds may have overlapping investment objectives with us and may invest in asset classes similar to those targeted by us.
Dividend Reinvestment Plan
We have adopted an opt-out dividend reinvestment plan through which distributions are paid to stockholders in the form of additional shares of our common stock, unless a stockholder elects to receive cash. See “Dividend Reinvestment Plan.” Those stockholders whose shares are held by a broker or other financial intermediary may receive distributions in cash by notifying their broker or other financial intermediary of their election.
Taxation
From incorporation through December 31, 2005, we were taxed as a corporation under Subchapter C of the Internal Revenue Code of 1986, as amended, which we refer to in this prospectus as the Code. We will elect to be treated for federal income tax purposes as a regulated investment company (a “RIC”) under Subchapter M of the Code with the filing of our federal corporate income tax return for 2006, which election will be effective as of January 1, 2006. As a RIC, we generally will not pay corporate-level federal income taxes on any ordinary income or capital gains that we distribute to our stockholders as dividends. We may be required, however, to pay corporate-level federal income taxes on gains built into our assets under certain circumstances. See “Certain United States Federal Income Tax Considerations—Conversion to Regulated Investment Company
5
Status.” To obtain and maintain the federal income tax benefits of RIC status, we must meet specified source-of-income and asset diversification requirements and distribute annually an amount equal to at least 90% of the sum of our net ordinary income and realized net short-term capital gains in excess of realized net long-term capital losses, if any, out of assets legally available for distribution. See “Distributions.” There is no assurance that we will meet these tests and be eligible to make a RIC election. If we do not qualify or do not make a RIC election, we would be taxed as a C corporation.
Use of Proceeds
We intend to use the net proceeds from selling shares of common stock for general corporate purposes, which includes investing in debt and equity securities, repayment of indebtedness and other general corporate purposes. The supplement to this prospectus relating to an offering will more fully identify the use of proceeds from such offering. We will not receive any proceeds from the sale of the common stock by the selling holders.
Leverage
We borrow funds to make additional investments, and we have granted, and may in the future grant, a security interest in our assets to a lender in connection with any such borrowings, including any borrowings by any of our subsidiaries. We use this practice, which is known as “leverage,” to attempt to increase returns to our common stockholders. However, leverage involves significant risks. See “Risk Factors.” With certain limited exceptions, we are only allowed to borrow amounts such that our asset coverage, as defined in the 1940 Act, equals at least 200% after such borrowing. Our asset coverage as of March 31, 2007 was approximately 339%. The amount of leverage that we employ will depend on our assessment of market and other factors at the time of any proposed borrowing. As of March 31, 2007, we had outstanding $113.0 million drawn under our securitization credit facility. See “Management’s Discussion & Analysis of Financial Condition—Borrowings.” One of our subsidiaries is licensed as a Small Business Investment Company under the Small Business Investment Act of 1958; and on January 30, 2007, it received notification that its initial application for leverage had been approved allowing it to borrow up to $50.0 million. On April 26, 2007, our subsidiary borrowed $12.0 million under the SBA program. In May 2007, we submitted an application for approval to borrow an additional $77.2 million under the SBA program.
Distributions
We intend to continue to distribute quarterly dividends to our stockholders. The amount of our quarterly distributions will be determined by our Board of Directors out of assets legally available for distribution. We will elect to be treated as a RIC when we file our 2006 federal income tax return, and as such, to distribute with respect to 2006 (and annually thereafter) to our stockholders at least 90% of the sum of our net ordinary income and realized net short-term capital gains in excess of realized net long-term capital losses, if any. In addition, prior to the end of our first tax year as a RIC, we will be required to make a distribution to our stockholders equal to the amount of any undistributed earnings and profits from the period prior to our RIC election. Currently, we intend to retain some or all of our realized net long-term capital gains in order to build our per share net asset value. As a result, we will elect as a RIC to make deemed distributions of such amounts to our stockholders. We may, in the future, make actual distributions to our stockholders of some or all of our realized net long-term capital gains. See “Distributions.”
6
Principal Risk Factors
Investing in us involves certain risks relating to our structure and our investment objective that you should consider before deciding whether to invest. In addition, we expect that our portfolio will continue to consist primarily of securities issued by privately-held technology-related companies, which generally require additional capital to become profitable. These investments may involve a high degree of business and financial risk, and they are generally illiquid. Our portfolio companies typically will require additional outside capital beyond our investment in order to succeed or to fully repay the amounts owed to us. A large number of entities compete for the same kind of investment opportunities as we seek.
We borrow funds to make our investments in portfolio companies. As a result, we are exposed to the risks of leverage, which may be considered a speculative investment technique. Borrowings magnify the potential for gain and loss on amounts invested and, therefore increase the risks associated with investing in our common stock. Also, we are subject to certain risks associated with valuing our portfolio, changing interest rates, accessing additional capital, fluctuating quarterly results, and operating in a regulated environment. See “Risk Factors” beginning on page 12 for a discussion of factors you should carefully consider before deciding whether to invest in our common stock.
Certain Anti-Takeover Provisions
Our charter and bylaws, as well as certain statutes and regulations, contain provisions that may have the effect of discouraging a third party from making an acquisition proposal for our company. This could delay or prevent a transaction that could give our stockholders the opportunity to realize a premium over the price for their securities.
General Information
Our principal executive offices are located at 400 Hamilton Avenue, Suite 310, Palo Alto, California 94301, and our telephone number is (650) 289-3060. We also have offices in Boston, Massachusetts; Boulder, Colorado; Chicago, Illinois and the Columbus, Ohio areas. We maintain a website on the Internet at www.herculestech.com. Information contained in our website is not incorporated by reference into this prospectus, and you should not consider that information to be part of this prospectus.
We file annual, quarterly and current periodic reports, proxy statements and other information with the SEC under the Securities Exchange Act of 1934, which we refer to as the Exchange Act. This information is available at the SEC’s public reference room at 100 F Street, N.E., Washington, D.C. 20549. You may obtain information about the operation of the SEC’s public reference room by calling the SEC at 1-800-SEC-0330. In addition, the SEC maintains an Internet website, at www.sec.gov, that contains reports, proxy and information statements, and other information regarding issuers, including us, who file documents electronically with the SEC.
7
The following table is intended to assist you in understanding the various costs and expenses that an investor in our common stock will bear directly or indirectly. However, we caution you that some of the percentages indicated in the table below are estimates and may vary. Except where the context suggests otherwise, whenever this prospectus contains a reference to fees or expenses paid by “you” or “us” or that “we” will pay fees or expenses, stockholders will indirectly bear such fees or expenses as investors in Hercules Technology Growth Capital.
| Stockholder Transaction Expenses (as a percentage of the public offering price): |
|||
| Sales load (as a percentage of offering price)(1) |
% | ||
| Offering expenses |
%(2) | ||
| Dividend reinvestment plan fees |
%(3) | ||
| Total stockholder transaction expenses (as a percentage of the public offering price) |
% | ||
| Annual Expenses (as a percentage of net assets attributable to common stock):(4) |
|||
| Operating expenses |
5.1 | %(5)(6) | |
| Interest payments on borrowed funds |
2.8 | %(7) | |
| Fees paid in connection with borrowed funds |
0.3 | %(8) | |
| Acquired fund fees and expenses(9) |
— | % | |
| Total annual expenses |
8.2 | %(10) | |
| (1) | In the event that the shares of common stock to which this prospectus relates are sold to or through underwriters, a corresponding prospectus supplement will disclose the applicable sales load. We will not pay any underwriting discount or commission, and we will not receive any of the proceeds from shares sold by the selling stockholders. |
| (2) | The percentage reflects estimated offering expenses of approximately $575,000. |
| (3) | The expenses associated with the administration of our dividend reinvestment plan are included in “Operating expenses.” We pay all brokerage commissions incurred with respect to open market purchases, if any, made by the administrator under the plan. For more details about the plan, see “Dividend Reinvestment Plan.” |
| (4) | “Average net assets attributable to common stock” equals estimated weighted average net assets for 2007 which is approximately $265.6 million. |
| (5) | “Operating expenses” represent our estimated expenses for the year ending December 31, 2007. This percentage for the year ended December 31, 2006, was approximately 8.4%. |
| (6) | We do not have an investment adviser and are internally managed by our executive officers under the supervision of our Board of Directors. As a result, we do not pay investment advisory fees, but instead we pay the operating costs associated with employing investment management professionals. |
| (7) | “Interest payments on borrowed funds” represents estimated annualized interest payments on borrowed funds for 2007. Citigroup has an equity participation right through a warrant participation agreement on the pool of loans and warrants and shares underlying the warrants collateralized under the Citigroup facility. Pursuant to the warrant participation agreement, we granted to Citigroup a 10% participation in all warrants held as collateral. As a result, Citigroup is entitled to 10% of the realized gains on the warrants until the realized gains paid to Citigroup pursuant to the agreement equals $3,750,000 (the “Maximum Participation Limit”). The obligations under the warrant participation agreement continue even after the Citigroup facility is terminated until the Maximum Participation Limit has been reached. Since inception of the agreement in 2005, we have paid Citigroup approximately $292,000 under the warrant participation agreement thereby reducing our realized gains. During 2006, we reduced our realized gain by $221,000 and recorded a liability and reduced our unrealized gain by approximately $35,000 for unrealized gains in our warrant and equity investments due Citigroup under our warrant participation agreement. During the three months ended March 31, 2007, we reduced our realized gain by approximately $16,000 for Citigroup’s participation in the gain on sale of an equity security and we recorded an additional liability and reduced our unrealized appreciation by approximately $55,000 for Citigroup’s participation in unrealized appreciation in the warrant portfolio. Based on our average borrowings for the year ending December 31, 2006 and the amount of the reduction we recorded for our realized and unrealized gains for 2006, the additional cost of our borrowings as a result of the warrant participation agreement could be approximately 0.31%. There can be no assurances that the unrealized gains on the warrants will not be higher or lower in future periods due to fluctuations in the value of the warrants, thereby increasing or reducing the effect on the cost of borrowing. The value of their participation right on unrealized gains in the related equity investments since inception of the agreement was approximately $432,000 at March 31, 2007 and is included in accrued liabilities and reduces the unrealized gain recognized by the us at March 31, 2007. |
| (8) | “Fees paid in connection with borrowed funds” represents estimated fees paid in connection with borrowed funds for 2007. |
| (9) | For the year ended December 31, 2006, we did not have any investments in shares of Acquired Funds that are not consolidated and, as a result, we did not directly or indirectly incur any fees from Acquired Funds. |
| (10) | “Total annual expenses” is the sum of “operating expenses,” “interest payments on borrowed funds” and “fees paid in connection with borrowed funds.” |
8
Example
The following example demonstrates the projected dollar amount of total cumulative expenses that would be incurred over various periods with respect to a hypothetical investment in our common stock. These amounts are based upon our payment of annual operating expenses at the levels set forth in the table above and assume no additional leverage.
| 1 Year | 3 Years | 5 Years | 10 Years | |||||||||
| You would pay the following expenses on a $1,000 investment, assuming a 5% annual return |
$ | 126.44 | $ | 272.22 | $ | 409.04 | $ | 715.39 | ||||
The example and the expenses in the tables above should not be considered a representation of our future expenses, and actual expenses may be greater or lesser than those shown. Moreover, while the example assumes, as required by the applicable rules of the SEC, a 5% annual return, our performance will vary and may result in a return greater or lesser than 5%. In addition, while the example assumes reinvestment of all dividends and distributions at net asset value, participants in our dividend reinvestment plan may receive shares valued at the market price in effect at that time. This price may be at, above or below net asset value. See “Dividend Reinvestment Plan” for additional information regarding our dividend reinvestment plan.
9
SELECTED CONSOLIDATED FINANCIAL DATA
The selected consolidated financial data should be read in conjunction with “Management’s Discussion and Analysis of Financial Condition and Results of Operations” “Senior Securities” on page 71 and the consolidated financial statements and related notes included elsewhere herein. The selected balance sheet data as of the end of fiscal 2006, 2005 and the period from February 2, 2004 (commencement of operations) to December 31, 2004 presented below, and the selected income statement data for fiscal 2006, 2005 and the period from February 2, 2004 (commencement of operations) to December 31, 2004 have been derived from our audited financial statements included elsewhere herein, which have been audited by Ernst & Young LLP, an independent registered public accounting firm. The selected balance sheet data as of March 31, 2007 presented below and the selected income statement data for the fiscal quarter then ended have been derived from our unaudited financial statements included elsewhere herein. In the opinion of management, the quarterly financial information derived from unaudited financial information, reflects all adjustments (consisting only of normal recurring adjustments) which are necessary to present fairly the results for the interim period. The historical data are not necessarily indicative of results to be expected for any future period.
| Quarter Ended March 31, 2007 |
Quarter Ended March 31, 2006 |
Year Ended December 31, 2006 |
Year Ended December 31, 2005 |
Period from February 2, 2004 (commencement of operations) to December 31, 2004 |
||||||||||||||
| (unaudited) | (unaudited) | |||||||||||||||||
| Investment income: |
||||||||||||||||||
| Interest |
$ | 9,035,989 | $ | 5,634,539 | $ | 26,278,090 | $ | 9,791,214 | $ | 214,100 | ||||||||
| Fees |
642,957 | 852,594 | 3,230,366 | 875,429 | — | |||||||||||||
| Total investment income |
9,678,946 | 6,487,133 | 29,508,456 | 10,666,643 | 214,100 | |||||||||||||
| Operating expenses: |
||||||||||||||||||
| Interest |
685,965 | 1,676,982 | 5,770,485 | 1,800,536 | — | |||||||||||||
| Loan fees |
266,108 | 250,793 | 809,907 | 1,098,507 | — | |||||||||||||
| Compensation and benefits |
1,939,561 | 1,205,081 | 5,778,862 | 3,705,784 | 1,164,504 | |||||||||||||
| General and administrative |
1,308,235 | 1,185,392 | 5,408,785 | 2,285,038 | 411,418 | |||||||||||||
| Stock-based compensation |
253,750 | 123,000 | 617,600 | 252,000 | 680,000 | |||||||||||||
| Total operating expenses |
4,453,619 | 4,441,248 | 18,385,639 | 9,141,865 | 2,255,922 | |||||||||||||
| Net investment income (loss) before provision for income tax |
||||||||||||||||||
| and investment gains and losses |
5,225,327 | 2,045,885 | 11,122,817 | 1,524,778 | (2,041,822 | ) | ||||||||||||
| Income tax expense. |
— | 1,760,000 | 643,088 | 255,000 | — | |||||||||||||
| Net investment income (loss) |
5,225,327 | 285,885 | 10,479,729 | 1,269,778 | (2,041,822 | ) | ||||||||||||
| Net realized gain (loss) on investments. |
289,702 | (1,740,370 | ) | (1,603,692 | ) | 481,694 | — | |||||||||||
| Net increase in unrealized appreciation on investments |
816,053 | 3,959,481 | 2,507,561 | 353,093 | — | |||||||||||||
| Net realized and unrealized gain |
1,105,755 | 2,219,111 | 903,869 | 834,787 | — | |||||||||||||
| Net increase (decrease) in net assets resulting from operations |
$ | 6,331,082 | $ | 2,504,996 | $ | 11,383,598 | $ | 2,104,565 | $ | (2,041,822 | ) | |||||||
| Cash dividends declared per common share |
$ | 0.30 | $ | 0.30 | $ | 0.90 | $ | 0.33 | $ | — | ||||||||
| As of March 31, | As of December 31, | |||||||||||||||||
| 2007 | 2006 | 2006 | 2005 | 2004 | ||||||||||||||
| (unaudited) | (unaudited) | |||||||||||||||||
| Balance sheet data: |
||||||||||||||||||
| Investments, at value |
$ | 342,483,418 | $ | 176,800,736 | $ | 283,233,751 | $ | 176,673,226 | $ | 16,700,000 | ||||||||
| Cash and cash equivalents |
41,488,328 | 31,554,481 | 16,404,214 | 15,362,447 | 8,678,329 | |||||||||||||
| Total assets |
386,272,034 | 208,576,310 | 301,142,209 | 193,647,879 | 25,232,672 | |||||||||||||
| Total net assets |
269,610,740 | 119,039,735 | 255,412,822 | 114,352,330 | 25,078,133 | |||||||||||||
| Other data: |
||||||||||||||||||
| Total debt investments, at value |
322,664,359 | 164,078,665 | 266,723,504 | 166,646,172 | 16,700,000 | |||||||||||||
| Total warrant investments, at value |
10,499,774 | 8,013,898 | 8,440,963 | 5,159,791 | — | |||||||||||||
| Total equity investments, at value |
9,319,284 | 4,708,173 | 8,069,284 | 4,867,263 | — | |||||||||||||
| Unfunded commitments |
74,677,793 | 81,656,637 | 55,500,000 | 30,200,000 | 5,000,000 | |||||||||||||
| Net asset value per share(1) |
$ | 11.68 | $ | 11.63 | $ | 11.65 | $ | 11.67 | $ | 12.18 | ||||||||
| (1) | Based on common shares outstanding at period end. |
10
The following tables set forth certain quarterly financial information for each of the twelve quarters ended December 31, 2006. This information was derived from our unaudited consolidated financial statements. Results for any quarter are not necessarily indicative of results for the full year or for any future quarter.
| Quarter Ended | ||||||||||||||||
| 3/31/06 | 6/30/06 | 9/30/06 | 12/31/06 | |||||||||||||
| Total investment income |
$ | 6,487,133 | $ | 6,787,911 | $ | 7,544,032 | $ | 8,689,380 | ||||||||
| Net investment income (loss) before provision for income tax expense |
2,045,885 | 2,467,508 | 3,117,155 | 3,492,269 | ||||||||||||
| Net investment income (loss) |
2,504,996 | 3,366,372 | 1,572,639 | 3,939,591 | ||||||||||||
| Net investment income per common share (basic) |
$ | 0.25 | $ | 0.26 | $ | 0.12 | $ | 0.23 | ||||||||
| Quarter Ended | ||||||||||||||||
| 3/31/05 | 6/30/05 | 9/30/05 | 12/31/05 | |||||||||||||
| Total investment income |
$ | 753,973 | $ | 1,912,824 | $ | 3,659,998 | $ | 4,339,848 | ||||||||
| Net investment income (loss) before provision for income tax expense |
32,370 | (333,597 | ) | 884,834 | 941,171 | |||||||||||
| Net investment income (loss) |
32,370 | 709,795 | 1,561,924 | (199,524 | ) | |||||||||||
| Net investment income per common share (basic) |
$ | 0.01 | $ | 0.14 | $ | 0.16 | $ | (0.02 | ) | |||||||
| Quarter Ended | ||||||||||||||||
| 3/31/2004(1)(2) | 6/30/04 | 9/30/04 | 12/31/04 | |||||||||||||
| Total investment income |
$ | 2,435 | $ | 2,822 | $ | 49,419 | $ | 159,424 | ||||||||
| Net investment income (loss) before provision for income tax expense |
(166,915 | ) | (993,029 | ) | (335,823 | ) | (546,055 | ) | ||||||||
| Net investment income (loss) |
(166,915 | ) | (993,029 | ) | (335,823 | ) | (546,055 | ) | ||||||||
| Net investment income per common share (basic) |
$ | — | $ | (5.43 | ) | $ | (0.16 | ) | $ | (0.02 | ) | |||||
| (1) | Operations commenced February 2, 2004. |
| (2) | There we no common shares outstanding in the first quarter of 2004. |
11
Investing in our common stock involves a high degree of risk. Before you invest in shares of our common stock, you should be aware of various risks, including those described below. You should carefully consider these risks, together with all of the other information included in this prospectus, before you decide whether to make an investment in our common stock. The risks set forth below are not the only risks we face. If any of the following risks occur, our business, financial condition and results of operations could be materially adversely affected. In such case, our net asset value and the trading price of our common stock could decline, and you may lose all or part of your investment.
Risks Related to our Business and Structure
We have a limited operating history as a business development company, which may affect our ability to manage our business and may impair your ability to assess our prospects.
We were incorporated in December 2003 and commenced investment operations in September 2004. We are subject to all of the business risks and uncertainties associated with any new business enterprise, including the risk that we will not achieve our investment objective and that the value of our common stock could decline substantially. We have limited operating history as a business development company and as a RIC. As a result, we have limited operating results under these regulatory frameworks that can demonstrate to you either their effect on the business or our ability to manage the business within these frameworks. See “Regulation” and “Certain United States Federal Income Tax Considerations.” If we fail to maintain our status as a business development company or fail to qualify as a RIC, our operating flexibility and results of operations would be significantly affected.
We are dependent upon key management personnel for our future success, particularly Manuel A. Henriquez, and if we are not able to hire and retain qualified personnel, or if we lose any member of our senior management team, our ability to implement our business strategy could be significantly harmed.
We depend upon the members of our senior management, particularly Mr. Henriquez, as well as other key personnel for the identification, final selection, structuring, closing and monitoring of our investments. These employees have critical industry experience and relationships on which we rely to implement our business plan. If we lose the services of Mr. Henriquez, or of any other senior management members, we may not be able to operate the business as we expect, and our ability to compete could be harmed, which could cause our operating results to suffer. We believe our future success will depend, in part, on our ability to identify, attract and retain sufficient numbers of highly skilled employees. If we do not succeed in identifying, attracting and retaining such personnel, we may not be able to operate our business as we expect.
Our business model depends to a significant extent upon strong referral relationships with venture capital and private equity fund sponsors, and our inability to develop or maintain these relationships, or the failure of these relationships to generate investment opportunities, could adversely affect our business.
We expect that members of our management team will maintain their relationships with venture capital and private equity firms, and we will rely to a significant extent upon these relationships to provide us with our deal flow. If we fail to maintain our existing relationships or to develop new relationships with other firms or sources of investment opportunities, then we will not be able to grow our investment portfolio. In addition, persons with whom members of our management team have relationships are not obligated to provide us with investment opportunities and, therefore, there is no assurance that such relationships will lead to the origination of debt or other investments.
12
We operate in a highly competitive market for investment opportunities, and we may not be able to compete effectively.
A large number of entities compete with us to make the types of investments that we plan to make in prospective portfolio companies. We compete with a large number of venture capital and private equity firms, as well as with other investment funds, investment banks and other sources of financing, including traditional financial services companies such as commercial banks and finance companies. Many of our competitors are substantially larger and have considerably greater financial, technical, marketing and other resources than we do. For example, some competitors may have a lower cost of funds and/or access to funding sources that are not available to us. This may enable some competitors to make commercial loans with interest rates that are comparable to or lower than the rates that we typically offer. We may lose prospective portfolio companies if we do not match competitors’ pricing, terms and structure. If we do match competitors’ pricing, terms or structure, we may experience decreased net interest income and increased risk of credit losses. In addition, some of our competitors may have higher risk tolerances or different risk assessments, which could allow them to consider a wider variety of investments, establish more relationships and build their market shares. Furthermore, many potential competitors are not subject to the regulatory restrictions that the 1940 Act imposes on us as a business development company or that the Code would impose on us as a RIC. If we are not able to compete effectively, our business, financial condition, and results of operations will be adversely affected. As a result of this competition, there can be no assurance that we will be able to identify and take advantage of attractive investment opportunities that we identify, or that we will be able to fully invest our available capital.
Because we intend to distribute substantially all of our income to our stockholders if we are treated as a RIC, we will continue to need additional capital to finance our growth. If additional funds are unavailable or not available on favorable terms, our ability to grow will be impaired.
In order to satisfy the tax requirements applicable to a RIC, to avoid payment of excise taxes and to minimize or avoid payment of income taxes, we intend as a RIC to distribute to our stockholders substantially all of our ordinary income and realized net capital gains except for certain realized net long-term capital gains, some or all of which we currently intend to retain, pay applicable income taxes with respect thereto and elect to treat as deemed distributions to our stockholders. As a business development company, we generally are required to meet a coverage ratio of total assets to total borrowings and other senior securities, which includes all of our borrowings and any preferred stock that we may issue in the future, of at least 200%. This requirement limits the amount that we may borrow. Because we will continue to need capital to grow our loan and investment portfolio, this limitation may prevent us from incurring debt and require us to raise additional equity at a time when it may be disadvantageous to do so. While we expect to be able to borrow and to issue additional debt and equity securities, we cannot assure you that debt and equity financing will be available to us on favorable terms, or at all, and debt financings may be restricted by the terms of any of our outstanding borrowings. In addition, as a business development company, we generally are not permitted to issue equity securities priced below net asset value without stockholder approval and approval of our independent directors. If additional funds are not available to us, we could be forced to curtail or cease new lending and investment activities, and our net asset value could decline.
Because we borrow money, there could be increased risk in investing in our company.
Lenders have fixed dollar claims on our assets that are superior to the claims of stockholders, and we have granted, and may in the future grant, lenders a security interest in our assets in connection with borrowings. In the case of a liquidation event, those lenders would receive proceeds before our stockholders. In addition, borrowings, also known as leverage, magnify the potential for gain or loss on amounts invested and, therefore, increase the risks associated with investing in our securities. Leverage is generally considered a speculative investment technique. If the value of our assets increases, then leveraging would cause the net asset value attributable to our common stock to increase more than it otherwise would have had we not leveraged. Conversely, if the value of our assets decreases, leveraging would cause the net asset value attributable to our common stock to decline more than it otherwise would have had we not leveraged. Similarly, any increase in our
13
revenue in excess of interest expense on our borrowed funds would cause our net income to increase more than it would without the leverage. Any decrease in our revenue would cause our net income to decline more than it would have had we not borrowed funds and could negatively affect our ability to make distributions on common stock. Our ability to service any debt that we incur will depend largely on our financial performance and will be subject to prevailing economic conditions and competitive pressures. We and, indirectly our stockholders will bear the cost associated with our leverage activity. Our securitized credit facility with Citigroup Global Markets Realty Corp. and which we refer to as the Citigroup facility contains financial and operating covenants that could restrict our business activities, including our ability to declare dividends if we default under certain provisions.
As of March 31, 2007, we had outstanding indebtedness of $113.0 million pursuant to our securitized credit facility with Citigroup Global Market Realty Corp., and which we refer to as the Citigroup Facility. The Citigroup facility bears a weighted average annual interest rate of LIBOR plus 1.20%. If our portfolio of investments fails to provide adequate returns and we are unable to otherwise raise funds, we may be unable to make interest or principal payments on our indebtedness as they come due. In order for us to cover annual interest payments on indebtedness, we must achieve annual returns on our assets of at least 2% as of March 31, 2007. We expect, in the future, to borrow from, and issue senior debt securities to, banks, insurance companies and other lenders, including additional borrowings pursuant to the Citigroup Facility. See “Management’s Discussion and Analysis of Financial Condition—Borrowings.” In addition, we expect to continue to pursue financing from the Small Business Administration under its Small Business Investment Company program. As of May 2007, we have borrowed $12.0 million under the SBA program. We are approved to borrow up to $50.0 million and have applied for approval to borrow an additional $77.2 million. See “Regulation—Small Business Administration Regulations.”
As a business development company, we generally are required to meet a coverage ratio of total assets to total borrowings and other senior securities, which include all of our borrowings and any preferred stock that we may issue in the future, of at least 200%. If this ratio declines below 200%, we may not be able to incur additional debt and may need to sell a portion of our investments to repay some debt when it is disadvantageous to do so, and we may not be able to make distributions.
Illustration. The following table illustrates the effect of leverage on returns from an investment in our common stock assuming various annual returns, net of expenses. The calculations in the table below are hypothetical and actual returns may be higher or lower than those appearing in the table below.
| Assumed Return on Our Portfolio (Net of Expenses) |
|||||||||||||||
| (10)% | (5)% | 0% | 5% | 10% | |||||||||||
| Corresponding return to stockholder(1) |
(15.63 | )% | (9.73 | )% | (3.82 | )% | 2.08 | % | 7.98 | % | |||||
| (1) | Assumes $301 million in total assets, $150 million in debt outstanding, $255 million in stockholders’ equity, and an average cost of funds of 6.50%, which is the approximate cost of funds of the warehouse facility for the period ended March 31, 2007. Actual interest payments may be different. |
Because most of our investments typically are not in publicly-traded securities, there is uncertainty regarding the value of our investments, which could adversely affect the determination of our net asset value.
At March 31, 2007, approximately 89% of our total assets represented investments in portfolio companies of which, 99% are valued at fair value by the Board of Directors. We expect our investments to continue to consist primarily of securities issued by privately-held companies, the fair value of which is not readily determinable. In addition, we are not permitted to maintain a general reserve for anticipated loan losses. Instead, we are required by the 1940 Act to specifically value each investment and record an unrealized gain or loss for any asset that we believe has increased or decreased in value. There is no single standard for determining fair value in good faith. We value these securities at fair value as determined in good faith by our Board of Directors, based on the recommendations of our Board of Directors’ Valuation Committee. The Valuation Committee utilizes its best judgment in arriving at the fair value of these securities. As a result, determining fair value requires that judgment be applied to the specific facts and circumstances of each portfolio investment while employing a consistently applied valuation process for the types of investments we make. However, the Board of Directors retains ultimate
14
authority as to the appropriate valuation of each investment. Because such valuations are inherently uncertain and may be based on estimates, our determinations of fair value may differ materially from the values that would be assessed if a ready market for these securities existed. We adjust quarterly the valuation of our portfolio to reflect the Board of Directors’ determination of the fair value of each investment in our portfolio. Any changes in fair value are recorded in our statement of operations as net change in unrealized appreciation or depreciation. Our net asset value could be adversely affected if our determinations regarding the fair value of our investments were materially higher than the values that we ultimately realize upon the disposal of such securities.
Our financial results could be negatively affected if a significant portfolio investment fails to perform as expected.
Our total investment in companies may be significant individually or in the aggregate. As a result, if a significant investment in one or more companies fails to perform as expected, our financial results could be more negatively affected and the magnitude of the loss could be more significant than if we had made smaller investments in more companies. The following table shows the fair value of investments held at March 31, 2007 that are greater than 5% of net assets:
| March 31, 2007 | ||||||
| Fair Value | Percentage of Net Assets |
|||||
| IKANO Communications, Inc. |
$ | 22,581,160 | 8.4 | % | ||
| QuatRx Pharmaceuticals Company |
17,651,987 | 6.6 | % | |||
| Aveo Pharmaceuticals, Inc. |
15,012,526 | 5.6 | % | |||
| Portola Pharmaceuticals, Inc. |
15,005,423 | 5.6 | % | |||
| Luminus Devices, Inc. |
14,567,237 | 5.4 | % | |||
| Wageworks, Inc. |
14,071,113 | 5.2 | % | |||
Our financial results could be negatively affected if these portfolio companies or any of our other significant portfolio companies encounter financial difficulty and fail to repay their obligations or to perform as expected.
Regulations governing our operations as a business development company affect our ability to, and the manner in which, we raise additional capital, which may expose us to risks.
Our business will require a substantial amount of capital. We may acquire additional capital from the issuance of senior securities, including borrowings, securitization transactions or other indebtedness, or the issuance of additional shares of our common stock. However, we may not be able to raise additional capital in the future on favorable terms or at all. We may issue debt securities, other evidences of indebtedness or preferred stock, and we may borrow money from banks or other financial institutions, which we refer to collectively as “senior securities,” up to the maximum amount permitted by the 1940 Act. The 1940 Act permits us to issue senior securities in amounts such that our asset coverage, as defined in the 1940 Act, equals at least 200% after each issuance of senior securities. Our ability to pay dividends or issue additional senior securities would be restricted if our asset coverage ratio were not at least 200%. If the value of our assets declines, we may be unable to satisfy this test. If that happens, we may be required to liquidate a portion of our investments and repay a portion of our indebtedness at a time when such sales may be disadvantageous. As a result of issuing senior securities, we would also be exposed to typical risks associated with leverage, including an increased risk of loss. If we issue preferred stock, the preferred stock would rank “senior” to common stock in our capital structure, preferred stockholders would have separate voting rights and might have rights, preferences, or privileges more favorable than those of our common stockholders and the issuance of preferred stock could have the effect of delaying, deferring, or preventing a transaction or a change of control that might involve a premium price for holders of our common stock or otherwise be in your best interest.
To the extent that we are constrained in our ability to issue debt or other senior securities, we will depend on issuances of common stock to finance operations. Other than in certain limited situations such as rights offerings, as a business development company, we are generally not able to issue our common stock at a price below net
15
asset value without first obtaining required approvals from our stockholders and our independent directors. If we raise additional funds by issuing more common stock or senior securities convertible into, or exchangeable for, our common stock, then the percentage ownership of our stockholders at that time will decrease, and you might experience dilution. In addition to issuing securities to raise capital as described above, we anticipate that, in the future, we may securitize our loans to generate cash for funding new investments. An inability to successfully securitize our loan portfolio could limit our ability to grow our business and fully execute our business strategy.
When we are a debt or minority equity investor in a portfolio company, we may not be in a position to control the entity, and management of the company may make decisions that could decrease the value of our portfolio holdings.
We make both debt and minority equity investments; therefore, we are subject to the risk that a portfolio company may make business decisions with which we disagree, and the stockholders and management of such company may take risks or otherwise act in ways that do not serve our interests. As a result, a portfolio company may make decisions that could decrease the value of our portfolio holdings.
If we do not invest a sufficient portion of our assets in qualifying assets, we could fail to qualify as a business development company or be precluded from investing according to our current business strategy.
As a business development company, we may not acquire any assets other than “qualifying assets” unless, at the time of and after giving effect to such acquisition, at least 70% of our total assets are qualifying assets. See “Regulation.”
We may be precluded from investing in what we believe are attractive investments if such investments are not qualifying assets for purposes of the 1940 Act. If we do not invest a sufficient portion of our assets in qualifying assets, we could lose our status as a business development company, which would have a material adverse effect on our business, financial condition and results of operations. Similarly, these rules could prevent us from making follow-on investments in existing portfolio companies (which could result in the dilution of our position) or could require us to dispose of investments at inappropriate times in order to comply with the 1940 Act. If we need to dispose of such investments quickly, it would be difficult to dispose of such investments on favorable terms. For example, we may have difficulty in finding a buyer and, even if we do find a buyer, we may have to sell the investments at a substantial loss.
We may have difficulty paying our required distributions if we recognize income before or without receiving cash representing such income.
In accordance with generally accepted accounting principles and tax requirements, we include in income certain amounts that we have not yet received in cash, such as contracted payment-in-kind interest, which represents contractual interest added to a loan balance and due at the end of such loan’s term. In addition to the cash yields received on our loans, in some instances, certain loans may also include any of the following: end-of-term payments, exit fees, balloon payment fees or prepayment fees. The increases in loan balances as a result of contracted payment-in-kind arrangements are included in income for the period in which such payment-in-kind interest was accrued, which is often in advance of receiving cash payment, and are separately identified on our statements of cash flows. We also may be required to include in income certain other amounts that we will not receive in cash.
Any warrants that we receive in connection with our debt investments will generally be valued as part of the negotiation process with the particular portfolio company. As a result, a portion of the aggregate purchase price for the debt investments and warrants will be allocated to the warrants that we receive. This will generally result in “original issue discount” for tax purposes, which we must recognize as ordinary income, increasing the amount that we are required to distribute to qualify for the federal income tax benefits applicable to RICs. Because these warrants would not produce distributable cash for us at the same time as we are required to make distributions in respect of the related original issue discount, we would need to obtain cash from other sources to satisfy such distribution requirements. If we are unable to obtain cash from other sources to satisfy such
16
distribution requirements, we may fail to qualify for the federal income tax benefits allowable to RICs and, thus, become subject to a corporate-level income tax on all our income.
Other features of the debt instruments that we hold may also cause such instruments to generate an original issue discount, resulting in a dividend distribution requirement in excess of current cash interest received. Since in certain cases we may recognize income before or without receiving cash representing such income, we may have difficulty meeting the RIC tax requirement to distribute at least 90% of our net ordinary income and realized net short-term capital gains in excess of realized net long-term capital losses, if any. If we are unable to meet these distribution requirements, we will not qualify for the federal income tax benefits allowable to a RIC. Accordingly, we may have to sell some of our assets, raise additional debt or equity capital or reduce new investment originations to meet these distribution requirements. See “Certain United States Federal Income Tax Considerations—Taxation as a Regulated Investment Company.”
There is a risk that you may not receive distributions or that our distributions may not grow over time.
We intend to make distributions on a quarterly basis to our stockholders. We cannot assure you that we will achieve investment results that will allow us to make a specified level of cash distributions or year-to-year increases in cash distributions. In addition, due to the asset coverage test applicable to us as a business development company, we may be limited in our ability to make distributions. Also, our credit facility limits our ability to declare dividends if we default under certain provisions.
If we are unable to manage our future growth effectively, we may be unable to achieve our investment objective, which could adversely affect our financial condition and results of operations and cause the value of your investment to decline.
Our ability to achieve our investment objective will depend on our ability to sustain growth. Sustaining growth will depend, in turn, on our senior management team’s ability to identify, evaluate, finance and invest in suitable companies that meet our investment criteria. Accomplishing this result on a cost-effective basis is largely a function of our marketing capabilities, our management of the investment process, our ability to provide efficient services and our access to financing sources on acceptable terms. Failure to manage our future growth effectively could have a material adverse effect on our business, financial condition and results of operations.
Our quarterly and annual operating results are subject to fluctuation as a result of the nature of our business, and if we fail to achieve our investment objective, the net asset value of our common stock may decline.
We could experience fluctuations in our quarterly and annual operating results due to a number of factors, some of which are beyond our control, including, but not limited to, the interest rate payable on the debt securities that we acquire, the default rate on such securities, the level of our expenses, variations in investment origination volume, variations in fee income earned, variations in and the timing of the recognition of realized and unrealized gains or losses, the degree to which we encounter competition in our markets and general economic conditions. As a result of these factors, results for any period should not be relied upon as being indicative of performance in future periods.
In addition, any of these factors could negatively impact our ability to achieve our investment objectives, which may cause our net asset value of our common stock to decline.
Fluctuations in interest rates may adversely affect our profitability.
A portion of our income will depend upon the difference between the rate at which we borrow funds and the interest rate on the debt securities in which we invest. Because we will borrow money to make investments, our net investment income is dependent upon the difference between the rate at which we borrow funds and the rate at which we invest these funds. Typically, we anticipate that our interest-earning investments will accrue and pay interest at fixed rates, and that our interest-bearing liabilities will accrue interest at variable rates. As a result, there can be no assurance that a significant change in market interest rates will not have a material adverse effect
17
on our net investment income. We anticipate using a combination of equity and long-term and short-term borrowings to finance our investment activities.
A significant increase in market interest rates could harm our ability to attract new portfolio companies and originate new loans and investments. We expect that most of our initial investments in debt securities will be at fixed rates. However, in the event that we make investments in debt securities at variable rates, a significant increase in market interest rates could also result in an increase in our non-performing assets and a decrease in the value of our portfolio because our floating-rate loan portfolio companies may be unable to meet higher payment obligations. In periods of rising interest rates, our cost of funds would increase, resulting in a decrease in our net investment income. In addition, a decrease in interest rates may reduce net income, because new investments may be made at lower rates despite the increased demand for our capital that the decrease in interest rates may produce. We may, but will not be required to, hedge against the risk of adverse movement in interest rates in our short-term and long-term borrowings relative to our portfolio of assets. If we engage in hedging activities, it may limit our ability to participate in the benefits of lower interest rates with respect to the hedged portfolio. Adverse developments resulting from changes in interest rates or hedging transactions could have a material adverse effect on our business, financial condition, and results of operations.
If we are unable to continue to borrow money in order to leverage our equity capital, then our ability to make new investments and to execute our business plan will be impaired.
As of March 31, 2007, we had outstanding borrowings of $113.0 million pursuant to the Citigroup Facility. We expect to incur additional indebtedness under our subsidiary’s small business investment company license from the Small Business Administration. There can be no assurance that we will be successful in obtaining any additional debt capital on terms acceptable to us or at all. If we are unable to obtain debt capital, then our equity investors will not benefit from the potential for increased returns on equity resulting from leverage to the extent that our investment strategy is successful.
In addition, the terms of available financing may place limits on our financial and operating flexibility. If we are unable to obtain sufficient capital in the future, we may:
| • | be forced to reduce our operations; |
| • | not be able to expand or acquire complementary businesses; and |
| • | not be able to develop new services or otherwise respond to changing business conditions or competitive pressures. |
It is likely that the terms of any long-term or revolving credit or warehouse facility we may enter into in the future could constrain our ability to grow our business.
As of March 31, 2007, the Company, through Hercules Funding Trust I, an affiliated statutory trust, has a $150 million securitized credit facility with Citigroup. We expect to enter into additional revolving credit or warehouse facilities in the future. While there can be no assurance that we will be able to borrow from banks or other financial institutions, we expect that we will, at some time in the future, obtain a long-term or revolving credit facility or a warehouse facility. The current lenders have, and any future lender or lenders will have fixed dollar claims on our assets that are senior to the claims of our stockholders and, thus, will have a preference over our stockholders with respect to our assets. In addition, we may grant a security interest in our assets in connection with any such borrowing. We expect such a facility to contain customary default provisions such as a minimum net worth amount, a profitability test, and a restriction on changing our business and loan quality standards. An event of default under any credit facility would likely result, among other things, in termination of the availability of further funds under that facility and an accelerated maturity date for all amounts outstanding under the facility, which would likely disrupt our business and, potentially, the business of the portfolio companies whose loans that we financed through the facility. This could reduce our revenues and, by delaying any cash payment allowed to us under our facility until the lender has been paid in full, reduce our liquidity and cash flow and impair our ability to grow our business and maintain our status as a RIC.
18
Our cost of borrowing is increased by the warrant participation agreement we have with one of our lenders. In addition, our realized gains are reduced by amounts paid pursuant to the warrant participation agreement.
Citigroup has an equity participation right through a warrant participation agreement on the pool of loans and warrants collateralized under the Citigroup facility. Pursuant to the warrant participation agreement, we granted to Citigroup a 10% participation in all warrants held as collateral. As a result, Citigroup is entitled to 10% of the realized gains on the warrants until the realized gains paid to Citigroup pursuant to the agreement equals $3,750,000 (the “Maximum Participation Limit”). The obligations under the warrant participation agreement continue even after the Citigroup facility is terminated until the Maximum Participation Limit has been reached.
During the quarter ended March 31, 2007, we reduced our realized gain by approximately $16,000 for Citigroup’s participation in the gain on sale of an equity security and we recorded an additional liability and reduced our unrealized gain by approximately $55,000 for Citigroup’s participation in unrealized gains in the warrant portfolio. Since inception of the agreement, we have paid Citigroup approximately $292,000 under the warrant participation agreement thereby reducing our realized gains. In addition, our realized gains will be reduced by the amounts owed to Citigroup under the warrant participation agreement. The value of Citigroup’s participation right on unrealized gains in the related equity investments since inception of the agreement was approximately $432,000 at March 31, 2007 and is included in accrued liabilities and reduces the unrealized gain recognized by us at March 31, 2007. Citigroup’s rights under the warrant participation agreement increase our cost of borrowing and reduce our realized gains.
If we are unable to satisfy Code requirements for qualification as a RIC, then we will be subject to corporate-level income tax, which would adversely affect our results of operations and financial condition.
We will elect to be treated as a RIC for federal income tax purposes with the filing of our federal corporate income tax return for 2006, which election will be effective as of January 1, 2006. We will not qualify for the tax treatment allowable to RICs if we are unable to comply with the source of income, diversification and distribution requirements contained in Subchapter M of the Code, or if we fail to maintain our election to be regulated as a business development company under the 1940 Act. If we fail to qualify for the federal income tax benefits allowable to RICs for any reason and remain or become subject to a corporate-level income tax, the resulting taxes could substantially reduce our net assets, the amount of income available for distribution to our stockholders and the actual amount of our distributions. Such a failure would have a material adverse effect on us, the net asset value of our common stock and the total return, if any, obtainable from your investment in our common stock. Any net operating losses that we incur in periods during which we qualify as a RIC will not offset net capital gains (i.e., net realized long-term capital gains in excess of net realized short-term capital losses) that we are otherwise required to distribute, and we cannot pass such net operating losses through to our stockholders. In addition, net operating losses that we carry over to a taxable year in which we qualify as a RIC normally cannot offset ordinary income or capital gains.
One of our wholly-owned subsidiaries is licensed by the U.S. Small Business Administration, and as a result, we will be subject to SBA regulations.
Our wholly-owned subsidiary HTII, is licensed to operate as a SBIC and is regulated by the U.S. Small Business Administration (“SBA”). The SBA regulations require that a licensed SBIC be periodically examined and audited by the SBA to determine its compliance with the relevant SBA regulations. If HTII fails to comply with applicable SBA regulations, the SBA could, depending on the severity of the violation, limit or prohibit the HTII’s use of debentures, declare outstanding debentures immediately due and payable, and/or limit the HTII from making new investments. The SBA also imposes a limit on the maximum amount that may be borrowed by any single SBIC. The SBA prohibits, without prior SBA approval, a “change of control” of a SBIC or transfers that would result in any person (or a group of persons acting in concert) owning 10% or more of a class of capital stock of a licensed SBIC. See “Regulation—Small Business Administration Regulations.”
19
The SBA also places certain limitations on the financing terms of investments by SBICs in portfolio companies and prohibits SBICs from providing funds for certain purposes or to businesses in a few prohibited industries. Compliance with SBA requirements may cause the SBIC to forego attractive investment opportunities that are not permitted under SBA regulations.
The SBA can revoke or suspend a license for willful or repeated violation of, or willful or repeated failure to observe, any provision of the Small Business Investment Act of 1958 or any rule or regulation promulgated thereunder.
Interpretations of the staff of the Securities and Exchange Commission regarding the appropriateness of the consolidation of certain of our subsidiaries may have an impact on our financial statements.
The staff of the Securities and Exchange Commission (the “Staff”) is reviewing the appropriateness of the consolidation of certain types of subsidiaries on an industry-wide basis under generally accepted accounting principles (“GAAP”) and Rule 6-03 of Regulation S-X. In connection with such review, the Staff is in the process of reviewing the appropriateness of our consolidation of certain of our subsidiaries (the “Subsidiaries”). In the event that the Staff disagrees with our position with respect to the appropriateness of consolidation of any of the Subsidiaries, then we will make such additional disclosures and prospective changes in accounting methods as the Staff requires on a prospective basis which will be discussed and reviewed with us.
Although we believe that our consolidation of the Subsidiaries conforms with GAAP, there can be no assurance that the Staff will ultimately concur with our position. Such events could have a material impact on our future reported results.
Changes in laws or regulations governing our business could negatively affect the profitability of our operations.
Changes in the laws or regulations, or the interpretations of the laws and regulations, which govern business development companies, small business investment companies, RICs or non-depository commercial lenders could significantly affect our operations and our cost of doing business. We are subject to federal, state and local laws and regulations and are subject to judicial and administrative decisions that affect our operations, including our loan originations, maximum interest rates, fees and other charges, disclosures to portfolio companies, the terms of secured transactions, collection and foreclosure procedures, and other trade practices. If these laws, regulations or decisions change, or if we expand our business into jurisdictions that have adopted more stringent requirements than those in which we currently conduct business, then we may have to incur significant expenses in order to comply or we may have to restrict our operations. In addition, if we do not comply with applicable laws, regulations and decisions, then we may lose licenses needed for the conduct of our business and be subject to civil fines and criminal penalties, any of which could have a material adverse effect upon our business results of operations or financial condition.
Risks Related to Our Investments
Our investments are concentrated in a limited number of technology-related companies, which subjects us to the risk of significant loss if any of these companies default on their obligations under any of their debt securities that we hold, or if any of the technology-related industry sectors experience a downturn.
We have invested and intend to continue investing in a limited number of technology-related companies. A consequence of this limited number of investments is that the aggregate returns we realize may be significantly adversely affected if a small number of investments perform poorly or if we need to write down the value of any one investment. Beyond the asset diversification requirements to which we will be subject as a RIC, we do not have fixed guidelines for diversification or limitations on the size of our investments in any one portfolio company and our investments could be concentrated in relatively few issuers. In addition, we have invested in and intend to continue investing, under normal circumstances, at least 80% of the value of our total assets (including the amount
20
of any borrowings for investment purposes) in technology-related and life-science companies. As a result, a downturn in technology-related and life-science industry sectors could materially adversely affect us.
Our investments may be concentrated in emerging-growth or expansion-stage portfolio companies, which may have limited operating histories and financial resources.
We expect that our portfolio will continue to consist primarily of investments in emerging-growth and expansion-stage privately-owned businesses, which may have relatively limited operating histories. Compared to larger established or publicly-owned firms, these companies may be particularly vulnerable to economic downturns, may have more limited access to capital and higher funding costs, may have a weaker financial position and may need more capital to expand or compete. These businesses also may experience substantial variations in operating results. They may face intense competition, including from companies with greater financial, technical and marketing resources. Furthermore, some of these companies do business in regulated industries and could be affected by changes in government regulation. Accordingly, these factors could impair their cash flow or result in other events, such as bankruptcy, which could limit their ability to repay their obligations to us, and may adversely affect the return on, or the recovery of, our investment in these companies. We cannot assure you that any of our investments in our portfolio companies will be successful. Our portfolio companies compete with larger, established companies with greater access to, and resources for, further development in these new technologies. We may lose our entire investment in any or all of our portfolio companies.
Our investment strategy focuses on technology-related and life-science companies, which are subject to many risks, including volatility, intense competition, shortened product life cycles and periodic downturns, and you could lose all or part of your investment.
We have invested and will continue investing primarily in technology-related and life-science companies, many of which may have narrow product lines and small market shares, which tend to render them more vulnerable to competitors’ actions and market conditions, as well as to general economic downturns. The revenues, income (or losses), and valuations of technology-related and life-science companies can and often do fluctuate suddenly and dramatically. In addition, technology-related markets are generally characterized by abrupt business cycles and intense competition. Beginning in mid-2000, there was substantial excess production capacity and a significant slowdown in many technology-related industries. This overcapacity, together with a cyclical economic downturn, resulted in substantial decreases in the market capitalization of many technology-related and life-science companies. While such valuations have recovered to some extent, such decreases in market capitalization may occur again, and any future decreases in technology-related and life-science company valuations may be substantial and may not be temporary in nature. Therefore, our portfolio companies may face considerably more risk of loss than do companies in other industry sectors.
Because of rapid technological change, the average selling prices of products and some services provided by technology-related and life-science companies have historically decreased over their productive lives. As a result, the average selling prices of products and services offered by technology-related and life-science companies may decrease over time, which could adversely affect their operating results, their ability to meet obligations under their debt securities and the value of their equity securities. This could, in turn, materially adversely affect our business, financial condition and results of operations.
We have invested in and may continue investing in technology-related and life-science companies that do not have venture capital or private equity firms as equity investors, and these companies may entail a higher risk of loss than do companies with institutional equity investors, which could increase the risk of loss of your investment.
Our portfolio companies will often require substantial additional equity financing to satisfy their continuing working capital and other cash requirements and, in most instances, to service the interest and principal payments on our investment. Portfolio companies that do not have venture capital or private equity investors may be unable to raise any additional capital to satisfy their obligations or to raise sufficient additional capital to reach the next
21
stage of development. Portfolio companies that do not have venture capital or private equity investors may be less financially sophisticated and may not have access to independent members to serve on their boards, which means that they may be less successful than portfolio companies sponsored by venture capital or private equity firms. Accordingly, financing these types of companies may entail a higher risk of loss than would financing companies that are sponsored by venture capital or private equity firms.
Economic recessions or downturns could impair the ability of our portfolio companies to repay loans, which, in turn, could increase our non-performing assets, decrease the value of our portfolio, reduce our volume of new loans and harm our operating results, which might have an adverse effect on our results of operations.
Many of our portfolio companies may be susceptible to economic slowdowns or recessions and may be unable to repay our loans during such periods. Therefore, our non-performing assets are likely to increase and the value of our portfolio is likely to decrease during such periods. Adverse economic conditions also may decrease the value of collateral securing some of our loans and the value of our equity investments. Economic slowdowns or recessions could lead to financial losses in our portfolio and a decrease in revenues, net income and assets. Unfavorable economic conditions also could increase our funding costs, limit our access to the capital markets or result in a decision by lenders not to extend credit to us.
A portfolio company’s failure to satisfy financial or operating covenants imposed by us or other lenders could lead to defaults and, potentially, termination of the portfolio company’s loans and foreclosure on its secured assets, which could trigger cross-defaults under other agreements and jeopardize the portfolio company’s ability to meet its obligations under the debt securities that we hold. We may incur expenses to the extent necessary to seek recovery upon default or to negotiate new terms with a defaulting portfolio company. In addition, if a portfolio company goes bankrupt, even though we may have structured our investment as senior debt or secured debt, depending on the facts and circumstances, including the extent to which we actually provided significant “managerial assistance,” if any, to that portfolio company, a bankruptcy court might re-characterize our debt holding and subordinate all or a portion of our claim to that of other creditors. These events could harm our financial condition and operating results.
We do not control our portfolio companies. These portfolio companies may face intense competition, including competition from companies with greater financial resources, more extensive research and development, manufacturing, marketing and service capabilities and greater number of qualified and experienced managerial and technical personnel. They may need additional financing which they are unable to secure and which we are unable or unwilling to provide, or they may be subject to adverse developments unrelated to the technologies they acquire.
The inability of our portfolio companies to commercialize their technologies or create or develop commercially viable products or businesses would have a negative impact on our investment returns.
The possibility that our portfolio companies will not be able to commercialize their technology, products or business concepts presents significant risks to the value of our investment. Additionally, although some of our portfolio companies may already have a commercially successful product or product line when we invest, technology-related and life-science products and services often have a more limited market- or life-span than have products in other industries. Thus, the ultimate success of these companies often depends on their ability to continually innovate, or raise additional capital, in increasingly competitive markets. Their inability to do so could affect our investment return. In addition, the intellectual property held by our portfolio companies often represents a substantial portion of the collateral, if any, securing our investments. We cannot assure you that any of our portfolio companies will successfully acquire or develop any new technologies, or that the intellectual property the companies currently hold will remain viable. Even if our portfolio companies are able to develop commercially viable products, the market for new products and services is highly competitive and rapidly changing. Neither our portfolio companies nor we have any control over the pace of technology development. Commercial success is difficult to predict, and the marketing efforts of our portfolio companies may not be successful.
22
An investment strategy focused primarily on privately-held companies presents certain challenges, including the lack of available information about these companies, a dependence on the talents and efforts of only a few key portfolio company personnel and a greater vulnerability to economic downturns.
We invest primarily in privately-held companies. Generally, very little public information exists about these companies, and we are required to rely on the ability of our management team to obtain adequate information to evaluate the potential returns from investing in these companies. If we are unable to uncover all material information about these companies, then we may not make a fully informed investment decision, and we may not receive the expected return on our investment or lose some or all of the money invested in these companies. Also, privately-held companies frequently have less diverse product lines and a smaller market presence than do larger competitors. Privately-held companies are, thus, generally more vulnerable to economic downturns and may experience more substantial variations in operating results than do larger competitors. These factors could affect our investment returns.
In addition, our success depends, in large part, upon the abilities of the key management personnel of our portfolio companies, who are responsible for the day-to-day operations of our portfolio companies. Competition for qualified personnel is intense at any stage of a company’s development, and high turnover of personnel is common in technology-related companies. The loss of one or more key managers can hinder or delay a company’s implementation of its business plan and harm its financial condition. Our portfolio companies may not be able to attract and retain qualified managers and personnel. Any inability to do so may negatively impact our investment returns.
If our portfolio companies are unable to protect their intellectual property rights, then our business and prospects could be harmed. If our portfolio companies are required to devote significant resources to protecting their intellectual property rights, then the value of our investment could be reduced.
Our future success and competitive position depend in part upon the ability of our portfolio companies to obtain and maintain proprietary technology used in their products and services, which will often represent a significant portion of the collateral, if any, securing our investment. The portfolio companies will rely, in part, on patent, trade secret and trademark law to protect that technology, but competitors may misappropriate their intellectual property, and disputes as to ownership of intellectual property may arise. Portfolio companies may, from time to time, be required to institute litigation in order to enforce their patents, copyrights or other intellectual property rights, to protect their trade secrets, to determine the validity and scope of the proprietary rights of others or to defend against claims of infringement. Such litigation could result in substantial costs and diversion of resources. Similarly, if a portfolio company is found to infringe upon or misappropriate a third party’s patent or other proprietary rights, that portfolio company could be required to pay damages to such third party, alter its own products or processes, obtain a license from the third party and/or cease activities utilizing such proprietary rights, including making or selling products utilizing such proprietary rights. Any of the foregoing events could negatively affect both the portfolio company’s ability to service our debt investment and the value of any related debt and equity securities that we own, as well as any collateral securing our investment.
We may not be able to realize our entire investment on equipment-based loans in the case of default.
We have provided and expect to continue to provide loans that will be collateralized only by equipment of the portfolio company. If the portfolio company defaults on the loan our sole recourse would be to take possession of the underlying equipment to satisfy the outstanding debt. The residual value of the equipment at the time we would take possession may not be sufficient to satisfy the outstanding debt and we could experience a loss on the disposition of the equipment.
Our investments in foreign securities may involve significant risks in addition to the risks inherent in U.S. investments.
Our investment strategy contemplates that a portion of our investments may be in securities of foreign companies. Investing in foreign companies may expose us to additional risks not typically associated with
23
investing in U.S. companies. These risks include changes in exchange control regulations, political and social instability, expropriation, imposition of foreign taxes, less liquid markets and less available information than is generally the case in the U.S., higher transaction costs, less government supervision of exchanges, brokers and issuers, less developed bankruptcy laws, difficulty in enforcing contractual obligations, lack of uniform accounting and auditing standards and greater price volatility.
Some of our portfolio companies may need additional capital, which may not be readily available.
Our portfolio companies will often require substantial additional equity financing to satisfy their continuing working capital and other requirements, and in most instances to service the interest and principal payments on our investment. Each round of venture financing is typically intended to provide a company with only enough capital to reach the next stage of development. We cannot predict the circumstances or market conditions under which our portfolio companies will seek additional capital. It is possible that one or more of our portfolio companies will not be able to raise additional financing or may be able to do so only at a price or on terms unfavorable to us, either of which would negatively impact our investment returns. Some of these companies may be unable to obtain sufficient financing from private investors, public capital markets or traditional lenders. Accordingly, financing these types of companies may entail a higher risk of loss than would financing companies that are able to utilize traditional credit sources.
We may be unable or decide not to make additional cash investments in our portfolio companies which could result in our losing our initial investment if the portfolio company fails.
We may have to make additional cash investments in our portfolio companies to protect our overall investment value in the particular company. We retain the discretion to make any additional investments as our management determines. The failure to make such additional investments may jeopardize the continued viability of a portfolio company, and our initial (and subsequent) investments. Moreover, additional investments may limit the number of companies in which we can make initial investments. In determining whether to make an additional investment our management will exercise its business judgment and apply criteria similar to those used when making the initial investment. We cannot assure you that we will have sufficient funds to make any necessary additional investments, which could adversely affect our success and result in the loss of a substantial portion or all of our investment in a portfolio company.
If our investments do not meet our performance expectations, you may not receive distributions.
We intend to make distributions on a quarterly basis to our stockholders. We may not be able to achieve operating results that will allow us to make distributions at a specific level or to increase the amount of these distributions from time to time. In addition, due to the asset coverage test applicable to us as a business development company, we may be limited in our ability to make distributions. See “Regulation.” Also, restrictions and provisions in any future credit facilities may limit our ability to make distributions. As a RIC, if we do not distribute a certain percentage of our income annually, we will suffer adverse tax consequences, including failure to obtain, or possible loss of, the federal income tax benefits allowable to RICs. See “Certain United States Federal Income Tax Considerations—Taxation as a Regulated Investment Company.” We cannot assure you that you will receive distributions at a particular level or at all.
Any unrealized depreciation that we experience on our loan portfolio may be an indication of future realized losses, which could reduce our income available for distribution.
As a business development company, we are required to carry our investments at market value or, if no market value is ascertainable, at the fair value as determined in good faith by our Board of Directors in accordance with procedures approved by our Board of Directors. Decreases in the market values or fair values of our investments will be recorded as unrealized depreciation. Any unrealized depreciation in our loan portfolio could be an indication of a portfolio company’s inability to meet its repayment obligations to us with respect to the affected loans. This could result in realized losses in the future and ultimately in reductions of our income available for distribution in future periods.
24
The lack of liquidity in our investments may adversely affect our business and, if we need to sell any of our investments, we may not be able to do so at a favorable price. As a result, we may suffer losses.
We generally invest in debt securities with terms of up to seven years and hold such investments until maturity, and we do not expect that our related holdings of equity securities will provide us with liquidity opportunities in the near-term. We invest and expect to continue investing in companies whose securities have no established trading market and whose securities are and will be subject to legal and other restrictions on resale or whose securities are and will be less liquid than are publicly-traded securities. The illiquidity of these investments may make it difficult for us to sell these investments when desired. In addition, if we are required to liquidate all or a portion of our portfolio quickly, we may realize significantly less than the value at which we had previously recorded these investments. As a result, we do not expect to achieve liquidity in our investments in the near-term. However, to maintain our qualification as a business development company and as a RIC, we may have to dispose of investments if we do not satisfy one or more of the applicable criteria under the respective regulatory frameworks. Our investments are usually subject to contractual or legal restrictions on resale, or are otherwise illiquid, because there is usually no established trading market for such investments. The illiquidity of most of our investments may make it difficult for us to dispose of the investments at a favorable price and, as a result, we may suffer losses.
If the assets securing the loans that we make decrease in value, then we may lack sufficient collateral to cover losses.
We believe that our portfolio companies generally will be able to repay our loans from their available capital, from future capital-raising transactions, or from cash flow from operations. However, to attempt to mitigate credit risks, we will typically take a security interest in the available assets of these portfolio companies, including the equity interests of their subsidiaries and, in some cases, the equity interests of our portfolio companies held by their stockholders. In many cases, our loans will include a period of interest-only payments. There is a risk that the collateral securing our loans may decrease in value over time, may be difficult to sell in a timely manner, may be difficult to appraise and may fluctuate in value based upon the success of the business and market conditions, including as a result of the inability of a portfolio company to raise additional capital. In some circumstances, our lien could be subordinated to claims of other creditors. Additionally, a deterioration in a portfolio company’s financial condition and prospects, including its inability to raise additional capital, may be accompanied by a deterioration in the value of the collateral for the loan. Moreover, in the case of some of our structured mezzanine debt, we may not have a first lien position on the collateral. Consequently, the fact that a loan is secured does not guarantee that we will receive principal and interest payments according to the loan’s terms, or that we will be able to collect on the loan should we be forced to enforce our remedies. In addition, because we invest in technology-related companies, a substantial portion of the assets securing our investment may be in the form of intellectual property, if any, inventory and equipment and, to a lesser extent, cash and accounts receivable. Intellectual property, if any, that is securing our loan could lose value if, among other things, the company’s rights to the intellectual property are challenged or if the company’s license to the intellectual property is revoked or expires. Inventory may not be adequate to secure our loan if our valuation of the inventory at the time that we made the loan was not accurate or if there is a reduction in the demand for the inventory. Similarly, any equipment securing our loan may not provide us with the anticipated security if there are changes in technology or advances in new equipment that render the particular equipment obsolete or of limited value, or if the company fails to adequately maintain or repair the equipment. Any one or more of the preceding factors could materially impair our ability to recover principal in a foreclosure.
Our portfolio companies may incur debt that ranks equally with, or senior to, our investments in such companies.
We invest primarily in debt securities issued by our portfolio companies. In some cases, portfolio companies will be permitted to have other debt that ranks equally with, or senior to, the debt securities in which we invest. Such debt instruments may provide that the holders thereof are entitled to receive payment of interest or principal on or before the dates on which we are entitled to receive payments in respect of the debt securities in which we
25
invest. Also, in the event of insolvency, liquidation, dissolution, reorganization or bankruptcy of a portfolio company, holders of debt instruments ranking senior to our investment in that portfolio company would typically be entitled to receive payment in full before we receive any distribution in respect of our investment. After repaying such senior creditors, such portfolio company might not have any remaining assets to use for repaying its obligation to us. In the case of debt ranking equally with debt securities in which we invest, we would have to share on a pari passu basis any distributions with other creditors holding such debt in the event of an insolvency, liquidation, dissolution, reorganization or bankruptcy. In addition, we would not be in a position to control any portfolio company by investing in its debt securities. As a result, we are subject to the risk that a portfolio company in which we invest may make business decisions with which we disagree and the management of such companies, as representatives of the holders of their common equity, may take risks or otherwise act in ways that do not best serve our interests as debt investors.
Our equity investments are highly speculative, and we may not realize gains from these investments. If our equity investments do not generate gains, then the return on our invested capital will be lower than it would otherwise be, which could result in a decline in the value of shares of our common stock.
When we invest in debt securities, we generally expect to acquire warrants or other equity securities as well. Our goal is ultimately to dispose of these equity interests and realize gains upon disposition of such interests. We cannot predict or control the timing of liquidity events of our portfolio companies. Over time, the gains that we realize on these equity interests may offset, to some extent, losses that we experience on defaults under debt securities that we hold. However, the equity interests that we receive may not appreciate in value and, in fact, may decline in value. Accordingly, we may not be able to realize gains from our equity interests, and any gains that we do realize on the disposition of any equity interests may not be sufficient to offset any other losses that we experience.
We do not control any of our portfolio companies and therefore our portfolio companies may make decisions with which we disagree.
We do not control any of our portfolio companies, even though we may have board observation rights and our debt agreements may contain certain restrictive covenants. As a result, we are subject to the risk that a portfolio company in which we invest may make business decisions with which we disagree and the management of such company, as representatives of the holders of their common equity, may take risks or otherwise act in ways that do not serve our interests as debt investors.
Prepayments of our debt investments by our portfolio companies could adversely impact our results of operations and reduce our return on equity.
We are subject to the risk that the investments we make in our portfolio companies may be repaid prior to maturity. When this occurs, we will generally reinvest these proceeds in temporary investments, pending their future investment in new portfolio companies. These temporary investments will typically have substantially lower yields than the debt being prepaid and we could experience significant delays in reinvesting these amounts. Any future investment in a new portfolio company may also be at lower yields than the debt that was repaid. As a result, our results of operations could be materially adversely affected if one or more of our portfolio companies elects to prepay amounts owed to us. Additionally, prepayments could negatively impact our return on equity, which could result in a decline in the market price of our common stock.
Risks Related to an Offering of Our Shares
Our common stock price may be volatile and may decrease substantially.
The trading price of our common stock following an offering may fluctuate substantially. The price of the common stock that will prevail in the market after an offering may be higher or lower than the price you paid and
26
the liquidity of our common stock may be limited, in each case depending on many factors, some of which are beyond our control and may not be directly related to our operating performance. These factors include, but are not limited to, the following:
| • | price and volume fluctuations in the overall stock market from time to time; |
| • | significant volatility in the market price and trading volume of securities of RICs, business development companies or other financial services companies; |
| • | any inability to deploy or invest our capital; |
| • | fluctuations in interest rates; |
| • | any shortfall in revenue or net income or any increase in losses from levels expected by investors or securities analysts; |
| • | operating performance of companies comparable to us; |
| • | changes in regulatory policies or tax guidelines with respect to RICs or business development companies; |
| • | losing RIC status; |
| • | actual or anticipated changes in our earnings or fluctuations in our operating results, or changes in the expectations of securities analysts; |
| • | changes in the value of our portfolio of investments; |
| • | realized losses in investments in our portfolio companies; |
| • | general economic conditions and trends; |
| • | loss of a major funding source; or |
| • | departures of key personnel. |
In the past, following periods of volatility in the market price of a company’s securities, securities class action litigation has often been brought against that company. Due to the potential volatility of our stock price, we may be the target of securities litigation in the future. Securities litigation could result in substantial costs and could divert management’s attention and resources from our business.
We may be unable to invest the net proceeds raised from an offering on acceptable terms, which would harm our financial condition and operating results.
Until we identify investments for our portfolio, we intend to invest the net proceeds from an offering in cash, cash equivalents, U.S. government securities or high-quality debt securities. We cannot assure you that we will be able to complete investments that meet our investment criteria or that any investment we complete using the proceeds from an offering will produce a sufficient return. Moreover, because we may not have identified all investments at the time of an offering, we will have broad authority to invest the net proceeds of an offering. We will not receive any proceeds from an offering by the selling holders.
Investing in shares of our common stock may involve an above average degree of risk.
The investments we make in accordance with our investment objective may result in a higher amount of risk, volatility or loss of principal than alternative investment options. Our investments in portfolio companies may be highly speculative and aggressive, and therefore, an investment in our common stock may not be suitable for investors with lower risk tolerance.
27
We cannot assure you that the market price of our common stock will not decline.
We cannot predict the price at which our common stock will trade. Shares of closed-end investment companies have in the past frequently traded at discounts to their net asset values and our stock may also be discounted in the market. This characteristic of closed-end investment companies is separate and distinct from the risk that our net asset value per share may decline. We cannot predict whether shares of our common stock will trade above, at or below our net asset value. The risk of loss associated with this characteristic of closed-end investment companies may be greater for investors expecting to sell shares of common stock purchased in this offering soon after the offering. In addition, if our common stock trades below its net asset value, we will generally not be able to issue additional shares of our common stock at its market price without first obtaining the approval for such issuance from our stockholders and our independent directors.
Provisions of the Maryland General Corporation Law, and of our charter and bylaws, could deter takeover attempts and have an adverse impact on the price of our common stock.
The Maryland General Corporation Law and our charter and bylaws contain provisions that may have the effect of discouraging, delaying, or making difficult a change in control of our company or the removal of our incumbent directors. We will be covered by the Business Combination Act of the Maryland General Corporation Law to the extent that such statute is not superseded by applicable requirements of the 1940 Act. However, our Board of Directors has adopted a resolution exempting from the Business Combination Act any business combination between us and any person to the extent that such business combination receives the prior approval of our board, including a majority of our directors who are not interested persons as defined in the 1940 Act. Our Board of Directors has already adopted a resolution exempting from the Business Combination Act any business combination between us and certain investment funds managed by JMP Asset Management, LLC and certain investment funds managed by Farallon Capital Management, L.L.C., and we have agreed with such investment funds that we will not alter or repeal such board resolution prior to the date that is two years after such investment funds cease to own at least 10% of our outstanding common stock in a manner that would make the Business Combination Act applicable to acquisitions of our stock by such investment funds without the written consent of such investment funds. In addition, our bylaws contain a provision exempting from the Control Share Acquisition Act any and all acquisitions by any person of shares of our stock. We have agreed with certain investment funds managed by JMP Asset Management, LLC and certain investment funds managed by Farallon Capital Management, L.L.C. that we will not repeal or amend such provision of our bylaws in a manner that would make the Control Share Acquisition Act applicable to acquisitions of our stock by such investment funds without the written consent of such investment funds prior to the date that is two years after such investment funds cease to own at least 10% of our outstanding common stock. If the applicable board resolution is repealed following such period of time or if our board does not otherwise approve a business combination, the Business Combination Act and the Control Share Acquisition Act (if we amend our bylaws to be subject to that Act) may discourage others from trying to acquire control of us and increase the difficulty of consummating any offer.
Under our charter, our Board of Directors is divided into three classes serving staggered terms, which will make it more difficult for a hostile bidder to acquire control of us. In addition, our Board of Directors may, without stockholder action, authorize the issuance of shares of stock in one or more classes or series, including preferred stock. See “Description of Capital Stock.” Subject to compliance with the 1940 Act, our Board of Directors may, without stockholder action, amend our charter to increase the number of shares of stock of any class or series that we have authority to issue. The existence of these provisions, among others, may have a negative impact on the price of our common stock and may discourage third party bids for ownership of our company. These provisions may prevent any premiums being offered to you for shares of our common stock.
28
FORWARD-LOOKING STATEMENTS; MARKET DATA
The matters discussed in this prospectus, as well as in future oral and written statements by management of Hercules Technology Growth Capital, that are forward-looking statements are based on current management expectations that involve substantial risks and uncertainties which could cause actual results to differ materially from the results expressed in, or implied by, these forward-looking statements. Forward-looking statements relate to future events or our future financial performance. We generally identify forward-looking statements by terminology such as “may,” “will,” “should,” “expects,” “plans,” “anticipates,” “could,” “intends,” “target,” “projects,” “contemplates,” “believes,” “estimates,” “predicts,” “potential” or “continue” or the negative of these terms or other similar words. Important assumptions include our ability to originate new investments, achieve certain margins and levels of profitability, the availability of additional capital, and the ability to maintain certain debt to asset ratios. In light of these and other uncertainties, the inclusion of a projection or forward-looking statement in this prospectus should not be regarded as a representation by us that our plans or objectives will be achieved. The forward-looking statements contained in this prospectus include statements as to:
| • | our future operating results; |
| • | our business prospects and the prospects of our prospective portfolio companies; |
| • | the impact of investments that we expect to make; |
| • | our informal relationships with third parties; |
| • | the dependence of our future success on the general economy and its impact on the industries in which we invest; |
| • | the ability of our portfolio companies to achieve their objectives; |
| • | our expected financings and investments; |
| • | our regulatory structure and tax status; |
| • | our ability to operate as a business development company and a regulated investment company; |
| • | the adequacy of our cash resources and working capital; and |
| • | the timing of cash flows, if any, from the operations of our portfolio companies. |
For a discussion of factors that could cause our actual results to differ from forward-looking statements contained in this prospectus, please see the discussion under “Risk Factors.” You should not place undue reliance on these forward-looking statements. The forward-looking statements made in this prospectus relate only to events as of the date on which the statements are made. We undertake no obligation to update any forward-looking statement to reflect events or circumstances occurring after the date of this prospectus.
This prospectus contains third-party estimates and data regarding valuations of venture capital-backed companies. These data were reported by Dow Jones, VentureOne, an independent venture capital industry research company which we refer to as VentureOne. VentureOne is commonly relied upon as an information source in the venture capital industry. Although we have not independently verified any such data, we believe that the industry information contained in such releases and data tables and included in this prospectus is reliable.
We have compiled certain industry estimates presented in this prospectus from internally generated information and data. While we believe our estimates are reliable, they have not been verified by any independent sources. The estimates are based on a number of assumptions, including increasing investment in venture capital and private equity-backed companies. Actual results may differ from projections and estimates, and this market may not grow at the rates projected, or at all. If this market fails to grow at projected rates, our business and the market price of our common stock could be materially adversely affected.
29
We intend to use the net proceeds from selling shares of common stock for general corporate purposes, which include investing in debt and equity securities, repayment of indebtedness and other general corporate purposes. The supplement to this prospectus relating to an offering will more fully identify the use of proceeds from such offering. We will not receive any proceeds from the sale of the common stock by the selling holders.
We anticipate that substantially all of the net proceeds from any offering of our shares of common stock will be used as described above within twelve months, but in no event longer than two years. Pending such uses and investments, we will invest the net proceeds primarily in cash, cash equivalents, U.S. government securities or high-quality debt securities maturing in one year or less from the time of investment.
30
PRICE RANGE OF COMMON STOCK AND DISTRIBUTIONS
Our common stock is traded on the Nasdaq Global Market under the symbol “HTGC.” We completed the initial public offer of our common stock in June 2005 at a price of $13.00 per share. Prior to such date, there was no public market for our common stock.
The following table sets forth the range of high and low sales prices of our common stock as reported on the Nasdaq Global Market and the dividends declared by us for each fiscal quarter since our initial public offer. The stock quotations are interdealer quotations and do not include markups, markdowns or commissions.
| Price Range | Premium/ Price to NAV |
Premium/ Price to NAV |
Cash per Share(2) | |||||||||||||||
| NAV(1) | High | Low | ||||||||||||||||
| 2005 |
||||||||||||||||||
| Second quarter (June 9, 2005 through June 30, 2005) |
$ | 11.55 | $ | 13.19 | $ | 12.45 | 114.2 | % | 107.8 | % | — | |||||||
| Third quarter |
$ | 11.71 | $ | 14.41 | $ | 11.90 | 123.1 | % | 101.6 | % | $ | 0.025 | ||||||
| Fourth quarter |
$ | 11.67 | $ | 12.68 | $ | 9.71 | 108.7 | % | 83.2 | % | $ | 0.300 | ||||||
| 2006 |
||||||||||||||||||
| First quarter |
$ | 11.63 | $ | 11.99 | $ | 10.50 | 103.1 | % | 90.3 | % | $ | 0.300 | ||||||
| Second quarter |
$ | 11.24 | $ | 12.53 | $ | 10.88 | 111.5 | % | 96.8 | % | $ | 0.300 | ||||||
| Third quarter |
11.06 | $ | 12.90 | $ | 11.11 | 116.6 | % | 100.5 | % | $ | 0.300 | |||||||
| Fourth quarter |
11.65 | $ | 14.25 | $ | 12.50 | 122.3 | % | 107.3 | % | $ | 0.300 | |||||||
| 2007 |
||||||||||||||||||
| First quarter |
11.68 | 14.50 | 12.77 | 124.1 | % | 109.3 | % | $ | 0.300 | |||||||||
| Second quarter (through May 8, 2007) |
* | $ | 14.71 | $ | 13.50 | * | * | — | ||||||||||
| (1) | Net asset value per share is generally determined as of the last day in the relevant quarter and therefore may not reflect the net asset value per share on the date of the high and low sales prices. The net asset values shown are based on outstanding shares at the end of each period. |
| (2) | Represents the dividend declared in the specified quarter. As of the date of this prospectus, no dividend has been declared for the second quarter of 2007. |
| * | Net asset value has not yet been calculated for this period. |
The last reported price for our common stock on May 8, 2007 was $14.44 per share.
Shares of business development companies may trade at a market price that is less than the value of the net assets attributable to those shares. The possibility that our shares of common stock will trade at a discount from net asset value or at premiums that are unsustainable over the long term are separate and distinct from the risk that our net asset value will decrease. At times, our shares of common stock have traded at a premium to net asset value and at times our shares of common stock have traded at a discount to the net assets attributable to those shares. It is not possible to predict whether the shares offered hereby will trade at, above, or below net asset value.
Dividends
The following table summarizes our dividends declared and paid on all shares, including restricted stock, to date:
| Date Declared |
Record Date |
Payment Date |
Amount Per Share | ||||
| October 27, 2005 |
November 1, 2005 | November 17, 2005 | $ | 0.025 | |||
| December 9, 2005 |
January 6, 2006 | January 27, 2006 | 0.300 | ||||
| April 3, 2006 |
April 10, 2006 | May 5, 2006 | 0.300 | ||||
| July 19, 2006 |
July 31, 2006 | August 28, 2006 | 0.300 | ||||
| October 16, 2006 |
November 6, 2006 | December 1, 2006 | 0.300 | ||||
| February 7, 2007 |
February 19, 2007 | March 19, 2007 | 0.300 | ||||
| $ | 1.525 | ||||||
31
On May 1, 2007, the Board of Directors declared a dividend of $0.30 per share, payable on June 18, 2007 to shareholders of record as of May 16, 2007. Distributions in excess of our current and accumulated earnings and profits would be treated first as a return of capital to the extent of the stockholder’s tax basis, and any remaining distributions would be treated as a capital gain. The determination of the tax attributes of our distributions is made annually as of the end of our fiscal year based upon its taxable income for the full year and distributions paid for the full year, therefore a determination made on a quarterly basis may not be representative of the actual tax attributes of our distributions for a full year. If we determined the tax attributes of our distributions year-to-date as of March 31, 2007, 80.1% would be from ordinary income and 19.9% would be a return of capital for stockholders, however there can be no certainty to stockholders that this determination is representative of what the tax attributes of its 2007 distributions to stockholders will actually be.
We intend to distribute quarterly dividends to our stockholders. In order to avoid certain excise taxes imposed on RICs, we currently intend to distribute during each calendar year an amount at least equal to the sum of (1) 98% of our ordinary income for the calendar year, (2) 98% of our capital gains in excess of capital losses for the one year period ending on October 31 of the calendar year, and (3) any ordinary income and net capital gains for the preceding year that were not distributed during such year. We will not be subject to excise taxes on amounts on which we are required to pay corporate income tax (such as retained net capital gains). In order to obtain the tax benefits applicable to RICs, we will be required to distribute to our stockholders with respect to each taxable year at least 90% of our ordinary income and realized net short-term capital gains in excess of realized net long-term capital losses.
We currently intend to retain for investment some or all of our net capital gains (that is, the excess of our realized net long-term capital gains over our realized net short-term capital losses) and to make deemed distributions to our stockholders of any retained net capital gains. If this happens, you will be treated as if you received an actual distribution of the capital gains we retain and then reinvested the net after-tax proceeds in our common stock. You also may be eligible to claim a tax credit (or, in certain circumstances, a tax refund) equal to your allocable share of the tax we paid on the capital gains deemed distributed to you. Please refer to “Certain United States Federal Income Tax Considerations” for further information regarding the consequences of our retention of net capital gains. To the extent that we do not retain all of our net capital gains, we will make actual distributions to our stockholders of such gains.
We can offer no assurance that we will achieve results that will permit the payment of any cash distributions and, if we issue senior securities, we will be prohibited from making distributions if doing so causes us to fail to maintain the asset coverage ratios stipulated by the 1940 Act or if distributions are limited by the terms of any of our borrowings. See “Regulation.”
We maintain an “opt-out” dividend reinvestment plan for our common stockholders. As a result, if we declare a dividend, cash dividends will be automatically reinvested in additional shares of our common stock unless the stockholder specifically “opts out” of the dividend reinvestment plan and chooses to receive cash dividends. See “Dividend Reinvestment Plan.”
Our ability to make distributions will be limited by the asset coverage requirements under the 1940 Act. For a more detailed discussion, see “Regulation.”
32
MANAGEMENT’S DISCUSSION AND ANALYSIS OF FINANCIAL CONDITION AND RESULTS OF OPERATIONS
The following discussion should be read in conjunction with our consolidated financial statements and related notes and other financial information appearing elsewhere in this report. In addition to historical information, the following discussion and other parts of this report contain forward-looking information that involves risks and uncertainties. Our actual results could differ materially from those anticipated by such forward-looking information due to the factors discussed under “Risk Factors,” “Forward-Looking Statements; Market Data” appearing elsewhere herein.
Overview
We are a specialty finance company that provides debt and equity growth capital to technology-related companies at all stages of development. We primarily finance privately-held companies backed by leading venture capital and private equity firms and also may finance certain publicly-traded companies. Our principal office is located in the Silicon Valley and we have additional offices in the Boston, Boulder, Chicago and Columbus areas. Our goal is to be the leading structured mezzanine capital provider of choice for venture capital and private equity backed technology-related companies requiring sophisticated and customized financing solutions. We invest primarily in structured mezzanine debt and, to a lesser extent, in senior debt and equity investments. We use the term “structured mezzanine debt investment” to refer to any debt investment, such as a senior or subordinated secured loan, that is coupled with an equity component, including warrants, options or rights to purchase common or preferred stock. Our structured mezzanine debt investments will typically be secured by some or all of the assets of the portfolio company.
We are an internally managed, non-diversified closed-end investment company that has elected to be regulated as a business development company under the 1940 Act. As a business development company, we are required to comply with certain regulatory requirements. For instance, we generally have to invest at least 70% of our total assets in “qualifying assets,” including securities of private U.S. companies, cash, cash equivalents, U.S. government securities and high-quality debt investments that mature in one year or less.
From incorporation through December 31, 2005, we were taxed as a corporation under Subchapter C of the Code. We will elect to be treated for federal income tax purposes as a RIC under Subchapter M of the Code as of January 1, 2006. To qualify for the benefits allowable to a RIC, we must, among other things, meet certain source-of-income and asset diversification and income distribution requirements. If we qualify for RIC tax benefits, we generally will not have to pay corporate-level taxes on any income that we distribute to our stockholders. However, qualification to be treated as a RIC requires that we comply with certain requirements contained in Subchapter M of the Code. For example, a RIC must meet certain requirements, including source-of-income, asset diversification and income distribution requirements, in order to obtain RIC tax treatment. The income source requirement mandates that we receive 90% or more of our income from qualified earnings, typically referred to as “good income.” Qualified earnings may exclude such income as management fees received in connection with our SBIC or other potential outside managed funds and certain other fees.
Our portfolio is comprised of, and we anticipate that our portfolio will continue to be comprised of, investments in technology-related companies at various stages of their development. Consistent with regulatory requirements, we invest primarily in United States based companies and to a lesser extent in foreign companies. To date, our emphasis has been primarily on private companies following or in connection with their first institutional round of equity financing, which we refer to as emerging-growth companies, and private companies in later rounds of financing, which we refer to as expansion-stage companies. In 2007, we expect to increase our investment activity in established companies, comprised of private companies in one of their final rounds of equity financing prior to a liquidity event or select publicly-traded companies that lack access to public capital or are sensitive to equity ownership dilution.
33
Asset Management
We may engage in the asset management business by providing investment advisory services to externally managed funds that may be formed in the future. We may, from time to time, serve as the investment manager of such funds and may receive management and other fees for such services. Such funds may have overlapping investment objectives and may invest in asset classes similar to those targeted by us.
Portfolio and Investment Activity
The total value of our investment portfolio was $342.4 million at March 31, 2007 as compared to $283.2 million at December 31, 2006. The weighted average value of our investment portfolio during the quarter ended March 31, 2007 was approximately $290.0 million. The weighted average value of the portfolio during the quarter reflects the effect of the timing of fundings occurring late in the quarter when compared to the ending portfolio value. During the three months ended March 31, 2007, we made debt commitments to 14 portfolio companies totaling $106.5 million and funded $78.4 million to 16 companies. During the quarter, we also received normal principal repayments of approximately $11.1 million, two companies made early repayments of $1.8 million, and we received pay downs of $9.1 million on working capital lines of credit. We also made equity investments in four existing portfolio companies totaling $1.8 million and sold one equity investment with a fair value of $500,000. At March 31, 2007, our equity investments have a fair value of approximately $9.3 million. At March 31, 2007, we had unfunded contractual commitments of $74.7 million to 22 portfolio companies. In addition, as of March 31, 2007, we executed non-binding term sheets with 15 prospective portfolio companies, representing approximately $142.3 million. These proposed investments are subject to completion of our due diligence and final approval process, as well as the negotiation of definitive documentation with the prospective portfolio companies. Not all non-binding term sheets are expected to close and do not necessarily represent future cash requirements.
Total portfolio investment activity (exclusive of unearned income) as of and for the period ended March 31, 2007 was as follows:
| ($ in millions) | March 31, 2007 | |||
| Beginning Portfolio |
$ | 283.2 | ||
| Purchase of investments |
78.4 | |||
| Equity Investments |
1.8 | |||
| Sale of Equity Investments |
(0.5 | ) | ||
| Principal payments received on investments |
(11.1 | ) | ||
| Early pay-offs and recoveries |
(10.9 | ) | ||
| Accretion of loan discounts |
0.6 | |||
| Net realized and unrealized change in investments |
1.0 | |||
| Ending Portfolio |
$ | 342.5 | ||
The following table shows the fair value of our portfolio of investments by asset class as of March 31, 2007 and December 31, 2006 (excluding unearned income):
| March 31, 2007 | December 31, 2006 | |||||||||||
| ($ in millions) | Investments at Fair Value |
Percentage of Total Portfolio |
Investments at Fair Value |
Percentage of Total Portfolio |
||||||||
| Senior debt with warrants |
$ | 321.8 | 94.0 | % | $ | 273.2 | 96.5 | % | ||||
| Subordinated debt |
11.4 | 3.3 | % | 1.9 | 0.7 | % | ||||||
| Preferred stock |
9.3 | 2.7 | % | 8.1 | 2.8 | % | ||||||
| $ | 342.5 | 100.0 | % | $ | 283.2 | 100.0 | % | |||||
34
A summary of the company’s investment portfolio at value by geographic location is as follows.
| March 31, 2007 | December 31, 2006 | |||||||||||
| ($ in millions) | Investments at Fair Value |
Percentage of Total Portfolio |
Investments at Fair Value |
Percentage of Total Portfolio |
||||||||
| United States |
$ | 329.0 | 96.1 | % | $ | 269.0 | 95.0 | % | ||||
| Canada |
9.4 | 2.7 | % | 10.5 | 3.7 | % | ||||||
| Israel |
4.1 | 1.2 | % | 3.7 | 1.3 | % | ||||||
| $ | 342.5 | 100.0 | % | $ | 283.2 | 100.0 | % | |||||
The largest companies vary from year to year as new loans are recorded and loans pay off. Loan revenue, consisting of interest, fees, and recognition of gains on equity interests, can fluctuate dramatically when a loan is paid off or a related equity interest is sold. Revenue recognition in any given year can be highly concentrated among several portfolio companies.
The following table shows the fair value of our portfolio by industry sector at March 31, 2007 and December 31, 2006 (excluding unearned income):
| March 31, 2007 | December 31, 2006 | |||||||||||
| ($ in millions) | Investments at Fair Value |
Percentage of Total Portfolio |
Investments at Fair Value |
Percentage of Total Portfolio |
||||||||
| Drug discovery |
$ | 83.9 | 24.5 | % | $ | 75.0 | 26.5 | % | ||||
| Communications & networking |
53.8 | 15.7 | % | 19.5 | 6.9 | % | ||||||
| Software |
41.1 | 12.0 | % | 40.4 | 14.3 | % | ||||||
| Electronics & computer hardware |
29.0 | 8.5 | % | 30.6 | 10.8 | % | ||||||
| Specialty pharmaceuticals |
27.6 | 8.1 | % | 18.0 | 6.4 | % | ||||||
| Consumer & business products |
21.4 | 6.3 | % | 21.9 | 7.7 | % | ||||||
| Semiconductors |
18.2 | 5.3 | % | 15.9 | 5.6 | % | ||||||
| Drug delivery |
15.9 | 4.6 | % | 16.6 | 5.9 | % | ||||||
| Therapeutic |
11.8 | 3.4 | % | 13.4 | 4.7 | % | ||||||
| Internet consumer & business services |
10.7 | 3.1 | % | 11.7 | 4.1 | % | ||||||
| Energy |
8.5 | 2.5 | % | 8.5 | 3.0 | % | ||||||
| Information services |
7.1 | 2.1 | % | — | 0.0 | % | ||||||
| Diagnostic |
5.6 | 1.6 | % | 5.9 | 2.1 | % | ||||||
| Biotechnology tools |
4.9 | 1.4 | % | 5.8 | 2.0 | % | ||||||
| Media/content/info |
3.0 | 0.9 | % | — | 0.0 | % | ||||||
| $ | 342.5 | 100.0 | % | $ | 283.2 | 100.0 | % | |||||
We use an investment grading system, which grades each debt investment on a scale of 1 to 5, to characterize and monitor our expected level of risk on the debt investments in our portfolio with 1 being the highest quality. The following table shows the distribution of our outstanding debt investments on the 1 to 5 investment grading scale at fair value as of March 31, 2007 and December 31, 2006:
| March 31, 2007 | December 31, 2006 | |||||||||||
| ($ in millions) | Investments at Fair Value |
Percentage of Total Portfolio |
Investments at Fair Value |
Percentage of Total Portfolio |
||||||||
| Investment Grading |
||||||||||||
| 1 |
$ | 16.9 | 5.2 | % | $ | 9.2 | 3.5 | % | ||||
| 2 |
246.8 | 76.7 | 220.4 | 82.6 | ||||||||
| 3 |
47.5 | 14.7 | 29.3 | 11.0 | ||||||||
| 4 |
11.1 | 3.4 | 7.8 | 2.9 | ||||||||
| 5 |
— | — | — | — | ||||||||
| $ | 322.3 | 100.0 | % | $ | 266.7 | 100.00 | % | |||||
35
As of March 31, 2007, our investments had a weighted average investment grading of 2.16 as compared to 2.14 at December 31, 2006. Our policy is to reduce the grading on our portfolio companies as they approach the point in time when they will require additional equity capital. Additionally, we may downgrade our portfolio companies if they are not meeting our financing criteria and their respective business plans. Various companies in our portfolio will require additional funding in the near term or have not met their business plans and have therefore been downgraded until the funding is complete or their operations improve.
The weighted average yield to maturity of our loan obligations was approximately 12.72%. Yields to maturity are computed using interest rates as of March 31, 2007 and include amortization of loan facility fees, commitment fees and market premiums or discounts over the expected life of the debt investments, weighted by their respective costs when averaged and are based on the assumption that all contractual loan commitments have been fully funded.
We generate revenue in the form of interest income, primarily from our investments in debt securities, and commitment and facility fees. Fees generated in connection with our debt investments are recognized over the life of the loan or, in some cases, recognized as earned. In addition, we generate revenue in the form of capital gains, if any, on warrants or other equity-related securities that we acquire from our portfolio companies. Our investments generally range from $1.0 million to $25.0 million, with an average initial principal balance of between $3.0 million and $7.0 million. Our debt investments have a term of between two and seven years and typically bear interest at a rate ranging from 8.0% to 14.0% (based on current interest rate conditions). In addition to the cash yields received on our loans, in some instances, our loans may also include any of the following: end-of-term payments, exit fees, balloon payment fees, or prepayment fees, and diligence fees, which may be required to be included in income prior to receipt. In some cases, we collateralize our investments by obtaining security interests in our portfolio companies’ assets, which may include their intellectual property. In other cases, we may obtain a negative pledge covering a company’s intellectual property. Interest on debt securities is generally payable monthly, with amortization of principal typically occurring over the term of the security for emerging-growth and expansion-stage companies. In addition, certain loans may include an interest-only period ranging from three to twelve months. In limited instances in which we choose to defer amortization of the loan for a period of time from the date of the initial investment, the principal amount of the debt securities and any accrued but unpaid interest become due at the maturity date. Our mezzanine debt investments also generally have equity enhancement features, typically in the form of warrants or other equity-related securities designed to provide us with an opportunity for capital appreciation.
As of March 31, 2007, we have received warrants in connection with our debt investments in each portfolio company, and have realized gains on four warrant positions. We currently hold warrants in 62 portfolio companies, with a fair value of approximately $10.5 million included in the investment portfolio of $342.5 million. The warrant portfolio has risen by 31% as compared to the quarter ended March 31, 2006. These warrant holdings would allow us to invest approximately $36 million if such warrants are exercised.
Results of Operations
Comparison of the Three Months Ended March 31, 2007 and 2006
Operating Income
Interest income totaled approximately $9.0 million for the three-month period ended March 31, 2007, an increase of $3.4 million or 60% as compared to $5.6 million in the first quarter of 2006 as a result of the increase in loans outstanding. Income from commitment and facility fees totaled approximately $643,000 and $853,000 for the three-month periods ended March 31, 2007 and 2006, respectively. The decrease is the result of one time fees of approximately $500,000 associated with the early payoff of a loan in the first quarter of 2006 offset by approximately $290,000 of higher loan fee amortization due to higher average loan balances outstanding as a result of origination activity. At March 31, 2007, we had approximately $4.3 million of deferred revenue related to commitment and facility fees, as compared to approximately $3.0 million as of March 31, 2006. We expect to generate additional interest income and loan fees as we continue to originate additional investments.
36
Operating Expenses
Operating expenses totaled approximately $4.5 million and $4.4 million during the three-month periods ended March 31, 2007 and 2006, respectively. Operating expenses for the first quarter of 2007 included interest expense, loan fees and unused commitment fees under the Citigroup Facility of approximately $952,000. Interest expense, loan fees and unused commitment fees for the first quarter of 2006 totaled approximately $1.9 million. The decrease in these expenses relates to lower average outstanding debt balances as well as lower average interest rate on the borrowings outstanding. Employee compensation and benefits were approximately $1.9 million and $1.2 million during the three-month periods ended March 31, 2007 and 2006, respectively. The increase in compensation expense was directly related to increasing our headcount from 19 employees at March 31, 2006 to 29 employees at March 31, 2007. General and administrative expenses increased to $1.3 million from $1.2 million during the first quarter of 2006 primarily due to increased legal expenses and professional service costs related to our status as a public company and the creation of our SBIC subsidiaries as well as increased business development expenses. In addition, we incurred approximately $254,000 of stock-based compensation expense in the first quarter of 2007 as compared to $123,000 in the first quarter of 2006.
Net Investment Income Before Income Tax Expense and Investment Gains and Losses
Net investment income before provision for income tax expense for the three-months ended March 31, 2007 totaled $5.2 million as compared with net investment income before provision for income tax expense in the first quarter of 2006 of approximately $2.0 million. This change is made up of the items described above under “Operating Income” and ”Operating Expenses.”
Net Investment Gains/Loss
During the three-months ended March 31, 2007, we generated a net realized gain totaling approximately $290,000 due to the sale of equity and warrants in one portfolio company. The net realized loss for the three months ended March 31, 2006 was due to gains from the sale of equity and warrants in one portfolio company for net proceeds of approximately $1.1 million offset by a loss of $2.8 million in one portfolio company.
We anticipate ten to twelve liquidity events from our portfolio companies in the current fiscal year, though no assurance can be made that such events will occur or gains will be realized. According to VentureOne, during the first quarter of 2007, 13 venture-backed companies successfully completed initial public offerings raising approximately $1.2 billion, double the aggregate amount raised a year ago. Also, according to VentureOne, the M&A market remains robust, with 95 venture-backed companies being acquired or merged with an estimated value of approximately $9.4 billion during 2006. We believe these developments support our confidence in the potential upside in our warrant portfolio although we can not assure you we will realize any gain on our warrants. As of March 31, 2007 two of our portfolio companies entered into letters of intent (LOI’s) to be acquired/merged, two have filed for initial public offerings and two are in late stage discussion to be sold. We can make no assurances that these transactions will be completed.
For the three-months ended March 31, 2007, net unrealized investment appreciation totaled approximately $816,000. The net unrealized appreciation and depreciation of investments is based on portfolio asset valuations determined in good faith by our Board of Directors, based on the recommendations of the Valuation Committee. At March 31, 2007, cumulative gross unrealized appreciation totaled approximately $5.7 million in 24 of our investment portfolio companies and approximately $1.6 million of gross unrealized depreciation on 38 of our investment portfolio companies. The net unrealized appreciation totaling approximately $816,000 for the three month period ended March 31, 2007 was the result of a net increase in the warrant portfolio of $467,000, an increase in value of one portfolio loan by approximately $403,000 and a reduction of approximately $55,000 related to the Citigroup warrant participation agreement. For the three months ended March 31, 2006 net unrealized appreciation of approximately $2.1 million was due to the sale or write-off of investments, appreciation of approximately $708,000 in one equity investment and net appreciation of approximately $2.2 million in the warrant portfolio, was offset by a writedown of approximately $908,000 in one loan and a
37
reduction of approximately $125,000 related to the Citigroup warrant participation agreement, resulting in net appreciation of approximately $3.9 million.
Income Taxes
We account for income taxes in accordance with the provisions of Statement of Financial Accounting Standards No. 109, Accounting for Income Taxes, which requires that deferred income taxes be determined based upon the estimated future tax effects of differences between the financial statement and tax basis of assets and liabilities given the provisions of the enacted tax law. Valuation allowances are used to reduce deferred tax assets to the amount likely to be realized.
We will elect to be treated as a RIC under Subchapter M of the Code for 2006 with the submission of our 2006 tax return. Such an election and qualification to be treated as a RIC requires that we comply with certain requirements contained in Subchapter M of the Code. For example, a RIC must meet certain requirements, including source-of-income, asset diversification and income distribution requirements. The income source requirement mandates that we receive 90% or more of our income from qualified earnings, typically referred to as “good income.” Qualified earnings may exclude such income as management fees received in connection with our SBIC or other potential outside managed funds and certain other fees.
We reported our financial position and results of operations under Subchapter C of the Code prior to 2006. As a C corporation, we accrued income tax expense on a quarterly basis until we were able to reasonably determine that we qualified as a RIC under requirements contained in Subchapter M of the Code. During 2006, we were able to reasonably determine that we could qualify as a RIC, and we accordingly reversed the income tax expense recorded during 2006 and adjusted through operations the $1.4 million deferred tax asset on our balance sheet at December 31, 2005. If we had been able to make the determination as of December 31, 2005, the impact of charging the deferred tax to operations would have reduced our NAV by approximately $0.15 per share.
Net Increase in Net Assets Resulting from Operations and Earnings Per Share
For the three-months ended March 31, 2007, net income totaled approximately $6.3 million compared to net income of approximately $2.5 million for the three-months ended March 31, 2006. These changes are made up of the items previously described.
Basic net income per share was $0.28 and fully diluted net income per share was $0.27 per share for the three-months ended March 31, 2007 as compared to a basic and fully diluted income per share of $0.25 for the three-months ended March 31, 2006.
Comparison of periods ended December 31, 2006 and 2005
Operating Income
Interest income totaled approximately $26.3 million and $9.8 million for 2006 and 2005, respectively. In 2006 and 2005, interest income included approximately $713,000 and $351,000 of income from accrued exit fees. Income from commitment and facility fees totaled approximately $3.2 million and $875,000 for 2006 and 2005, respectively. The increase in both interest and fee income was directly related to increases in origination activity as net investments at fair value grew by $106.5 million during 2006. At December 31, 2006 and 2005, we had approximately $3.4 million and $2.7 million of deferred income related to commitment and facility fees.
Operating Expenses
Operating expenses totaled approximately $18.4 million and $9.1 million during 2006 and 2005, respectively. Operating expenses for 2006 and 2005 included interest expense, loan fees and unused commitment fees under our Bridge Loan Credit Facility and the Citigroup Facility of approximately $6.6 million and $2.9 million, respectively. The increase in interest expense was due to a higher average debt balance of $70.7 million
38
in 2006 as compared to $20.3 million in 2005. Employee compensation and benefits were approximately $5.8 million and $3.7 million during 2006 and 2005, respectively. The increase in employee compensation and benefits is due to increased number of employees from 19 to 26 and bonuses of approximately $2.2 million accrued in 2006. General and administrative expenses increased to $5.4 million in 2006 from $2.3 million in 2005 primarily due to increased Board of Directors costs, legal expenses, professional service costs related to our status as a public company and the creation of our SBIC subsidiaries as well as increased expenses associated with operating a business development company. In addition, we incurred approximately $618,000 of stock- based compensation expense in 2006 as compared to $252,000 in 2005. The increase in stock-based compensation expense was due to the additional stock option grants made in 2006. We anticipate that operating expenses will increase over the next twelve months as we continue to incur higher interest expense on higher average outstanding debt balances, increase the number of our employees to support our growth and incur additional expenses related to being a public company, including expenses related to continued compliance requirements under the Sarbanes-Oxley Act.
Net Investment Income (Loss) Before Income Tax Expense and Investment Gains and Losses
Net investment income before income tax expense for the year ended December 31, 2006 totaled $11.1 million as compared with a net investment income before income tax expense in 2005 of approximately $1.5 million. This change is made up of the items described above.
Net Investment Gains
In 2006, we generated realized gains totaling approximately $3.3 million from the sale of common stock of one communications and networking company, one internet consumer and business services company and two biopharmaceutical companies. We recognized realized losses in 2006 of approximately $4.9 million on the disposition of loans to two portfolio companies. We recognized a realized gain of approximately $482,000 during the year ended December 31, 2005 from the sale of common stock of one biopharmaceutical portfolio company. During 2006, we reversed approximately $162,000 of net unrealized gains to realized gains.
For the year ended December 31, 2006, net unrealized investment appreciation totaled approximately $2.5 million. The net unrealized appreciation and depreciation of investments is based on portfolio asset valuations determined in good faith by our Board of Directors, based on the recommendations of the Valuation Committee. For the year ended December 31, 2006, we recognized approximately $4.9 million of gross unrealized appreciation on 11 of our portfolio companies and approximately $1.6 million of gross unrealized depreciation on 41 of our portfolio companies. As of December 31, 2006, the net unrealized investment gains recognized by the company were reduced by approximately $377,000 for a warrant participation agreement with Citigroup. For a more detailed discussion, see “Borrowings.”
Income Taxes
Through December 31, 2005, we were taxed under Subchapter C of the Code and recorded a tax expense of $255,000 for 2005. We will elect to be treated as a RIC under Subchapter M of the Code with the filing of our 2006 federal income tax return, which election will be effective as of January 1, 2006. Provided we continue to qualify for RIC tax treatment, our income generally will not be subject to federal income or excise tax to the extent we timely make the requisite distributions to stockholders. We have distributed and currently intend to distribute sufficient dividends to eliminate our investment company taxable income for 2006. As such, no provision for Federal or state income taxes related to operations in 2006 was required.
At December 31, 2005, the Company had a deferred tax asset of approximately $1,454,000 which was adjusted through operations during the first quarter of 2006. Upon the determination that we would qualify as a RIC, any remaining deferred tax asset was reversed. We elected to recognize all of our net built-in gains at the time of the conversion to a RIC and paid tax on the built-in gains with the filing of our 2005 tax return. In making this election, our portfolio was marked to market at the time of the RIC election and we paid
39
approximately $294,000 in federal and state tax on the resulting taxable gain. In addition, upon completion of the 2005 tax returns, we recorded an additional tax benefit of approximately $345,000.
To qualify as a RIC we were required by December 31, 2006 to distribute our earnings and profits while we were taxable as a C corporation. During 2006, we distributed $1.20 per share to our shareholders, of which approximately $0.09 was deemed to be a distribution of these accumulated earnings and profits, $0.97 was deemed to be a distribution of 2006 income and $0.14 was a return of capital. The distribution of our income and our accumulated earnings and profits is considered ordinary income to our shareholders in 2006.
Net Increase in Net Assets Resulting from Operations and Earnings Per Share
For the year ended December 31, 2006 net income totaled approximately $11.4 million compared to net income of approximately $2.1 million for the period ended December 31, 2005. These changes are made up of the items previously described.
Basic net income per share was $0.85 and fully diluted net income per share was $0.84 per share for the year ended December 31, 2006 compared to basic and diluted net income per share of $0.30 per share for the period ended December 31, 2005. The net income per share for 2006 was affected by an increase in the weighted average shares outstanding of approximately 6.4 million shares and 6.5 million shares on a basic and diluted basis, respectively, in 2006 as compared to 2005.
Comparison of periods ended December 31, 2005 and 2004
Operating Income
Interest income totaled approximately $9.8 million and $214,000 for 2005 and 2004, respectively. In 2005, interest income included approximately $351,000 of revenue from accrued exit fees. Income from commitment and facility fees totaled approximately $875,000 and $0 for 2005 and 2004, respectively. The increases are the result of origination activity and yield from investments. At December 31, 2005, we had approximately $2.7 million of deferred revenue related to commitment and facility fees. We expect to generate additional interest income and loan commitment fees as we continue to originate additional investments.
Operating Expenses
Operating expenses totaled approximately $9.1 million and $2.3 million during 2005 and 2004, respectively. Operating expenses for 2005 included interest expense, loan fees and unused commitment fees under our Bridge Loan Credit Facility and the Citigroup Facility of approximately $2.9 million. There were no interest or loan fees in 2004. Employee compensation and benefits were approximately $3.7 million and $1.2 million during 2005 and 2004, respectively. The increase in employee compensation and benefits is due to increased number of employees from 11 to 19 and bonuses of approximately $1.3 million paid in 2005. General and administrative expenses increased to $2.3 million from $411,000 in 2004 primarily due to increased legal expenses, professional service costs related to our status as a public company and the creation of our SBIC subsidiaries as well as increased business development expenses. In addition, we incurred approximately $252,000 of stock-based compensation expense in 2005 as compared to $680,000 in 2004. The decrease in stock-based compensation expense was due to the immediate vesting of certain options granted in 2004. We anticipate that operating expenses will increase over the next twelve months as we continue to incur higher interest expense on higher average outstanding debt balances, increase the number of our employees to support our growth and incur additional expenses related to being a public company, including expenses related to the implementation of the requirements under the Sarbanes-Oxley Act.
Net Investment Income (Loss) Before Income Tax Expense and Investment Gains and Losses
Net investment income before income tax expense for the year ended December 31, 2005 totaled $1.5 million as compared with a net investment loss before income tax expense in 2004 of approximately $2.0 million. This change is made up of the items described above.
40
Net Investment Gains
For the period ended December 31, 2005, net unrealized investment appreciation totaled approximately $353,000. The net unrealized appreciation and depreciation of investments is based on portfolio asset valuations determined in good faith by our Board of Directors, based on the recommendations of the Valuation Committee of our Board of Directors. For the year ended December 31, 2005, we recognized approximately $4.1 million of gross unrealized appreciation on 14 of our portfolio investment companies and approximately $3.4 million of gross unrealized depreciation on 15 of our portfolio investment companies. Approximately $3.3 million of the unrealized depreciation was due to a reduction in the fair value of a loan to one portfolio company. The net unrealized investment gains recognized by the company were reduced by approximately $342,000 for a warrant participation agreement with Citigroup. We generated a net realized gain totaling approximately $482,000 from the sale of common stock of one biopharmaceutical portfolio company. We did not recognize any realized or unrealized gains or losses during the period ended December 31, 2004.
Income Taxes
We account for income taxes in accordance with the provisions of Statement of Financial Accounting Standards No. 109, Accounting for Income Taxes, which requires that deferred income taxes be determined based upon the estimated future tax effects of differences between the financial statement and tax basis of assets and liabilities given the provisions of the enacted tax law. Valuation allowances are used to reduce deferred tax assets to the amount likely to be realized.
We will elect to be treated as a RIC under Subchapter M of the Code for 2006. However, such an election and qualification to be treated as a RIC requires that we comply with certain requirements contained in Subchapter M of the Code. For example, in order to obtain RIC tax treatment we must meet certain requirements, including source-of-income, asset diversification and income distribution requirements. The income source requirement mandates that we receive 90% or more of our income from qualified earnings, typically referred to as “good income.” Qualified earnings may exclude such income as management fees received in connection with our SBIC or other potential outside managed funds and certain other fees.
As such, we reported our financial position and results of operations under Subchapter C of the Code prior to 2006. As a C corporation, we accrued income tax expense on a quarterly basis until we were able to reasonably determine that we qualified as a RIC under requirements contained in Subchapter M of the Code. During 2006, we were able to reasonably determine that we could qualify as a RIC, and we accordingly reversed the income tax expense recorded during 2006 and adjusted through operations the $1.4 million deferred tax asset on our balance sheet at December 31, 2005. If we had been able to make the determination as of December 31, 2005, the impact of charging the deferred tax to operations would have reduced our NAV by approximately $0.15 per share.
Net Increase in Net Assets Resulting from Operations and Earnings Per Share
For the year ended December 31, 2005 net income totaled approximately $2.1 million compared to a net loss of approximately $2.0 million for the period ended December 31, 2004. These changes are made up of the items previously described.
Basic and diluted net income per share for the year ended December 31, 2005 was $0.30 as compared to a basic loss per share of $1.72 and diluted loss per share of $1.58 for the period ended December 31, 2004. The net income per share for 2005 was affected by an increase in the number of average shares outstanding in 2005 as compared to 2004 of approximately 5.9 million shares and 5.7 million shares on a basic and diluted basis, respectively.
41
Financial Condition, Liquidity, and Capital Resources
For the three month period ended March 31, 2007
For the quarter ended March 31, 2007, net cash used in operating activities totaled approximately $54.4 million as compared to net cash provided by operating activities of approximately $4.1 million for the quarter ended March 31, 2006. This increase was due primarily due to $80.2 million used for investment in our portfolio companies offset by $21.8 million of principal payments in the first quarter 2007 as compared $33.0 million used for investment in our portfolio companies offset by $34.0 million in principal repayments in the first quarter of 2006. Cash provided by investing activities for the quarter ended March 31, 2007 totaled approximately $86,000 and was primarily used for the purchase of capital equipment offset by a decrease in other long-term assets. Net cash provided by financing activities totaled $79.4 million for the quarter ended March 31, 2007 and was primarily comprised of net borrowings of $72.0 million and net proceeds from the sale of common stock for $13.6 million offset by a cash dividend payment of $6.1 million. In the quarter ended March 31, 2006, we received approximately $5.0 million in net proceeds from the sale of common stock, $10.0 million of credit facility borrowings and made cash dividend payments of $2.9 million.
As of March 31, 2007, net assets totaled $269.6 million, with a net asset value per share of $11.68. We intend to generate additional cash primarily from equity capital, future borrowings as well as cash flows from operations, including income earned from investment in our portfolio companies and, to a lesser extent, from the temporary investment of cash in U.S. government securities and other high-quality debt investments that mature in one year or less. Our primary use of funds will be for operations, investments in portfolio companies and cash distributions to holders of our common stock. After we have used our current capital resources, we expect to raise additional capital to support our future growth through future equity offerings, issuances of senior securities and/or future borrowings, to the extent permitted by the 1940 Act.
As required by the 1940 Act, our asset coverage must be at least 200% after each issuance of senior securities. Our asset coverage as of March 31, 2007 was approximately 339%.
At March 31, 2007, we had approximately $41.5 million in cash and cash equivalents and available borrowing capacity of approximately $37.0 million under our Citigroup Facility, subject to existing terms and advance rates. We primarily invest cash on hand in interest bearing deposit accounts.
During the first quarter of 2007, we received net proceeds of approximately $2.7 million from the exercise of the 5-Year Warrants.
We anticipate that we will continue to fund our investment activities through a combination of debt and additional equity capital over the next year. As of March 31, 2007, we had $113.0 million outstanding under the Citigroup Facility. Through March 30, 2007, advances under the Facility carried interest at one-month LIBOR plus 165 basis points. On March 30, 2007, the interest on all borrowings was reduced to LIBOR plus a spread of 1.20%. As of March 31, 2007, based on $244.3 million of eligible loans in the collateral pool and existing advance rates, we have access to approximately $21.4 million of borrowing capacity available under our $150.0 million securitized credit facility from Citigroup. In addition, Citigroup has an equity participation right of 10% of the realized gains on warrants collateralized under the Citigroup Facility. See Note 4 to the Consolidated Financial Statements for discussion of the participation right. We anticipate that portfolio fundings entered into in succeeding periods will allow us to utilize the full borrowing capacity of the Citigroup Facility. See “Borrowings.”
42
At March 31, 2007 and December 31, 2006, we had the following debt:
| March 31, 2007 | December 31, 2006 | |||||||||||
| ($ in thousands) | Facility Amount |
Amount Outstanding |
Facility Amount |
Amount Outstanding | ||||||||
| Citigroup Facility |
$ | 150,000 | $ | 113,000 | $ | 150,000 | $ | 41,000 | ||||
| Total |
$ | 150,000 | $ | 113,000 | $ | 150,000 | $ | 41,000 | ||||
On September 27, 2006, HTII received a license to operate as a Small Business Investment Company under the SBIC program and will be able to borrow funds from the SBA against eligible previously approved investments and additional contributions to regulatory capital. On January 30, 2007, HTII received notification that its initial application for leverage under its SBC license was approved allowing HTII to commence drawing up to $50.0 million of leverage under its first tranche of capital from the SBA. At March 31, 2007, we had a net investment of $25.0 million in HTII, and there are eight outstanding investments in the amount of $16.6 million. We made our first draw from the SBA on April 26, 2007 for $12.0 million.
During the first quarter of 2007, the Company raised approximately $10.9 million, net of estimated issuance costs when the underwriters who participated in the public offering in December 2006 exercised their right to purchase 840,000 shares of common stock. The net proceeds from the sale of the shares in the offering were used to reduce credit borrowings, originate investments and for general corporate purposes. We believe these funding sources combined with cash on hand at March 31, 2007, and cash provided from operations and financing activities will allow us to continue investing activities for 5 to 9 months.
For the Year Ended December 31, 2006
On April 21, 2006, we raised approximately $34.0 million, net of issuance costs, from a rights offering of 3,411,922 shares of common stock. Funds raised in the offering were partially used to pay off the remaining $15.0 million outstanding under the Bridge Loan Credit Facility and to pay down $10.0 million under our Citigroup Facility.
On October 20, 2006, we raised approximately $30.0 million, net of estimated issuance costs, in a public offering of 2.5 million shares of common stock delivered on October 25, 2006.
On December 12, 2006, we raised approximately $74.1 million, net of estimated issuance costs, in a public offering of 5.7 million shares of its common stock. On January 3, 2007, the underwriters exercised their over-allotment option and purchased an additional 840,000 shares of our common stock for additional net proceeds to the company of approximately $10.9 million.
At December 31, 2006, we had approximately $16.4 million in cash and cash equivalents and borrowing capacity of approximately $109.0 million under our Citigroup Facility of which approximately $49.6 million was immediately available, subject to existing terms and advance rates. We primarily invest cash on hand in interest bearing deposit accounts.
For the year ended December 31, 2006, net cash used in operating activities totaled approximately $91.3 million as compared to $156.1 million in 2005. This decrease was due primarily to proceeds of $87.5 million in principal repayments offset by $196.0 million used for investments in our portfolio companies as compared to $18.8 million in principal repayments offset by $177.8 million used for investments in 2005. Cash used in investing activities for the year ended December 31, 2006 totaled $1.5 million and was used for the purchase of capital equipment and other long-term assets. Net cash provided by financing activities totaled $93.7 million for the year ended December 31, 2006. In 2006, we received approximately $143.0 million in net proceeds from the sale of common stock, and made cash dividend payments of $14.2 million. During the year
43
ended December 31, 2006, we fully repaid $25.0 million under our Bridge Loan Credit Facility to an affiliate of Farallon Capital Management, L.L.C. and repaid a net $10.0 million under our Citigroup Facility.
As of December 31, 2006, net assets totaled $255.4 million, with a net asset value per share of $11.65. We intend to generate additional cash primarily from equity capital, future borrowings as well as cash flows from operations, including income earned from investments in our portfolio companies and, to a lesser extent, from the temporary investment of cash in U.S. government securities and other high-quality debt investments that mature in one year or less. Our primary use of funds will be investments in portfolio companies and cash distributions to holders of our common stock. After we have used our current capital resources, we expect to raise additional capital to support our future growth through future equity offerings, issuances of senior securities and/or future borrowings, to the extent permitted by the 1940 Act.
As required by the 1940 Act, our asset coverage must be at least 200% after each issuance of senior securities. Our asset coverage as of December 31, 2006 was approximately 723%.
We anticipate that we will continue to fund our investment activities through a combination of debt and additional equity capital over the next year. As of December 31, 2006, we had $41.0 million outstanding under the Citigroup Facility. Advances under the Facility bear interest at one-month LIBOR plus 165 basis points. As of December 31, 2006, based on $164.9 million of eligible loans in the collateral pool and existing advance rates, we have access to approximately $49.6 million of borrowing capacity available under our existing $150.0 million securitized credit facility from Citigroup. As additional new loans are funded and pledged as collateral, we will be able to increase our borrowing capacity under the Citigroup Facility beyond the current $49.6 million. In addition, Citigroup has an equity participation right of 10% of the realized gains on warrants collateralized under the Citigroup Facility. See Note 4 to the Consolidated Financial Statements for discussion of the participation right. We anticipate that portfolio fundings entered into in succeeding periods will allow us to utilize the full borrowing capacity of the Citigroup Facility.
On September 27, 2006, HTII received a license to operate as a Small Business Investment Company under the SBIC program and will be able to borrow funds from the SBA against eligible previously approved investments and additional contributions to regulatory capital. On January 30, 2007, HTII received notification that its initial application for leverage under its SBC license was approved allowing HTII to commence drawing up to $50.0 million of leverage under its first tranche of capital from the SBA. At December 31, 2006, we had a net investment of $10.4 million in HTII, and there are 4 outstanding investments in the amount of $11.1 million and we have not drawn any leverage. HTM is a wholly-owned subsidiary of the Company. The Company is the sole limited partner of HTII and HTM is the general partner.
During the fourth quarter of 2006, the Company raised approximately $104.1 million, net of estimated issuance costs, in a public offering of 8.2 million shares of common stock. The net proceeds from the sale of the shares in the offering were used to reduce credit borrowings, originate investments and for general corporate purposes. We believe these funding sources combined with cash on hand at December 31, 2006, and cash provided from operations and financing activities will allow us to continue investing activities for 5 to 9 months.
Off Balance Sheet Arrangements
In the normal course of business, we are party to financial instruments with off-balance sheet risk. These consist primarily of unfunded commitments to extend credit, in the form of loans, to our portfolio companies. Unfunded commitments to provide funds to portfolio companies will not be reflected on our balance sheet. Our unfunded commitments may be significant from time to time. As of March 31, 2007, we had unfunded commitments of approximately $74.7 million. These commitments will be subject to the same underwriting and ongoing portfolio maintenance as are the on-balance sheet financial instruments that we hold. Since these commitments may expire without being drawn upon, the total commitment amount does not necessarily represent future cash requirements.
44
Contractual Obligations
The following table shows our contractual obligations as of March 31, 2007:
| Payments due by period (dollars in thousands) | |||||||||||||||
| Contractual Obligations(1) |
Total | Less than 1 year |
1-3 years | 3-5 years | After 5 years | ||||||||||
| Borrowings(2)(3) |
$ | 113,000 | $ | 113,000 | $ | — | $ | — | $ | — | |||||
| Operating Lease Obligations |
3,132 | 457 | 1,384 | 993 | 298 | ||||||||||
| Total |
$ | 116,132 | $ | 113,457 | $ | 1,384 | $ | 993 | $ | 298 | |||||
| (1) | Excludes commitments to extend credit to our portfolio companies. |
| (2) | Borrowings under our Citigroup Credit Facility are listed based on the contractual maturity of the credit facility. Actual repayments could differ significantly due to prepayments by our existing portfolio companies, modifications of our current agreements with our existing portfolio companies and modification of the credit facility. |
| (3) | We also have a warrant participation agreement with Citigroup as discussed further below. |
Borrowings
On August 1, 2005, we, through Hercules Funding Trust I, our affiliated statutory trust, executed a $100 million securitized credit facility with Citigroup Global Markets Realty Corp., which we refer to as the Citigroup Facility. The Citigroup Facility is collateralized by loans and warrants from our portfolio companies, and includes an advance rate of approximately 55% of eligible loans. Interest on borrowings under the Citigroup Facility is payable monthly and was charged at one-month LIBOR plus a spread of 1.65%. We also paid a loan origination fee equal to 0.25% of the Citigroup Facility and will be subject to an unused commitment fee of 0.25%. On March 6, 2006, the Company amended the Citigroup Facility with an agreement that increased the borrowing capacity under the facility to $125.0 million. On December 6, 2006, the Company amended the Citigroup Facility with an agreement that increased the borrowing capacity under the facility to $150.0 million until March 31, 2007. On March 30, 2007, this increase was extended to July 31, 2007, and the interest on all borrowings was reduced to LIBOR plus a spread of 1.20%. On May 2, 2007, we amended the Citigroup Facility to extend the expiration date to May 1, 2008, increased the borrowing capacity under the facility to $250 million and included Deutsche Bank Securities Inc. as a participant along with Citigroup Markets Realty Corp.
The Citigroup Facility contains covenants that, among other things, require us to maintain a minimum net worth and to restrict the loans securing the Citigroup Facility to certain dollar amounts, to concentrations in certain geographic regions and industries, to certain loan grade classifications, to certain security interests and to certain interest payment terms. Citigroup has an equity participation right through a warrant participation agreement on the pool of loans and warrants collateralized under the Citigroup facility. Pursuant to the warrant participation agreement, we granted to Citigroup a 10% participation in all warrants held as collateral. As a result, Citigroup is entitled to 10% of the realized gains on the warrants until the realized gain paid to Citigroup pursuant to the agreement equals $3,750,000 (the “Maximum Participation Limit”). The obligations under the warrant participation agreement continue even after the Citigroup facility is terminated until the Maximum Participation Limit has been reached. During the quarter ended March 31, 2007, the Company reduced its realized gain by approximately $16,000 for Citigroup’s participation in the gain on sale of an equity security and recorded an additional liability and reduced unrealized gains by approximately $55,000 for Citigroup’s participation in unrealized gains in the warrant portfolio. The value of their participation right on unrealized gains in the related equity investments since inception of the agreement was approximately $432,000 at March 31, 2007 and is included in accrued liabilities and reduces the unrealized gain recognized by us at March 31, 2007. Since inception of the agreement, we have paid Citigroup approximately $292,000 under the warrant participation agreement thereby reducing our realized gains. There was $113.0 million of outstanding borrowings under the Citigroup Facility at March 31, 2007.
45
We intend to aggregate pools of funded loans using the Citigroup Facility or other conduits that we may seek until a sufficiently large pool of funded loans is created which can then be securitized. We expect that any loans included in a securitization facility will be securitized on a non-recourse basis with respect to the credit losses on the loans. There can be no assurance that we will be able to complete this securitization strategy, or that it will be successful.
Dividends
The following table summarizes our dividends declared and paid on all shares, including restricted stock, to date:
| Date Declared |
Record Date |
Payment Date |
Amount Per Share | ||||
| October 27, 2005 | November 1, 2005 | November 17, 2005 | $ | 0.025 | |||
| December 9, 2005 | January 6, 2006 | January 27, 2006 | 0.300 | ||||
| April 3, 2006 | April 10, 2006 | May 5, 2006 | 0.300 | ||||
| July 19, 2006 |
July 31, 2006 | August 28, 2006 | 0.300 | ||||
| October 16, 2006 |
November 6, 2006 | December 1, 2006 | 0.300 | ||||
| February 7, 2007 |
February 19, 2007 | March 19, 2007 | 0.300 | ||||
| $ | 1.525 | ||||||
On May 3, 2007, we announced that our Board of Directors approved a dividend of $0.30 per share to shareholders of record as of May 16, 2007 and payable on June 18, 2007. Distributions in excess of our current and accumulated earnings and profits would be treated first as a return of capital to the extent of the stockholder’s tax basis, and any remaining distributions would be treated as a capital gain. The determination of the tax attributes of our distributions is made annually as of the end of our fiscal year based upon its taxable income for the full year and distributions paid for the full year, therefore a determination made on a quarterly basis may not be representative of the actual tax attributes of our distributions for a full year. If we determined the tax attributes of its distributions year-to-date as of March 31, 2007, 80.1% would be from ordinary income and 19.9% would be a return of capital for stockholders, however there can be no certainty to stockholders that this determination is representative of what the tax attributes of its 2007 distributions to stockholders will actually be.
Critical Accounting Policies
The preparation of consolidated financial statements in conformity with U.S. GAAP requires management to make estimates and assumptions that affect the reported amounts of assets and liabilities, and disclosure of contingent assets and liabilities at the date of the consolidated financial statements, and revenues and expenses during the period reported. On an ongoing basis, our management evaluates its estimates and assumptions, which are based on historical experience and on various other assumptions that we believe to be reasonable under the circumstances. Actual results could differ from those estimates. Changes in our estimates and assumptions could materially impact our results of operations and financial condition.
Valuation of Portfolio Investments. The most significant estimate inherent in the preparation of our consolidated financial statements is the valuation of investments and the related amounts of unrealized appreciation and depreciation of investments recorded.
As a BDC, we invest primarily in illiquid securities, including debt and equity-related securities of private companies. Our investments are generally subject to some restrictions on resale and generally have no established trading market. Because of the type of investments that we make and the nature of our business, our valuation process requires an analysis of various factors. Our valuation methodology includes the examination of, among other things, the underlying investment performance, financial condition and market changing events that impact valuation.
46
At March 31, 2007, approximately 89% of our total assets represented investments in portfolio companies, 99% of which are recorded at fair value by the Board of Directors. Value, as defined in Section 2(a) (41) of the 1940 Act, is (i) the market price for those securities for which a market quotation is readily available and (ii) for all other securities and assets, fair value is as determined in good faith by the Board of Directors. Since there is typically no readily available market value for the investments in our portfolio, we value substantially all of our investments at fair value as determined in good faith by our board pursuant to a valuation policy and a consistent valuation process. Due to the inherent uncertainty in determining the fair value of investments that do not have a readily available market value, the fair value of our investments determined in good faith by our board may differ significantly from the value that would have been used had a ready market existed for such investments, and the differences could be material.
There is no single standard for determining fair value in good faith. As a result, determining fair value requires that judgment be applied to the specific facts and circumstances of each portfolio investment. Unlike banks, we are not permitted to provide a general reserve for anticipated loan losses. Instead, we must determine the fair value of each individual investment on a quarterly basis. We will record unrealized depreciation on investments when we believe that an investment has decreased in value, including where collection of a loan or realization of an equity security is doubtful. Conversely, where appropriate, we will record unrealized appreciation if we believe that the underlying portfolio company has appreciated in value and, therefore, that our investment has also appreciated in value.
With respect to private debt and equity securities, each investment is valued using industry valuation benchmarks, and, where appropriate, the value is assigned a discount reflecting the illiquid nature of the investment, and our minority, non-control position. When a qualifying external event such as a significant purchase transaction, public offering, or subsequent debt or equity sale occurs, the pricing indicated by the external event will be used to corroborate our private debt or equity valuation.
Income. Interest income is recorded on the accrual basis and is recognized as earned in accordance with the contractual terms of the loan agreement to the extent that such amounts are expected to be collected. Original Issue Discount, “OID,” initially represents the value of detachable equity warrants obtained in conjunction with the acquisition of debt securities and is accreted into interest income over the term of the loan as a yield enhancement. When a loan becomes 90 days or more past due, or if management otherwise does not expect the portfolio company to be able to service its debt and other obligations, the Company will, as a general matter, place the loan on non-accrual status and cease recognizing interest income on that loan until all principal has been paid. However, Hercules may make exceptions to this policy if the investment has sufficient collateral value and is in the process of collection. As of March 31, 2007 and 2006, no loans were on non-accrual status.
Fee Income. Loan origination and commitment fees received in full at the inception of a loan are deferred and amortized into fee income as an enhancement to the related loan’s yield over the contractual life of the loan. Loan exit fees to be paid at the termination of the loan are accreted into fee income over the contractual life of the loan. These fees are reflected as adjustments to the loan yield in accordance with FAS 91, Accounting for Nonrefundable Fees and Costs Associated with Originating or Acquiring loans and Initial Direct Costs of Leases.
Stock-Based Compensation. We have issued and may, from time to time, issue additional stock options to employees under our 2004 Equity Incentive Plan. We follow Statement of Financial Accounting Standards No. 123 (revised 2004), Share-Based Payments (“FAS 123R”), to account for stock options granted. Under FAS 123R, compensation expense associated with stock-based compensation is measured at the grant date based on the fair value of the award and is recognized.
47
Recent Developments
On April 5, 2007, Hercules and its subsidiary, Hercules Technology II, L.P., received an exemptive order from the Securities and Exchange Commission allowing Hercules to exclude debt securities issued by its subsidiary, Hercules Technology II, L.P. from the asset coverage requirements applicable to Hercules. Hercules Technology Growth Capital, Inc. is the sole limited partner of Hercules Technology II, L.P.
Through its subsidiary, Hercules Technology II, L.P., Hercules Technology Growth Capital, Inc. intends to seek up to $127.2 million in leverage in various tranches over the next two years if it satisfies certain regulatory requirements, which is the maximum amount currently available under regulations of the SBA. Hercules Technology II, L.P. is currently approved to draw up to $50.0 million and on April 26, 2007, it borrowed $12.0 million under the SBA program. In May 2007, we applied for approval to borrow an additional $77.2 million.
On May 1, 2007 the Board of Directors declared a dividend of $0.30 per share for the first quarter, payable on June 18, 2007 to shareholders of record as of May 16, 2007.
On May 2, 2007, the Company amended the Citigroup Facility to extend the expiration date to May 1, 2008, increased the borrowing capacity under the facility to $250 million and included Deutsche Bank Securities Inc. as a participant along with Citigroup Markets Realty Corp. The credit facility is a one year facility and is renewable on May 1, 2008 with an interest rate of LIBOR plus a spread of 1.20%.
On May 3, 2007, Novadaq Pharmaceuticals, a publicly traded Canadian corporation, acquired certain assets of Xillix Technologies for cash and common stock. Of the purchase price, Hercules will receive approximately CDN $810,000 and approximately 225,000 shares of Novadaq Pharmaceuticals’ common stock.
Recent Accounting Pronouncements
In June 2006, the FASB issued FASB Interpretation No. 48 (“FIN 48”), “Accounting for Uncertainty in Income Taxes—an interpretation of FASB Statement No. 109”, which clarifies the accounting for uncertainty in income taxes recognized in an enterprise’s financial statements in accordance with FASB Statement No. 109, Accounting for Income Taxes. FIN 48 prescribes a recognition threshold and measurement attribute for the financial statement recognition and measurement of a tax position taken or expected to be taken in a tax return. FIN 48 also provides guidance on derecognition, classification, interest and penalties, accounting in interim periods, disclosure, and transition. FIN 48 became effective as of January 1, 2007.
We conducted a review of all open tax year’s income recognition and expense deduction filing positions and income tax returns filed (federal and state) for determination of any uncertain tax positions that may require recognition of a tax liability. This review encompassed an analysis of all book/tax difference adjustments as well as the timing of income and expense recognition for all tax years still open under the statute of limitations. As a result, we determined that it is more likely than not that each tax position taken on a previously filed return or to be taken on current tax returns will be sustained on examination based on the technical merits of the positions and therefore, no recognition of a tax liability on an uncertain tax position for FIN 48 purposes is anticipated.
In September 2006, the FASB issued Statement on Financial Accounting Standards No. 157, Fair Value Measurements (“FAS 157”). This standard clarifies the definition of fair value for financial reporting, establishes a framework for measuring fair value and requires additional disclosures about the use of fair value measurements. FAS 157 is effective for financial statements issued for fiscal years beginning after November 15, 2007 and interim periods within those fiscal years. As of March 31, 2007, we do not believe the adoption of FAS 157 will impact the amounts reported in the financial statements, however, additional disclosures will be required about the inputs used to develop the measurements of fair value and the effect of certain of the measurements reported in the statement of operations for a fiscal period.
48
Quantitative and Qualitative Disclosures about Market Risk
We are subject to financial market risks, including changes in interest rates. As of March 31, 2007, 41 loans in our portfolio were at fixed rates and 22 loans were at variable rates. Over time additional investments may be at variable rates. We may, in the future, hedge against interest rate fluctuations by using standard hedging instruments such as futures, options, and forward contracts. While hedging activities may insulate us against changes in interest rates, they may also limit our ability to participate in the benefits of lower interest rates with respect to our borrowed funds and higher interest rates with respect to our portfolio of investments. Interest rates on our borrowings are based on LIBOR. At March 31, 2007, the borrowing rate under the Citigroup Facility was LIBOR plus 1.20%.
49
General
We are a specialty finance company that provides debt and equity growth capital to technology-related and life-sciences companies at all stages of development. Our investment objective is to maximize our portfolio’s total return by generating current income from our debt investments and capital appreciation from our equity-related investments. We are an internally-managed, non-diversified closed-end investment company that has elected to be treated as a business development company under the Investment Company Act of 1940.
We primarily finance privately-held companies backed by leading venture capital and private equity firms and also may finance certain select publicly-traded companies that lack access to public capital or are sensitive to equity ownership dilution. Our principal executive office is located in Silicon Valley, and we have additional offices in the Boston, Boulder, Chicago, Costa Mesa and Columbus areas. Our goal is to be the leading structured mezzanine capital provider of choice for venture capital and private equity-backed technology-related and life sciences companies requiring sophisticated and customized financing solutions. Our strategy is to evaluate and invest in a broad range of ventures active in the technology and life science industries and to offer a full suite of growth capital products at all levels of the capital structure. We invest primarily in structured mezzanine debt and, to a lesser extent, in senior debt and equity. We use the term “structured mezzanine debt investment” to refer to any debt investment, such as a senior or subordinated secured loan, that is coupled with an equity component, including warrants, options or rights to purchase common or preferred stock. Our structured mezzanine debt investments will typically be secured by some or all of the assets of the portfolio company.
We focus our investments in companies active in the technology industry sub-sectors characterized by products or services that require advanced technologies, including computer software and hardware, networking systems, semiconductors, semiconductor capital equipment, information technology infrastructure or services, Internet consumer and business services, telecommunications, telecommunications equipment, media and life sciences. Within the life sciences sub-sector, we focus on medical devices, bio-pharmaceutical, health care services and information systems companies. We refer to all of these companies as “technology-related” companies and intend, under normal circumstances, to invest at least 80% of the value of our assets in such businesses.
Our primary business objectives are to increase our net income, net operating income and net asset value by investing in structured mezzanine debt and equity of venture capital and private equity backed technology-related companies with attractive current yields and the potential for equity appreciation and realized gains. Our structured debt investments typically include warrants or other equity interests, giving us the potential to realize equity-like returns on a portion of our investment. In some cases, we receive the right to make additional equity investments in our portfolio companies in connection with future equity financing rounds. Capital that we provide directly to venture capital and private equity backed technology-related companies is generally used for growth, and in select cases for acquisitions or recapitalizations.
Our portfolio is comprised of, and we anticipate that our portfolio will continue to be comprised of, investments in technology-related companies at various stages of their development. Consistent with regulatory requirements, we invest primarily in United States based companies and to a lesser extent in foreign companies. To date, our emphasis has been primarily on private companies following or in connection with their first institutional round of equity financing, which we refer to as emerging-growth companies, and private companies in later rounds of financing, which we refer to as expansion-stage companies. In 2007, we expect to increase our investment activity in established companies comprised of private companies in one of their final rounds of equity financing prior to a liquidity event or select publicly-traded companies that lack access to public capital or are sensitive to equity ownership dilution.
We commenced investment operations in September 2004 and have built our investment portfolio on disciplined underwriting as well as on-going portfolio management. At March 31, 2007, we had outstanding
50
structured mezzanine debt investments representing approximately $322.7 million, warrant investments of $10.5 million and equity investments of $9.3 million for a total investment portfolio at fair value of $342.5 million. In addition, at March 31, 2007, we had unfunded contractual commitments of $74.7 million.
At March 31, 2007, the weighted average yield to maturity of our loan obligations was approximately 12.72%. Yields to maturity are computed using interest rates at inception of the loan and include amortization of loan facility fees, original issue discounts, commitment fees and market premiums or discounts over the expected life of the debt investments, weighted by their respective costs when averaged and are based on the assumption that all contractual loan commitments have been fully funded.
During the first quarter of 2007, we entered into approximately $108.5 million of investment commitments and invested approximately $80.2 million in 9 new portfolio companies and 11 existing portfolio companies. In addition, during the first quarter of 2007, two companies made early repayments of $1.8 million, and we received paydowns of $9.1 million on working capital lines of credit.
Corporate History and Offices
We are a Maryland corporation formed in December 2003 that began investment operations in September 2004. We are an internally managed, non-diversified, closed-end investment company that has elected to be treated as a business development company under the 1940 Act. As a business development company, we are required to meet various regulatory tests. A business development company is required to invest at least 70% of its total assets in private or thinly traded public U.S.-based companies. A business development company also must meet a coverage ratio of total net assets to total senior securities, which include all of our borrowings (including accrued interest payable) and any preferred stock we may issue in the future, of at least 200%.
From incorporation through December 31, 2005, we were taxed as a corporation under Subchapter C of the Code. We will elect to be treated for federal income tax purposes as a RIC under Subchapter M of the Code with the filing of our federal corporate income tax return for 2006, which election, when actually made, will be effective as of January 1, 2006. To obtain and maintain the federal income tax benefits of RIC status, we must meet specified source-of-income and asset diversification requirements and distribute annually an amount equal to at least 90% of the sum of our net ordinary income and realized net short-term capital gains in excess of realized net long-term capital losses, if any, out of assets legally available for distribution. If we satisfy these requirements, we generally will not have to pay corporate-level taxes on any income that we distribute to our stockholders.
Our principal executive offices are located at 400 Hamilton Avenue, Suite 310, Palo Alto, California 94301 and our telephone number is (650) 289-3060. We also have additional offices in the Boston, Boulder, Chicago and Columbus areas. We maintain a website on the Internet at www.herculestech.com. Information contained in our website is not incorporated by reference into this prospectus, and you should not consider that information as part of this prospectus. Our annual reports on Form 10-K, quarterly reports on Form 10-Q and our current reports on Form 8-K, as well as any amendments to those reports, are available free of charge through our website as soon as reasonably practicable after we file them with, or furnish them to, the Securities and Exchange Commission.
Our Market Opportunity
We believe that technology-related companies compete in one of the largest and most rapidly growing sectors of the U.S. economy and that continued growth is supported by ongoing innovation and performance improvements in technology products as well as the adoption of technology across virtually all industries in response to competitive pressures. We believe that an attractive market opportunity exists for a specialty finance company focused primarily on structured mezzanine investments in technology-related and life science companies for the following reasons:
| • | Technology-related companies have generally been underserved by traditional lending sources; |
51
| • | Unfulfilled demand exists for structured debt financing to technology-related companies; |
| • | Structured mezzanine debt products are less dilutive and complement equity financing from venture capital and private equity funds; and |
| • | Valuations currently assigned to technology-related companies in private financing rounds, while increasing in recent years, still provide a good opportunity for attractive capital returns. |
Technology-Related Companies Underserved by Traditional Lenders. We believe many viable technology-related companies backed by financial sponsors have been unable to obtain sufficient growth financing from traditional lenders, including financial services companies such as commercial banks and finance companies, in part because traditional lenders have continued to consolidate and have adopted a more risk-averse approach to lending that has resulted in tightened credit standards in recent years. More importantly, we believe traditional lenders are typically unable to underwrite the risk associated with financial sponsor-backed emerging-growth or expansion-stage companies effectively.
The unique cash flow characteristics of many technology-related companies include significant research and development expenditures and high projected revenue growth thus often making such companies difficult to evaluate from a credit perspective. In addition, the balance sheets of emerging-growth and expansion-stage companies often include a disproportionately large amount of intellectual property assets, which can be difficult to value. Finally, the speed of innovation in technology and rapid shifts in consumer demand and market share add to the difficulty in evaluating technology-related companies.
Due to the difficulties described above, we believe traditional lenders are generally refraining from entering the structured mezzanine debt marketplace for emerging-growth and expansion-stage companies, instead preferring the risk-reward profile of senior debt. Traditional lenders generally do not have flexible product offerings that meet the needs of technology-related companies. The financing products offered by traditional lenders typically impose on borrowers many restrictive covenants and conditions, including limiting cash outflows and requiring a significant depository relationship to facilitate rapid liquidation.
Unfulfilled Demand for Structured Debt Financing to Technology-Related Companies. Private debt capital in the form of structured debt financing from specialty finance companies continues to be an important source of funding for technology-related companies. We believe that the level of demand for structured debt financing to emerging-growth and expansion-stage companies is a function of the level of annual venture equity investment activity. In 2006, venture capital-backed companies received, in approximately 2,454 transactions, equity financing in an aggregate amount of approximately $25.8 billion, representing an 8% increase over the preceding year, as reported by Dow Jones VentureOne. In addition, overall, the median round size in 2006 was $7 million, up from $6.5 million in 2005, and the highest annual median since 2000. For the second year in a row, equity investors are focusing more than a third of their investment activity on early-stage financings. Overall, seed- and first-round deals made up 36% of the deal flow in 2006, and about the same concentration of deal flow went to later-stage deals. As a result, we believe a range of $20 billion to $25 billion in annual equity investments to venture-backed companies will be sustainable for future years.
We believe that demand for structured debt financing is currently unfulfilled, in part because historically the largest debt capital providers to technology-related companies exited the market during 2001 while at the same time lending requirements of traditional lenders have become more stringent. We therefore believe this is an opportune time to be active in the structured lending market for technology-related companies.
Structured Mezzanine Debt Products Complement Equity Financing From Venture Capital and Private Equity Funds. We believe that technology-related companies and their financial sponsors will continue to view structured debt securities as an attractive source of capital because it augments the capital provided by venture capital and private equity funds. We believe that our structured mezzanine debt products provide access to growth capital that otherwise may only be available through incremental investments by existing equity investors. As such, we provide portfolio companies and their financial sponsors with an opportunity to diversify their capital sources. Generally, we
52
believe emerging-growth and expansion-stage companies target a portion of their capital to be debt in an attempt to achieve a higher valuation through internal growth. In addition, because financial sponsor-backed companies have recently been more mature prior to reaching a liquidity event, we believe our investments could provide the debt capital needed to grow or recapitalize during the extended period prior to liquidity events.
Lower Valuations for Private Technology-Related Companies. During the downturn in technology industries that began in 2000, the markets saw sharp and broad declines in valuations of venture capital and private equity-backed technology-related companies. According to Dow Jones VentureOne, median pre-money valuations for venture capital-backed companies in 2000 was $25.0 million declining to a low of $10.0 million in 2003. In addition, according to VentureOne, as of December 31, 2006 median pre-money valuations for venture capital-backed companies in 2006 was $18.5 million compared to $15.0 million in 2005. While pre-money valuations have been steadily increasing since 2003, we believe the valuations currently assigned to venture capital and private equity-backed technology-related companies in private financing rounds are still relatively low and should allow us to continue to build a portfolio of equity-related securities at attractive valuation levels.
Our Business Strategy
Our strategy to achieve our investment objective includes the following key elements:
Leverage the Experience and Industry Relationships of Our Management Team and Investment Professionals. We have assembled a team of experienced investment professionals with extensive experience as venture capitalists, commercial lenders, and originators of structured debt and equity investments in technology-related companies. Our investment professionals have, on average, more than 15 years of experience as equity investors in, and/or lenders to, technology-related companies. In addition, our team members have originated structured mezzanine investments in over 200 technology-related companies, representing over $1.0 billion in investments, and have developed a network of industry contacts with investors and other participants within the venture capital and private equity communities. In addition, members of our management team also have operational, research and development and finance experience with technology-related companies. We have established contacts with leading venture capital and private equity fund sponsors, public and private companies, research institutions and other industry participants, which should enable us to identify and attract well-positioned prospective portfolio companies.
We concentrate our investing activities in industries in which our investment professionals have investment experience. We believe that our focus on financing technology-related companies will enable us to leverage our expertise in structuring prospective investments, to assess the value of both tangible and intangible assets, to evaluate the business prospects and operating characteristics of technology-related companies and to identify and originate potentially attractive investments with these types of companies.
Mitigate Risk of Principal Loss and Build a Portfolio of Equity-Related Securities. We expect that our investments have the potential to produce attractive risk adjusted returns through current income, in the form of interest and fee income, as well as capital appreciation from equity-related securities. We believe that we can mitigate the risk of loss on our debt investments through the combination of loan principal amortization, cash interest payments, relatively short maturities, security interests in the assets of our portfolio companies, covenants requiring prospective portfolio companies to have certain amounts of available cash at the time of our investment and the continued support from a venture capital or private equity firm at the time we make our investment.
In addition, historically our structured debt investments typically include warrants or other equity interests, giving us the potential to realize equity-like returns on a portion of our investment. In addition, we expect, in some cases, to receive the right to make additional equity investments in our portfolio companies in connection with future equity financing rounds. We believe these equity interests will create the potential for long-term capital gains in connection with the future liquidity events of these technology-related companies.
53
Provide Customized Financing Complementary to Financial Sponsors’ Capital. We offer a broad range of investment structures and possess expertise and experience to effectively structure and price investments in technology-related companies. Unlike many of our competitors that only invest in companies that fit a specific set of investment parameters, we have the flexibility to structure our investments to suit the particular needs of our portfolio companies. We offer customized financing solutions ranging from senior debt to equity capital, with a focus on structured mezzanine debt.
We use our relationships in the financial sponsor community to originate investment opportunities. Because venture capital and private equity funds typically invest solely in the equity securities of their portfolio companies, we believe that our debt investments will be viewed as an attractive source of capital, both by the portfolio company and by the portfolio company’s financial sponsor. In addition, we believe that many venture capital and private equity fund sponsors encourage their portfolio companies to use debt financing for a portion of their capital needs as a means of potentially enhancing equity returns, minimizing equity dilution and increasing valuations prior to a subsequent equity financing round or a liquidity event.
Invest at Various Stages of Development. We provide growth capital to technology-related companies at all stages of development, from emerging-growth companies, to expansion-stage companies and established companies. We believe that this provides us with a broader range of potential investment opportunities than those available to many of our competitors, who generally focus their investments on a particular stage in a company’s development. Because of the flexible structure of our investments and the extensive experience of our investment professionals, we believe we are well positioned to take advantage of these investment opportunities at all stages of prospective portfolio companies’ development.
Benefit from Our Efficient Organizational Structure. We believe that the perpetual nature of our corporate structure enables us to be a long-term partner for our portfolio companies in contrast to traditional mezzanine and investment funds, which typically have a limited life. In addition, because of our access to the equity markets, we believe that we may benefit from a lower cost of capital than that available to private investment funds. We are not subject to requirements to return invested capital to investors nor do we have a finite investment horizon. Capital providers that are subject to such limitations are often required to seek a liquidity event more quickly than they otherwise might, which can result in a lower overall return on an investment.
Deal Sourcing Through Our Proprietary Database. We have developed a proprietary and comprehensive structured query language-based (SQL) database system to track various aspects of our investment process including sourcing, originations, transaction monitoring and post-investment performance. As of December 31, 2006, our proprietary SQL-based database system included over 10,900 technology-related companies and over 3,000 venture capital private equity sponsors/investors, as well as various other industry contacts. This proprietary SQL system allows us to maintain, cultivate and grow our industry relationships while providing us with comprehensive details on companies in the technology-related industries and their financial sponsors.
Our Investments and Operations
We invest in debt securities and, to a lesser extent, equity securities, with a particular emphasis on structured mezzanine debt.
We generally seek to invest in companies that have been operating for at least six to 12 months prior to the date of our investment. We expect that such entities will, at the time of investment, be generating revenues or will have a business plan that anticipates generation of revenues within 24 to 36 months. Further, we anticipate that on the date of our investment we will obtain a lien on available assets, which may or may not include intellectual property, and these companies will have sufficient cash on their balance sheet to amortize their debt for at least six to 15 months following our investment. We generally require that a prospective portfolio company, in addition to having sufficient capital to support leverage, demonstrate an operating plan capable of generating cash flows or raising the additional capital necessary to cover its operating expenses and service its debt.
54
We expect that our investments will generally range from $1.0 million to $25.0 million. Our debt investments generally have an average initial principal balance of between $3.0 million and $7.0 million and have maturities of two to seven years, with an expected average term of three years. We typically structure our debt securities to provide for amortization of principal over the life of the loan, but may include an interest-only period, and our loans will be collateralized by a security interest in the borrower’s assets, although we may not have the first claim on these assets and the assets may not include intellectual property. Our debt investments carry fixed or variable contractual interest rates typically ranging from 8% to 14%. In addition to the cash yields received on our loans, in some instances, certain loans may also include any of the following: end of term payments, exit fees, balloon payment fees or prepayment fees, which we may be required to include in income prior to receipt. We also generate revenue in the form of commitment and facility fees, and to a lesser extent, due diligence fees.
In addition, historically our structured mezzanine debt investments generally have had, and we expect they will continue to have, equity enhancement features, typically in the form of warrants or other equity-related securities designed to provide us with an opportunity for capital appreciation. The warrants typically will be immediately exercisable upon issuance and generally will remain exercisable for the lesser of seven years or three years after an initial public offering. The exercise prices for the warrants varies from nominal exercise prices to exercise prices that are at or above the current fair market value of the equity for which we receive warrants. We may structure warrants to provide minority rights provisions and put rights upon the occurrence of certain events. We generally target a total annualized return (including interest, fees and value of warrants) of 12% to 25% for our debt investments.
Typically, our debt and equity investments take one of the following forms:
| • | Structured Mezzanine Debt. We seek to invest a majority of our assets in structured mezzanine debt of prospective portfolio companies. Traditional “mezzanine” debt is a layer of high-coupon financing between debt and equity that most commonly takes the form of subordinated debt coupled with warrants, combining the cash flow and risk characteristics of both senior debt and equity. However, our structured mezzanine investments may be the only debt capital on the balance sheet of our portfolio companies, and in many cases we have a first priority security interest in all of our portfolio company’s assets (other than any tangible assets specifically financed with senior debt). Our structured mezzanine debt investments typically have maturities of between two and seven years, with full amortization for emerging-growth or expansion-stage companies and little or no amortization for select established companies. Our structured mezzanine debt investments carry a contractual interest rate between 8% and 14% and may include an additional end-of-term payment, are in an amount between $3 million and $25 million with an average initial principal balance of between $3 million and $7 million (although this investment size may vary proportionately as the size of our capital base changes) and have an average term of three years. In some cases we collateralize our investments by obtaining security interests in our portfolio companies’ assets, which may include their intellectual property. In other cases we may prohibit a company from pledging or otherwise encumbering their intellectual property. We may structure our mezzanine debt investments with restrictive affirmative and negative covenants, default penalties, prepayment penalties, lien protection, equity calls, take control provisions and board observation rights. |
| • | Senior Debt. We seek to invest a limited portion of our assets in senior debt of prospective portfolio companies. Senior debt has a senior position with respect to a borrower’s scheduled interest and principal payments and holds a first priority security interest in the assets pledged as collateral. Senior debt also may impose covenants on a borrower with regard to cash flows and changes in capital structure, among other items. Our senior debt investments carry a contractual interest rate between 8% and 12%, are in an amount between $1 million and $7 million with an average initial principal balance of $3 million, and have an average term of under three years. We generally collateralize our investments by obtaining security interests in our portfolio companies’ assets, which may include their intellectual property. In other cases we may obtain a negative pledge covering a company’s intellectual property. |
55
| Our senior loans, in certain instances, may be tied to the financing of specific assets. In connection with a senior debt investment, we may also provide the borrower with a working capital line-of-credit that will either carry an interest rate ranging from the prime rate to 12% or fixed or variable rates based on the prime rate or LIBOR plus a margin, generally maturing in one year, and will be secured by accounts receivable and / or inventory. |
| • | Equipment Loans. We intend to seek to invest a limited portion of our assets in equipment-based loans to early-stage prospective portfolio companies. Equipment-based loans are secured by a first priority security interest in the assets financed. We anticipate that these loans will generally be for amounts up to $2.5 million, will carry a contractual interest rate between prime and prime plus 400 basis points, and have an average term between three and four years. |
| • | Equity-Related Securities. The equity-related securities we hold consist primarily of warrants or other equity interests generally obtained in connection with our structured mezzanine debt investments. In addition to the warrants received as a part of a structured mezzanine debt financing, we typically receive the right to make equity investments in a portfolio company in connection with the next equity financing round for that company. This right will provide us with the opportunity to further enhance our returns over time through opportunistic equity investments in our portfolio companies. Equity-related investments are typically in the form of preferred or common equity and may be structured with a dividend yield, providing us with a current return, and with customary anti-dilution protection and preemptive rights. In the future, we may achieve liquidity through a merger or acquisition of a portfolio company, a public offering of a portfolio company’s stock or by exercising our right, if any, to require a portfolio company to buy back the equity-related securities we hold. We may also make direct equity investments into portfolio companies. |
A comparison of the typical features of our various investment alternatives is set forth in the chart below.
| Senior Debt | Structured Mezzanine Debt |
Equipment Loans | Equity Securities | |||||
| Typical Structure |
Term or revolving debt |
Term debt with warrants |
Term debt with warrants |
Preferred stock or common stock | ||||
| Investment Horizon |
Usually 3 years |
Long term, ranging from 2 to 7 years, with an average of 3 years |
Ranging from 3 to 4 years |
Long term | ||||
| Ranking/Security |
Senior/First lien |
Senior or junior lien |
Secured by underlying equipment |
None/unsecured | ||||
| Financial Covenants |
Generally comprehensive |
Less restrictive; Mostly financial; Maintenance-based |
None |
None | ||||
| Risk Tolerance |
Low |
Medium |
High |
High | ||||
| Coupon/Dividend |
Cash pay—Floating or fixed rate |
Cash Pay—fixed rate; Payment-in-kind in limited cases |
Cash pay—floating or fixed rate |
Payment-in kind in limited cases | ||||
| Customization or Flexibility |
Standard |
More flexible |
Standard |
Flexible | ||||
| Equity Dilution |
None to low |
Low |
Low |
High | ||||
Investment Criteria
We have identified several criteria that we believe are important in achieving our investment objective with respect to prospective portfolio companies. These criteria, while not inclusive, provide general guidelines for our investment decisions.
56
Portfolio Composition. While we generally focus our investments in venture capital and private equity backed technology-related companies, we seek to diversify across various financial sponsors as well as across various stages of companies’ development and various technology industry sub-sectors and geographies.
Continuing Support from One or More Financial Sponsors. We generally invest in companies in which one or more established financial sponsors have previously invested and continue to make a contribution to the management of the business. We believe that having established financial sponsors with meaningful commitments to the business is a key characteristic of a prospective portfolio company. In addition, we look for representatives of one or more financial sponsors to maintain seats on the Board of Directors of a prospective portfolio company as an indication of such commitment.
Company Stage of Development. While we invest in companies at various stages of development, we generally require that prospective portfolio companies be beyond the seed stage of development and generally have received or have commitments for their first institutional round of equity financing. We expect a prospective portfolio company to demonstrate its ability to commence revenue generation or increase its revenues and operating cash flow over time. The anticipated growth rate of a prospective portfolio company is a key factor in determining the value that we ascribe to any warrants or other equity securities that we may acquire in connection with an investment in debt securities.
Operating Plan. We generally require that a prospective portfolio company, in addition to having sufficient access to capital to support leverage, demonstrate an operating plan capable of generating cash flows or the ability to raise the additional capital necessary to cover its operating expenses and service its debt. Specifically, we require that a prospective portfolio company demonstrate at the time of our proposed investment that it has cash on its balance sheet, or is in the process of completing a financing so that it will have cash on its balance sheet, sufficient to support its operations for a minimum of 6 to 15 months.
Security Interest. In many instances we generally seek a first priority security interest in all of the portfolio company’s tangible and intangible assets as collateral for our debt investment, subject in some cases to permitted exceptions. In other cases we may prohibit a company from pledging or otherwise encumbering their intellectual property. Although we do not intend to operate as an asset-based lender, the estimated liquidation value of the assets, if any, collateralizing the debt securities that we hold is an important factor in our credit analysis. We evaluate both tangible assets, such as accounts receivable, inventory and equipment, and intangible assets, such as intellectual property, customer lists, networks and databases.
Covenants. Our investments typically include one or more of the following covenants; cross-default and material adverse change provisions, require the portfolio company to provide periodic financial reports and operating metrics and will typically limit the portfolio company’s ability to incur additional debt, sell assets, engage in transactions with affiliates and consummate an extraordinary transaction, such as a merger or recapitalization without our consent. In addition, we may require other performance or financial based covenants, as we deem appropriate.
Exit Strategy. Prior to making a debt investment that is accompanied by an equity-related security in a prospective portfolio company, we analyze the potential for that company to increase the liquidity of its equity through a future event that would enable us to realize appreciation in the value of our equity interest. Liquidity events may include an initial public offering, a private sale of our equity interest to a third party, a merger or an acquisition of the company or a purchase of our equity position by the company or one of its stockholders.
57
Investment Process
We have organized our management team around the four key elements of our investment process:
| • | Origination; |
| • | Underwriting; |
| • | Documentation; and |
| • | Loan and Compliance Administration. |
Our investment process is summarized in the following chart:
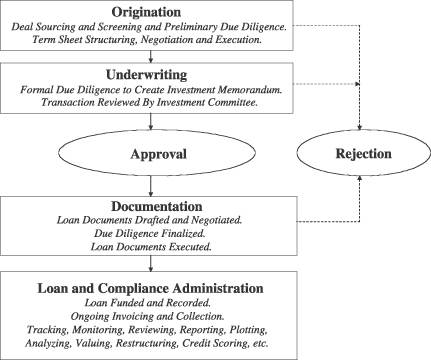
Origination
The origination process for our investments includes sourcing, screening, preliminary due diligence and deal structuring and negotiation, all leading to an executed non-binding term sheet. Our investment origination team, which consists of 17 senior investment professionals is headed by our Chief Executive Officer, Mr. Henriquez, and is responsible for sourcing potential investment opportunities. The origination team uses their extensive relationships with various leading financial sponsors, management contacts within technology-related companies, trade sources, technology conferences and various publications to source prospective portfolio companies.
In addition, we have developed a proprietary and comprehensive SQL-based database system to track various aspects of our investment process including sourcing, originations, transaction monitoring and post-investment performance. As of March 31, 2007, our proprietary SQL-based database system included over 10,900 technology-related companies and over 3,000 venture capital private equity sponsors/investors, as well as various other industry contacts. This proprietary SQL system allows our origination team to maintain, cultivate and grow our industry relationships while providing our origination team with comprehensive details on companies in the technology-related industries and their financial sponsors.
58
If a prospective portfolio company generally meets certain underwriting criteria, we perform preliminary due diligence, which may include high level company and technology assessments, evaluation of its financial sponsors’ support, market analysis, competitive analysis, evaluation of select management, risk analysis and transaction size, pricing, return analysis and structure analysis. If the preliminary due diligence is satisfactory, and the origination team recommends moving forward, we then structure, negotiate and execute a non-binding term sheet with the potential portfolio company. Upon execution of a term sheet, the investment opportunity moves to the underwriting process to complete formal due diligence review and approval.
Underwriting
The underwriting review includes formal due diligence and approval of the proposed investment in the portfolio company.
Due Diligence. Our due diligence on a prospective investment is typically completed by two or more investment professionals which we define as the underwriting team. The underwriting team for a proposed investment consists of the deal sponsor who possesses specific industry knowledge and is responsible for originating and managing the transaction, other investment professional(s) who perform due diligence, credit and corporate financial analyses and, as needed, our Chief Legal Officer. To ensure consistent underwriting, we generally use our standardized due diligence methodologies, which include due diligence on financial performance and credit risk as well as an analysis of the operations, accounting policies and the legal and applicable regulatory framework of a prospective portfolio company. The members of the underwriting team work together to conduct due diligence and understand the relationships among the prospective portfolio company’s business plan, operations and financial performance.
As part of our evaluation of a proposed investment, the underwriting team prepares an investment memorandum for presentation to the investment committee. In preparing the investment memorandum, the underwriting team typically meets with select key management of the company and select financial sponsors and assembles information necessary to the investment decision. If and when appropriate, the investment professionals may also contact industry experts and customers, vendors or, in some cases, competitors of the company.
Approval Process. The sponsoring managing director or principal presents the investment memorandum to our investment committee for consideration. The unanimous approval of our investment committee is required before we proceed with any investment. The members of our investment committee are our Chief Executive Officer, our Chief Legal Officer, our Chief Credit Officer and our Chief Financial Officer. The investment committee generally meets weekly and more frequently on an as-needed basis. Our investment committee process is generally the same at the SBIC except that our two Senior Managing Directors are also members of the committee. The Senior Managing Directors abstain from voting with respect to investments they originate.
Documentation
Our documentation group, headed by our Chief Legal Officer, administers the front-end documentation process for our loans. This group is responsible for documenting the term sheet approved by the investment committee to memorialize the transaction with a portfolio company. This group negotiates loan documentation and, subject to the approval of the Chief Legal Officer, final documents are prepared for execution by all parties. The documentation group generally uses the services of external law firms to complete the necessary documentation.
Loan and Compliance Administration
Our loan and compliance administration group, headed by our Chief Financial Officer, administers loans and tracks covenant compliance on our investments and oversees periodic reviews of our critical functions to ensure adherence with our internal policies and procedures. After funding of a loan in accordance with the investment committee’s approval, the loan is recorded in our SQL-based database system. The loan and
59
compliance administration group is also responsible for ensuring timely interest and principal payments and collateral management and advises the investment committee on the financial performance and trends of each portfolio company, including any covenant violations that occur, to aid us in assessing the appropriate course of action for each portfolio company and evaluating overall portfolio quality. In addition, the loan and compliance administration group advises the Valuation Committee of the board regarding the credit and investment grading for each portfolio company as well as changes in the value of collateral that may occur.
The loan and compliance administration group monitors our portfolio companies in order to determine whether the companies are meeting our financing criteria and their respective business plans and also monitors the financial trends of each portfolio company from its monthly or quarterly financial statements to assess the appropriate course of action for each company and to evaluate overall portfolio quality. In addition, our management team closely monitors the status and performance of each individual company through our SQL-based database system and periodic contact with our portfolio companies’ management teams and their respective financial sponsors.
Credit and Investment Grading System. Our loan and compliance administration group uses an investment grading system to characterize and monitor our outstanding loans. Our loan and compliance administration group monitors and, when appropriate, recommends changes to investment grading. Our investment committee reviews the recommendations and/or changes to the investment grading, which are submitted on a quarterly basis to the Valuation Committee and our Board of Directors for approval. We use the following investment grading system approved by our Board of Directors:
| Grade 1. | Loans involve the least amount of risk in our portfolio. The borrower is performing above expectations, and the trends and risk profile is generally favorable. |
| Grade 2. | The borrower is performing as expected and the risk profile is neutral to favorable. All new loans are initially graded 2. |
| Grade 3. | The borrower may be performing below expectations, and the loan’s risk has increased materially since origination. We increase procedures to monitor a borrower that may have limited amounts of cash remaining on the balance sheet, is approaching its next equity capital raise within the next three months to a year, or if the estimated fair value of the enterprise may be lower than when the loan was originated. We will generally lower the loan grade to a level 3 even if the company is performing in accordance to plan as it approaches the need to raise additional cash to fund its operations. Once the borrower closes its new equity capital raise, we may increase the loan grade back to grade 2. |
| Grade 4. | The borrower is performing materially below expectations, and the loan risk has substantially increased since origination. Loans graded 4 may experience some partial loss or full return of principal but are expected to realize some loss of interest which is not anticipated to be repaid in full, which, to the extent not already reflected, may require the fair value of the loan to be reduced to the amount we anticipate will be recovered. Grade 4 investments are closely monitored. |
| Grade 5. | The borrower is in workout, materially performing below expectations and a significant risk of principal loss is probable. Loans graded 5 will experience some partial principal loss or full loss of remaining principal outstanding is expected. Grade 5 loans will require the fair value of the loans be reduced to the amount, if any, we anticipate will be recovered. |
At March 31, 2007, our investments had a weighted average investment grading of 2.16.
60
Managerial Assistance
As a business development company, we offer, and provide upon request, managerial assistance to our portfolio companies. This assistance could involve, among other things, monitoring the operations of our portfolio companies, participating in board and management meetings, consulting with and advising officers of portfolio companies and providing other organizational and financial guidance. We may receive fees for these services.
Asset Management
We may engage in the asset management business by providing investment advisory services to externally managed funds that may be formed in the future. Such funds may focus on our lower yielding assets, such as senior debt, equipment based only financing or equity only funding. We may contribute assets currently in our portfolio to the extent that our management and Board of Directors deems it appropriate. We may, from time to time, serve as the investment manager of such funds and may receive management and other fees for such services. Such funds may have overlapping investment objectives and may invest in asset classes similar to those targeted by us.
Competition
Our primary competitors provide financing to prospective portfolio companies and include non-bank financial institutions, federally or state chartered banks, venture debt funds, financial institutions, venture capital funds, private equity funds, investment funds and investment banks. Many of these entities have greater financial and managerial resources than we have, and the 1940 Act imposes certain regulatory restrictions on us as a business development company to which many of our competitors are not subject. However, we believe that few of our competitors possess the expertise to properly structure and price debt investments to venture capital and private equity backed technology-related companies. We believe that our specialization in financing technology-related companies will enable us to assess the value of intellectual property assets, evaluate the business prospects and operating characteristics of prospective portfolio companies and, as a result, identify investment opportunities that produce attractive risk-adjusted returns. For additional information concerning the competitive risks we face, see “Risk Factors—Risks Related to our Business and Structure—We operate in a highly competitive market for investment opportunities, and we may not be able to compete effectively.”
Legal Proceedings
From time to time, we may be party to certain legal proceedings incidental to the normal course of our business including the enforcement of our rights under contracts with our portfolio companies. While the outcome of these legal proceedings cannot at this time be predicted with certainty, we do not expect that these proceedings will have a material effect upon our financial condition or results of operations.
Corporate Structure
We are a Maryland corporation and an internally-managed, non-diversified closed-end investment company that has elected to be regulated as a business development company under the 1940 Act. Hercules Technology II, L.P. (“HTII”), our wholly-owned subsidiary, is licensed under the Small Business Investment Act of 1958 as a Small Business Investment Company. Hercules Technology SBIC Management, LLC (“HTM”), another wholly-owned subsidiary, functions as the general partner of our subsidiary HTII. Hercules Funding I LLC, our wholly owned subsidiary, and Hercules Funding Trust I, our affiliated statutory trust, function as vehicles to collateralize loans under our securitized credit facility with Citigroup Global Markets Realty Corp. In December 2006, we established Hydra Management LLC and Hydra Management Co., Inc. an investment manager and an investment management company, respectively.
Our principal executive offices are located at 400 Hamilton Avenue, Suite 310, Palo Alto, California 94301. We also have offices in Boston, Massachusetts, Boulder, Colorado, Chicago, Illinois, Costa Mesa, California and Columbus, Ohio.
61
Employees
As of March 31, 2007, we had 29 employees, including 17 investment and portfolio management professionals all of whom have extensive prior experience working on financing transactions for technology-related companies. We intend to expand our management team, financial analyst group and operational personnel to support our growing portfolio of companies. We may also hire additional managing directors if our business indicates the need to expand the team to take advantage of growing market opportunities.
62
The following tables set forth certain information as of March 31, 2007 regarding each portfolio company in which we had a debt or equity investment. The general terms of our loans and other investments are described in “Business—Our Investments.” We offer to make available significant managerial assistance to our portfolio companies. In addition, we may receive rights to observe the Board of Directors’ meetings of our portfolio companies.
| Portfolio Company |
Industry |
Type of Investment(1) |
Percentage of Class Held on a Fully Diluted Basis(6)(7) |
Cost(2) | Value(3) | ||||||||
| Acceleron Pharmaceuticals, Inc. (1.57%)*(4) |
Drug Discovery | Senior Debt | |||||||||||
| 24 Emily Street Cambridge, MA 02139 |
Matures June 2009 Interest rate 10.25% |
$ | 3,793,731 | $ | 3,793,731 | ||||||||
| Preferred Stock Warrants | 1.67 | % | 69,106 | 413,349 | |||||||||
| Preferred Stock Warrants | 0.65 | % | 34,996 | 32,709 | |||||||||
| Acceleron Pharmaceuticals, Inc. (0.41%) |
Preferred Series A Stock | 1.71 | % | 1,000,000 | 1,111,112 | ||||||||
| Total Acceleron Pharmaceuticals, Inc. |
4,897,833 | 5,350,901 | |||||||||||
| Aveo Pharmaceuticals, Inc. (5.57%)(4) |
Drug Discovery | Senior Debt | |||||||||||
| 75 Sidney Street 4th Floor Cambridge, MA 02139 |
Matures September 2009 |
14,863,247 | 14,863,247 | ||||||||||
| Preferred Stock Warrants | 10.18 | % | 144,056 | 107,840 | |||||||||
| Preferred Stock Warrants | 3.39 | % | 46,288 | 41,439 | |||||||||
| Total Aveo Pharmaceuticals, Inc. |
15,053,591 | 15,012,526 | |||||||||||
| Elixir Pharmaceuticals, Inc. (3.71%) |
Drug Discovery | Senior Debt | |||||||||||
| One Kendall Square Building 1000 5th Floor Cambridge, MA 02139 |
Matures June 2010 Interest rate Prime + 2.45% Preferred Stock Warrants |
1.47 | % | |
9,868,289 149,510 |
|
9,868,289 139,244 | ||||||
| Total Elixir Pharmaceuticals, Inc. |
10,017,799 | 10,007,533 | |||||||||||
| EpiCept Corporation (3.75%) |
Drug Discovery | Senior Debt | |||||||||||
| 777 Old Saw Mill River Road Tarrytown, NY 10591 |
Matures August 2009 Interest rate 11.70% |
9,377,181 | 9,377,181 | ||||||||||
| Common Stock Warrants | 3.25 | % | 794,633 | 740,783 | |||||||||
| Total EpiCept Corporation |
10,171,814 | 10,117,964 | |||||||||||
| Memory Pharmaceuticals Corp (2.13%) |
Drug Discovery | Senior Debt | |||||||||||
| 100 Phillips Parkway Montvale, NJ 07645 |
Matures February 2011 |
4,966,633 | 4,966,633 | ||||||||||
| Common Stock Warrants | 0.83 | % | 1,057,399 | 786,899 | |||||||||
| Total Memory Pharmaceuticals Corp |
6,024,032 | 5,753,532 | |||||||||||
| Merrimack Pharmaceuticals, Inc. (2.28%)(4) |
Drug Discovery | Convertible Senior Debt | |||||||||||
| 101 Binney Street Cambridge, MA 02142 |
Matures October 2008 Interest rate 11.15% |
5,449,928 | 5,736,928 | ||||||||||
| Preferred Stock Warrants | 3.60 | % | 155,456 | 398,921 | |||||||||
| Total Merrimack Pharmaceuticals, Inc. |
5,605,384 | 6,135,849 | |||||||||||
| Paratek Pharmaceuticals, Inc. (2.12%)(4) |
Drug Discovery | Senior Debt | |||||||||||
| 75 Kneeland Street Boston, MA 02111 |
Matures June 2008 Interest rate 11.10% |
5,622,203 | 5,622,203 | ||||||||||
| Preferred Stock Warrants | 18.53 | % | 137,396 | 101,151 | |||||||||
| Total Paratek Pharmaceuticals, Inc. |
5,759,599 | 5,723,354 | |||||||||||
| Portola Pharmaceuticals, Inc. (5.57%) |
Drug Discovery | Senior Debt | |||||||||||
| 270 E Grand Ave South San Francisco, CA 94080 |
Matures September 2010 |
14,865,809 | 14,865,809 | ||||||||||
| Preferred Stock Warrants | 1.43 | % | 151,557 | 139,614 | |||||||||
| Total Portola Pharmaceuticals, Inc. |
15,017,366 | 15,005,423 | |||||||||||
| Sirtris Pharmaceuticals, Inc (3.80%)(4) |
Drug Discovery | Senior Debt | |||||||||||
| 790 Memorial Drive Cambridge, MA 02139 |
Matures April 2011 Interest rate 10.60% |
9,928,937 | 9,928,937 | ||||||||||
| Preferred Stock Warrants | 2.22 | % | 88,829 | 316,536 | |||||||||
| Sirtris Pharmaceuticals, Inc. (0.19%) |
Preferred Stock (C-1) | 1.30 | % | 500,000 | 500,000 | ||||||||
| Total Sirtris Pharmaceuticals, Inc. |
10,517,766 | 10,745,473 | |||||||||||
63
| Portfolio Company |
Industry |
Type of Investment(1) |
Percentage of Class Held on a Fully Diluted Basis(6)(7) |
Cost(2) | Value(3) | ||||||||
| Total Drug Discovery (31.10%) |
$ | 83,065,184 | $ | 83,852,555 | |||||||||
| IKANO Communications, Inc. (8.38%)(4) |
Communications & Networking | Senior Debt | |||||||||||
| 265 East 100 South, Ste 245 Salt Lake City, UT 84111 |
Matures March 2011 Interest rate 11.00% |
22,500,000 | 22,500,000 | ||||||||||
| Preferred Stock Warrants | 0.04 | % | 45,460 | 30,260 | |||||||||
| Preferred Stock Warrants | 0.07 | % | 72,344 | 50,900 | |||||||||
| Total IKANO Communications, Inc. |
22,617,804 | 22,581,160 | |||||||||||
| Interwise, Inc. (0.72%)(4) |
Communications & Networking | Senior Debt | |||||||||||
| 25 First Street Suite 412 Cambridge, MA 02141 |
Matures August 2008 Interest rate 17.50% |
1,701,456 | 1,701,456 | ||||||||||
| Preferred Stock Warrants | 7.84 | % | 268,401 | 237,599 | |||||||||
| Total Interwise, Inc. |
1,969,857 | 1,939,055 | |||||||||||
| Pathfire, Inc. (1.74%)(4) |
Communications & Networking | Senior Debt | |||||||||||
| 245 Hembree Park Drive Roswell, GA 30076 |
Matures December 2008 Interest rate Prime + 3.65% |
4,678,068 | 4,678,068 | ||||||||||
| Preferred Stock Warrants | 4.74 | % | 63,276 | 13,390 | |||||||||
| Total Pathfire, Inc. |
4,741,344 | 4,691,458 | |||||||||||
| Ping Identity Corporation (0.92%)(4) |
Communications & Networking | Senior Debt | |||||||||||
| 1099 18th Street Suite 2950 Denver, CO 80202 |
Matures June 2009 Interest rate 11.50% |
3.35 | % | 2,309,476 | 2,309,476 | ||||||||
| Preferred Stock Warrants | 51,801 | 157,848 | |||||||||||
| Total Ping Identity Corporation |
2,361,277 | 2,467,324 | |||||||||||
| Rivulet Communications, Inc. (1.30%)(4) |
Communications & Networking | Senior Debt | |||||||||||
| 75 Rochester Avenue Portsmouth, NH 03801 |
Matures September 2009 Interest rate 10.60% |
3,463,969 | 3,463,969 | ||||||||||
| Preferred Stock Warrants | 2.59 | % | 50,710 | 37,876 | |||||||||
| Rivulet Communications, Inc. (0.09%) |
Preferred Series A Stock | 2.31 | % | 250,000 | 250,000 | ||||||||
| Total Rivulet Communications, Inc. |
3,764,679 | 3,751,845 | |||||||||||
| Simpler Networks Corp. (1.98%)(4) |
Communications & Networking | Senior Debt | |||||||||||
| 90 Washington Valley Road Bedminster, NJ 07921 |
Matures July 2009 Interest rate 11.75% |
4,606,291 | 4,606,291 | ||||||||||
| Preferred Stock Warrants | 5.90 | % | 160,241 | 733,919 | |||||||||
| Simpler Networks Corp. (0.19%) |
Preferred Series C Stock | 1.96 | % | 500,000 | 500,000 | ||||||||
| Total Simpler Networks Corp. |
5,266,532 | 5,840,210 | |||||||||||
| Wireless Channels, Inc (4.63%)(4) |
Communications & Networking | Senior Debt | |||||||||||
| 7101 S. Fulton St. #200 Centenial, CO 80112 |
Matures April 2010 Interest rate 9.25% |
2,348,971 | 2,348,971 | ||||||||||
| Subordinated Debt | |||||||||||||
| Matures April 2010 Interest rate Prime + 4.25% |
10,000,000 | 10,000,000 | |||||||||||
| Preferred Series A Stock | 4.47 | % | 155,139 | 158,872 | |||||||||
| Total Wireless Channels, Inc. |
12,504,110 | 12,507,843 | |||||||||||
| Total Communications & Networking (19.95%) |
53,225,603 | 53,778,895 | |||||||||||
| Atrenta, Inc. (1.82%)(4) |
Software | Senior Debt | |||||||||||
| 2077 Gateway Place Suite 300 San Jose, CA 95110 |
Matures June 2009 Interest rate 11.50% |
4,643,687 | 4,643,687 | ||||||||||
| Preferred Stock Warrants | 5.40 | % | 102,396 | 194,647 | |||||||||
| Preferred Stock Warrants | 1.77 | % | 33,760 | 63,869 | |||||||||
| Atrenta, Inc. (0.09%) |
Preferred Series C Stock | 1.56 | % | 250,000 | 250,000 | ||||||||
| Total Atrenta, Inc. |
5,029,843 | 5,152,203 | |||||||||||
| Blurb, Inc. (0.09%) |
Software | Senior Debt | |||||||||||
| 580 California St Suite 300 San Francisco, CA 94104 |
Matures December 2009 Interest rate 9.55% |
238,530 | 238,530 | ||||||||||
| Preferred Stock Warrants | 0.62 | % | 12,904 | 12,034 | |||||||||
| Total Blurb, Inc. |
251,434 | 250,564 | |||||||||||
| Compete, Inc. (1.31%)(4) |
Software | Senior Debt | |||||||||||
| 4 Copley Place Suite 700 Boston, MA |
Matures March 2009 Interest rate Prime + 3.50% |
3,490,402 | 3,490,402 | ||||||||||
| Preferred Stock Warrants | 2.67 | % | 62,067 | 46,064 | |||||||||
64
| Portfolio Company |
Industry |
Type of Investment(1) |
Percentage of Class Held on a Fully Diluted Basis(6)(7) |
Cost(2) | Value(3) | ||||||||
| Total Compete, Inc. |
$ | 3,552,469 | $ | 3,536,466 | |||||||||
| Forescout Technologies, Inc. (1.11%) |
Software | Senior Debt | |||||||||||
| 10001 De Anza Blvd., Suite 220 Cupertino, CA 95014 |
Matures August 2009 Interest rate 11.15% |
2,455,217 | 2,455,217 | ||||||||||
| Revolving Line of Credit | |||||||||||||
| Matures August 2007 Interest rate Prime + 1.49% |
500,000 | 500,000 | |||||||||||
| Preferred Stock Warrants | 3.06 | % | 55,593 | 48,020 | |||||||||
| Total Forescout Technologies, Inc. |
3,010,810 | 3,003,237 | |||||||||||
| GameLogic, Inc. (1.11%)(4) |
Software | Senior Debt | |||||||||||
| 139 Main Street 5th Floor Boston, MA 02142 |
Matures December 2009 Interest rate Prime + 4.125% |
2,961,173 | 2,961,173 | ||||||||||
| Preferred Stock Warrants | 1.54 | % | 52,604 | 39,291 | |||||||||
| Total GameLogic, Inc. |
3,013,777 | 3,000,464 | |||||||||||
| Gomez, Inc. (0.35%)(4) |
Software | Senior Debt | |||||||||||
| 610 Lincoln Street Waltham, MA 02451 |
Matures December 2007 Interest rate 12.25% |
938,525 | 938,525 | ||||||||||
| Preferred Stock Warrants | 4.35 | % | 35,000 | 14,466 | |||||||||
| Total Gomez, Inc. |
973,525 | 952,991 | |||||||||||
| HighRoads, Inc. (0.65%)(4) |
Software | Senior Debt | |||||||||||
| 150 Presidential Way Woburn, MA 01801 |
Matures February 2009 Interest rate 11.65% |
1,723,912 | 1,723,912 | ||||||||||
| Preferred Stock Warrants | 3.18 | % | 44,466 | 33,159 | |||||||||
| Total HighRoads, Inc. |
1,768,378 | 1,757,071 | |||||||||||
| Intelliden, Inc. (1.11%) |
Software | Senior Debt | |||||||||||
| 90 South Cascade Avenue Colorado Springs, CO 80903 |
Matures February 2010 Interest rate 13.20% |
2,985,453 | 2,985,453 | ||||||||||
| Preferred Stock Warrants | 0.94 | % | 17,542 | 15,796 | |||||||||
| Total Intelliden, Inc. |
3,002,995 | 3,001,249 | |||||||||||
| Inxight Software, Inc. (1.39%)(4) |
Software | Senior Debt | |||||||||||
| 500 Macara Avenue Sunnyvale, CA 94085 |
Matures February 2008 Interest rate 10.00% |
3,729,819 | 3,729,819 | ||||||||||
| Preferred Stock Warrants | 1.20 | % | 55,963 | 24,430 | |||||||||
| Total Inxight Software, Inc. |
3,785,782 | 3,754,249 | |||||||||||
| Oatsystems, Inc. (2.17%)(4) |
Software | Senior Debt | |||||||||||
| 265 Winter St. Waltham, MA 02451 |
Matures September 2009 Interest rate 11.00% |
5,771,694 | 5,771,694 | ||||||||||
| Preferred Stock Warrants | 5.45 | % | 67,484 | 50,437 | |||||||||
| Total Oatsystems, Inc. |
5,839,178 | 5,822,131 | |||||||||||
| Proficiency, Inc. (1.51%)(5) |
Software | Senior Debt | |||||||||||
| 880 Winter Street, Suite 320 Waltham, MA 02415 |
Matures July 2008 |
3,960,318 | 3,960,318 | ||||||||||
| Preferred Stock Warrants | 9.27 | % | 96,370 | 106,725 | |||||||||
| Total Proficiency, Inc. |
4,056,688 | 4,067,043 | |||||||||||
| PSS Systems, Inc. (0.13%) |
Software | Senior Debt | |||||||||||
| 2471 East Bayshore Road, Suite 600 Palo Alto, CA 94303 |
Matures March 2010 |
300,217 | 300,217 | ||||||||||
| Preferred Stock Warrants | 1.48 | % | 51,205 | 53,257 | |||||||||
| Total PSS Systems, Inc. |
351,422 | 353,474 | |||||||||||
| Savvion, Inc. (1.84%)(4) |
Software | Senior Debt | |||||||||||
| 5104 Old Ironsides Drive, Suite 205 Santa Clara, CA 95054 |
Matures March 2009 |
1,899,414 | 1,899,414 | ||||||||||
| Revolving Line of Credit | |||||||||||||
| Matures March 2007 |
3,000,000 | 3,000,000 | |||||||||||
| Preferred Stock Warrants | 5.59 | % | 52,135 | 39,070 | |||||||||
| Total Savvion, Inc. |
4,951,549 | 4,938,484 | |||||||||||
| Sportvision, Inc. (0.01%) |
Software | Preferred Stock Warrants | 1.89 | % | 39,339 | 26,992 | |||||||
| 4619 N. Ravenswood Chicago, IL 60640 |
|||||||||||||
| Total Sportvision, Inc. |
39,339 | 26,992 | |||||||||||
65
| Portfolio Company |
Industry |
Type of Investment(1) |
Percentage of Class Held on a Fully Diluted Basis(6)(7) |
Cost(2) | Value(3) | ||||||||
| Talisma Corp. (0.55%)(4) 10900 N.E. 4th Street, Suite 1510 Bellevue, WA 98004-5841 |
Software | Subordinated Debt Matures December 2007 Interest rate 11.25% |
$ | 1,451,072 | $ | 1,451,072 | |||||||
| Preferred Stock Warrants | 1.47 | % | 49,000 | 19,430 | |||||||||
| Total Talisma Corp. |
1,500,072 | 1,470,502 | |||||||||||
| Total Software (15.24%) |
41,127,261 | 41,087,120 | |||||||||||
| Agami Systems, Inc. (2.60%)(4) 1269 Innsbruck Drive Sunnyvale, CA 94089 |
Electronics & Computer Hardware | Senior Debt Matures August
2009 |
6,931,616 | 6,931,616 | |||||||||
| Preferred Stock Warrants | 1.88 | % | 85,601 | 74,782 | |||||||||
| Total Agami Systems, Inc. |
7,017,217 | 7,006,398 | |||||||||||
| Cornice, Inc. (0.99%)(4) 1951 S. Fordham Street Suite 105 Longmont, CO 80503 |
Electronics & Computer Hardware | Senior Debt Matures November 2008 Interest rate Prime + 4.50% |
2,680,376 | 2,680,376 | |||||||||
| Preferred Stock Warrants | 3.15 | % | 101,597 | — | |||||||||
| Preferred Stock Warrants | 9.08 | % | 35,353 | — | |||||||||
| Preferred Stock Warrants | 12.11 | % | 135,403 | — | |||||||||
| Total Cornice, Inc. |
2,952,729 | 2,680,376 | |||||||||||
| Luminus Devices, Inc. (5.41%)(4) 175 New Boston Street Suite A Woburn, MA 01801 |
Electronics & Computer Hardware | Senior Debt Matures August
2009 |
14,346,470 | 14,346,470 | |||||||||
| Preferred Stock Warrants | 0.43 | % | 183,290 | 141,418 | |||||||||
| Preferred Stock Warrants | 0.21 | % | 83,529 | 79,349 | |||||||||
| Total Luminus Devices, Inc. |
14,613,289 | 14,567,237 | |||||||||||
| NeoScale Systems, Inc. (1.11%)(4) 1655 McCarthy Blvd. Milpitas, CA 95035-7415 |
Electronics & Computer Hardware | Senior Debt Matures
October 2009 |
2,980,339 | 2,980,339 | |||||||||
| Preferred Stock Warrants | 1.38 | % | 23,593 | 21,329 | |||||||||
| Total NeoScale Systems, Inc. |
3,003,932 | 3,001,668 | |||||||||||
| Sling Media, Inc. (0.53%) 901 Mariners Island Blvd, Suite 300 San Mateo, CA 94404 |
Electronics & Computer Hardware | Preferred Stock Warrants Preferred Series B Stock |
2.36 1.07 |
% % |
|
38,968 500,000 |
|
933,910 500,000 | |||||
| Total Sling Media, Inc. |
538,968 | 1,433,910 | |||||||||||
| ViDeOnline Communications, Inc. (0.11%)(4) 656 Bair Island Road, Suite 108 Redwood City, CA 94063 |
Electronics & Computer Hardware | Preferred Series C Stock | 2.62 | % | — | 296,474 | |||||||
| Total ViDeOnline Communications, Inc. |
— | 296,474 | |||||||||||
| Total Electronics & Computer Hardware (10.75%) |
28,126,135 | 28,986,063 | |||||||||||
| Quatrx Pharmaceuticals Company (6.55%)(4) 777 East Eisenhower Pkwy Suite 100 Ann Arbor, MI 48108 |
Specialty Pharmaceuticals | Senior Debt Matures
January 2010 |
17,484,205 | 17,484,205 | |||||||||
| Preferred Stock Warrants | 2.89 | % | 220,354 | 167,782 | |||||||||
| Total Quatrx Pharmaceuticals Company |
17,704,559 | 17,651,987 | |||||||||||
| Aegerion Pharmaceuticals, Inc (3.71%)(4) 1140 Route 22 East, Suite 304 Bridgewater, NJ 08807 |
Specialty Pharmaceuticals | Senior Debt Matures August
2010 |
9,931,806 | 9,931,806 | |||||||||
| Preferred Stock Warrants | 0.58 | % | 69,207 | 70,795 | |||||||||
| Total Aegerion Pharmaceuticals, Inc. |
10,001,013 | 10,002,601 | |||||||||||
| Total Special Pharmaceuticals (10.26%) |
27,705,572 | 27,654,588 | |||||||||||
| BabyUniverse, Inc. (1.88%)(4) 150 South US Highway One, Ste 500 Jupiter, FL 33477 |
Consumer & Business Products | Senior Debt Matures July
2009 |
4,756,082 | 4,756,082 | |||||||||
| Common Stock Warrants | 1.59 | % | 325,224 | 308,431 | |||||||||
| Total BabyUniverse, Inc. |
5,081,306 | 5,064,513 | |||||||||||
66
| Portfolio Company |
Industry |
Type of Investment(1) |
Percentage of Class Held on a Fully Diluted Basis(6)(7) |
Cost(2) | Value(3) | ||||||||
| Market Force Information, Inc. (0.66%)(4) |
Consumer & Business Products | Senior Debt | |||||||||||
| 1877 Broadway, Suite 200 Boulder, CO 80302 |
Matures May 2009 |
$ | 1,644,701 | $ | 1,644,701 | ||||||||
| Preferred Stock Warrants | 1.21 | % | 23,823 | 143,058 | |||||||||
| Market Force Information, Inc. (0.19%) |
Preferred Stock | 1.57 | % | 500,000 | 500,000 | ||||||||
| Total Market Force Information, Inc. |
2,168,524 | 2,287,759 | |||||||||||
| Wageworks, Inc. (5.13%)(4) |
Consumer & Business Products | Senior Debt | |||||||||||
| 1100 Park Place 4th Floor San Mateo, CA 94403 |
Matures November 2008 Interest rate Prime + 4.00% |
12,697,244 | 12,697,244 | ||||||||||
| Preferred Stock Warrants | 6.72 | % | 251,964 | 1,123,874 | |||||||||
| Wageworks, Inc. (0.09%) |
Preferred Series C Stock | 1.64 | % | 249,995 | 249,995 | ||||||||
| Total Wageworks, Inc. |
13,199,203 | 14,071,113 | |||||||||||
| Total Consumer & Business Products (7.95%) |
20,449,033 | 21,423,385 | |||||||||||
| Ageia Technologies, Inc. (2.44%)(4) |
Semiconductors | Senior Debt | |||||||||||
| 82 Pioneer Way, Suite 118 Mountain View, CA 94041 |
Matures August 2008 |
6,475,603 | 6,475,603 | ||||||||||
| Convertible Debt | 43,316 | 43,316 | |||||||||||
| Preferred Stock Warrants | 2.44 | % | 99,190 | 67,663 | |||||||||
| Ageia Technologies, Inc. (0.19%) |
Preferred Series C Stock | 1.95 | % | 500,000 | 500,000 | ||||||||
| Total Ageia Technologies |
7,118,109 | 7,086,582 | |||||||||||
| Cradle Technologies (0.02%) |
Semiconductors | Preferred Stock Warrants | 0.31 | % | 79,150 | 59,303 | |||||||
| 1197 Borregas Avenue Sunnyvale, CA 94089 |
|||||||||||||
| Total Cradle Technologies |
79,150 | 59,303 | |||||||||||
| iWatt Inc. (1.50%)(4) |
Semiconductors | Senior Debt | |||||||||||
| 90 Albright Way Los Gatos, CA 95032-1827 |
Matures September 2009 Interest rate Prime + 2.75% |
1,963,453 | 1,963,453 | ||||||||||
| Revolving Line of Credit | |||||||||||||
| Matures September 2007 |
2,035,000 | 2,035,000 | |||||||||||
| Preferred Stock Warrants | 0.99 | % | 45,684 | 39,180 | |||||||||
| Total iWatt Inc. |
4,044,137 | 4,037,633 | |||||||||||
| NEXX Systems, Inc. (2.60%)(4) |
Semiconductors | Senior Debt | |||||||||||
| Five Suburban Park Drive Billerica, MA 01821-3904 |
Matures February 2010 Interest rate Prime + 2.75% |
4,925,409 | 4,925,409 | ||||||||||
| Revolving Line of Credit | |||||||||||||
| Matures December 2009 |
2,000,000 | 2,000,000 | |||||||||||
| Preferred Stock Warrants | 4.77 | % | 83,116 | 79,800 | |||||||||
| Total NEXX Systems, Inc. |
7,008,525 | 7,005,209 | |||||||||||
| Total Semiconductors (6.75%) |
18,249,921 | 18,188,727 | |||||||||||
| Labopharm USA, Inc. (2.09%)(4)(5) |
Drug Delivery | Senior Debt | |||||||||||
| 480 Armand-Frappier Blvd. Laval, Canada H7V 4B4 |
Matures July 2008 |
5,638,468 | 5,638,468 | ||||||||||
| Total Labopharm USA, Inc. |
5,638,468 | 5,638,468 | |||||||||||
| TransOral Pharmaceuticals, Inc. (3.60%)(4) |
Drug Delivery | Senior Debt | |||||||||||
| 300 Tamal Plaza Suite 220 Corte Madera, CA 94925 |
Matures October 2009 |
9,399,755 | 9,399,755 | ||||||||||
| Preferred Stock Warrants | 0.85 | % | 35,630 | 122,134 | |||||||||
| Preferred Stock Warrants | 1.27 | % | 51,067 | 191,549 | |||||||||
| TrasnOral Pharmaceuticals, Inc. (0.19%) |
Preferred Stock | 1.25 | % | 500,000 | 500,000 | ||||||||
| Total TransOral Pharmaceuticals, Inc. |
9,986,452 | 10,213,438 | |||||||||||
| Total Drug Delivery (5.88%) |
15,624,920 | 15,851,906 | |||||||||||
| BARRX Medical, Inc. (0.56%) |
Therapeutic | ||||||||||||
| 1334 Bordeaux Drive Sunnyvale, CA 94089 |
Preferred Stock |
5.39 | % | 1,500,000 | 1,500,000 | ||||||||
| Total BARRX Medical, Inc. |
1,500,000 | 1,500,000 | |||||||||||
67
| Portfolio Company |
Industry |
Type of Investment(1) |
Percentage of Class Held on a Fully Diluted Basis(6)(7) |
Cost(2) | Value(3) | ||||||||
| Gynesonics, Inc. (0.76%) |
Therapeutic | Senior Debt | |||||||||||
| 604 5th Ave Suite D Redwood City, CA 94063 |
Matures October 2009 |
$ | 1,987,462 | $ | 1,987,462 | ||||||||
| Preferred Stock Warrants | 2.48 | % | 17,552 | 53,842 | |||||||||
| Gynesonics, Inc. (0.09%) |
Preferred Stock | 1.65 | % | 250,000 | 250,000 | ||||||||
| Total Gynesonics, Inc. |
2,255,014 | 2,291,304 | |||||||||||
| Novasys Medical, Inc. (2.96%)(4) |
Therapeutic | Senior Debt | |||||||||||
| 39684 Eureka Drive Newark, CA 94560 |
Matures January 2010 |
8,000,000 | 8,000,000 | ||||||||||
| Total Novasys Medical, Inc. |
8,000,000 | 8,000,000 | |||||||||||
| Power Medical Interventions, Inc. (0.01%) |
Therapeutic | ||||||||||||
| 2021 Cabot Blvd West Langhorne, PA 19047 |
Common Stock Warrants |
0.39 | % | 20,687 | 28,786 | ||||||||
| Total Power Medical Interventions, Inc. |
20,687 | 28,786 | |||||||||||
| Total Therapeutic (4.38%) |
11,775,701 | 11,820,090 | |||||||||||
| Hedgestreet, Inc. (1.41%)(4) |
Internet Consumer | Senior Debt | |||||||||||
| 1825 S. Grant, Suite 500 San Mateo, CA 94402 |
& Business Services | Matures March 2009 |
3,769,878 | 3,769,878 | |||||||||
| Preferred Stock Warrants | 2.08 | % | 54,956 | 41,866 | |||||||||
| Total Hedgestreet, Inc. |
3,824,834 | 3,811,744 | |||||||||||
| Invoke Solutions, Inc. (0.82%)(4) |
Internet Consumer | Senior Debt | |||||||||||
| 375 Totten Pond Road Suite 400 Waltham, MA 02451 |
& Business Services | Matures December 2008 Interest rate 11.25% |
2,162,886 | 2,162,886 | |||||||||
| Preferred Stock Warrants | 4.06 | % | 43,826 | 33,322 | |||||||||
| Total Invoke Solutions, Inc. |
2,206,712 | 2,196,208 | |||||||||||
| RazorGator Interactive Group, Inc. (1.11%)(4) |
Internet Consumer | Senior Debt | |||||||||||
| 11150 Santa Monica Blvd., Suite 500 Los Angeles, CA 90025 |
& Business Services | Matures January 2008 |
2,392,871 | 2,392,871 | |||||||||
| Preferred Stock Warrants | 2.80 | % | 13,050 | 561,742 | |||||||||
| Preferred Series B Warrants | 0.70 | % | 28,478 | 26,161 | |||||||||
| RazorGator Interactive Group, Inc. (0.63%) |
Preferred Series A Stock | 3.74 | % | 1,000,000 | 1,708,178 | ||||||||
| Total RazorGator Interactive Group, Inc. |
3,434,399 | 4,688,952 | |||||||||||
| Total Internet Consumer & Business Services (3.97%) |
|
9,465,945 | 10,696,904 | ||||||||||
| Lilliputian Systems, Inc. (3.15%)(4) |
Energy | Senior Debt | |||||||||||
| 36 Jonspin Road Wilmington, MA 01887 |
Matures March 2010 |
8,466,078 | 8,466,078 | ||||||||||
| Preferred Stock Warrants | 0.96 | % | 48,460 | 36,946 | |||||||||
| Total Lilliputian Systems, Inc. |
8,514,538 | 8,503,024 | |||||||||||
| Total Energy (3.15%) |
|
8,514,538 | 8,503,024 | ||||||||||
| Active Response Group, Inc. (2.41%) |
Information | Senior Debt | |||||||||||
| 900 Broadway, 2nd Floor New York, NY 10003-1210 |
Services | Matures March 2012 |
6,454,684 | 6,454,684 | |||||||||
| Common Stock Warrants | 3.00 | % | 46,084 | 47,178 | |||||||||
| Total Active Response Group, Inc. |
6,500,768 | 6,501,862 | |||||||||||
| Buzznet, Inc. (0.09%) |
Information | Senior Debt | |||||||||||
| 2404 Wilshire Blvd. #11b Los Angeles, CA 90057 |
Services | Matures March 2010 |
241,626 | 241,626 | |||||||||
| Preferred Stock Warrants | 0.86 | % | 8,613 | 8,843 | |||||||||
| Total Buzznet, Inc. |
250,239 | 250,469 | |||||||||||
| Solutionary, Inc. (0.04%) |
Information | ||||||||||||
| 9420 Underwood Avenue, 3rd Floor Omaha, NE 68114 |
Services | Preferred Stock Warrants | 2.00 | % | 93,827 | 96,055 | |||||||
| Total Solutionary, Inc. |
93,827 | 96,055 | |||||||||||
68
| Portfolio Company |
Industry |
Type of Investment(1) |
Percentage of Class Held on a Fully Diluted Basis(6)(7) |
Cost(2) | Value(3) | ||||||||
| Wallop Technologies, Inc. (0.09%) |
Information | Senior Debt | |||||||||||
| 333 Bryant Street San Francisco, CA 94107 |
Services | Matures March 2010 |
$ | 229,942 | $ | 229,942 | |||||||
| Preferred Stock Warrants | 0.45 | % | 7,473 | 7,650 | |||||||||
| Total Wallop Technologies, Inc. |
237,415 | 237,592 | |||||||||||
| Total Information Services (2.63%) |
|
7,082,249 | 7,085,978 | ||||||||||
| Optiscan Biomedical, Corp. (0.31.%)(4) |
Diagnostic | Senior Debt | |||||||||||
| 1105 Atlantic Ave, Suite 101 Alameda, CA 94501 |
Matures March 2008 |
784,135 | 784,135 | ||||||||||
| Preferred Stock Warrants | 1.50 | % | 80,486 | 59,548 | |||||||||
| Optiscan Biomedical, Corp. (0.37%) |
Preferred Series B Stock | 2.70 | % | 1,000,000 | 1,000,000 | ||||||||
| Total Optiscan Biomedical, Corp. |
1,864,621 | 1,843,683 | |||||||||||
| Xillix Technologies Corp. (1.41%)(4)(5) |
Diagnostic | Senior Debt | |||||||||||
| 100– 13775 Commerce Parkway Richmond, British Columbia, Canada V6V 2V4 |
Matures December 2008 Interest rate 12.40% Common Stock Warrants |
1.92 | % | |
3,801,585 313,108 |
|
3,801,585 — | ||||||
| Total Xillix Technologies Corp. |
4,114,693 | 3,801,585 | |||||||||||
| Total Diagnostic (2.09%) |
|
5,979,314 | 5,645,268 | ||||||||||
| Guava Technologies, Inc. (1.80%)(4) |
Biotechnology | Senior Debt | |||||||||||
| 25801 Industrial Boulevard Hayward, CA 94545-2991 |
Tools | Matures July 2009 |
4,781,887 | 4,781,887 | |||||||||
| Preferred Stock Warrants | 8.24 | % | 105,399 | 78,193 | |||||||||
| Total Guava Technologies, Inc. |
4,887,286 | 4,860,080 | |||||||||||
| NuGEN Technologies, Inc. (0.02%) |
Biotechnology | ||||||||||||
| 821 Industrial Road, Unit A San Carlos, CA 94070 |
Tools | Preferred Stock Warrants | 3.37 | % | 44,837 | 45,902 | |||||||
| Total NuGEN Technologies, Inc. |
44,837 | 45,902 | |||||||||||
| Total Biotechnology Tools (1.82%) |
|
4,932,123 | 4,905,982 | ||||||||||
| Waterfront Media, Inc. (1.11) |
Media/Content/ | Senior Debt | |||||||||||
| 300 Tamal Plaza Suite 220 Corte Madera, CA 94925 |
Info | Matures December 2010 Interest rate Prime + 3.00% |
941,994 | 941,994 | |||||||||
| Revolving line credit | |||||||||||||
| Matures March 2008 |
2,000,000 | 2,000,000 | |||||||||||
| Preferred Stock Warrants | 5.66 | % | 59,663 | 60,939 | |||||||||
| Total Waterfront Media, Inc. |
3,001,657 | 3,002,933 | |||||||||||
| Total Media/Contents/Info (1.11%) |
|
3,001,657 | 3,002,933 | ||||||||||
| Total Investments (127.03%) |
|
$ | 338,325,156 | $ | 342,483,418 | ||||||||
| * | Value as a percent of net assets |
| (1) | Preferred and common stock, warrants, and equity interests are generally non-income producing. |
| (2) | Gross unrealized appreciation, gross unrealized depreciation, and net appreciation totaled $5,745,612, $1,587,350 and $4,158,262, respectively. |
| (3) | Except for warrants in four publicly traded companies, all investments are restricted at March 31, 2007 and were valued at fair value as determined in good faith by the Board of Directors. No unrestricted securities of the same issuer are outstanding. The Company uses the Standard Industrial Code for classifying the industry grouping of its portfolio companies. |
| (4) | Debt and warrant investments of this portfolio company have been pledged as collateral under the Citigroup Facility. Citigroup has an equity participation right on loans collateralized under the Citigroup Facility. The value of their participation right on unrealized gains in the related equity investments was approximately $448,000 at March 31, 2007 and is included in accrued liabilities and reduces the unrealized gain recognized by the Company at March 31, 2007. |
| (5) | Non-U.S. company or the company's principal place of business is outside the United States. |
| (6) | All investments are less than 5% owned. |
| (7) | The “percentage of class held on a fully diluted basis” represents the percentage of the class of security we may own assuming we exercise our warrants or options (whether or not they are in-the-money) and assuming that warrants, options or convertible securities held by others are not exercised or converted. We have not included any security which is subject to significant vesting contingencies. Common stock, preferred stock, warrants, options and equity interests are generally non-income producing and restricted. The percentage was calculated based on the most current outstanding share information available to us (1) in the case of private companies, provided by that company, and (2) in the case of public companies, provided by that company’s most recent public filings with the SEC. |
69
Portfolio Company Descriptions
Acceleron Pharmaceuticals, Inc.
Acceleron Pharmaceuticals focuses on developing therapeutics for metabolic and musculoskeletal diseases.
Active Response Group, Inc.
Active Response provides targeted, qualified leads to clients from individuals who indicate interest or “opt-in” to receive marketing information. They are also a provider of display advertising and behavioral marketing.
Aegerion Pharmaceuticals, Inc.
Aegerion Pharmaceuticals is a privately held specialty pharmaceutical company focused on the development and commercialization of promising pharmaceuticals to treat cardiovascular and metabolic disease.
Agami Systems, Inc.
Agami is a provider of adaptive storage management solutions to the enterprise market. The company develops enterprise network storage systems for high-end storage area networks (SAN) and network-attached storage (NAS) management.
Ageia Technologies
Ageia Technologies is a developer of technology to enhance interactive media playback. The company develops chips for processing three dimensional visual data for applications such as computer simulation, gaming, and security.
Atrenta, Inc.
Atrenta Inc. is a provider of development solutions that seek to turn chip, system and software development into more predictable and controllable processes for the electronic systems industry.
Aveo Pharmaceuticals, Inc.
AVEO is a biopharmaceutical company focused on the discovery and development of novel cancer therapeutics.
BabyUniverse, Inc.
BabyUniverse is an online retailer and content publisher in the pregnancy, baby and toddler marketplace.
Barrx Medical, Inc.
Barrx is a medical device company that develops treatment solutions for Barrett’s esophagus.
Blurb, Inc.
Blurb provides a service that allows individuals to publish books using professional authoring templates plus a print-on-demand engine, a community content library and an online marketplace.
Buzznet, Inc.
Buzznet is a photoblog community site that provides members and viewers updated information about music and pop culture.
70
Compete, Inc.
Compete extends online market research to seek to transform the way consumers and brands communicate. By combining permission marketing, predictive analytics and a consumer behavior database, Compete helps marketers identify and reach their target consumers.
Cornice, Inc.
Cornice seeks to provide compact, low-cost, high-capacity storage for a variety of pocket-able consumer electronic devices, including mobile phones, MP3 players, personal video recorders, GPS devices and portable storage products.
Cradle Technologies
Cradle Technologies is a semiconductor company developing specialized digital signal processing technology for multimedia applications.
Elixir Pharmaceuticals, Inc.
Elixir is a biopharmaceutical company utilizing aging research to develop pharmaceuticals that treat and/or prevent metabolic disease such as obesity and diabetes.
Epicept Corporation
Epicept is a pharmaceutical company focused on the development and commercialization of topically-delivered prescription pain management therapeutics.
ForeScout Technologies, Inc.
ForeScout is a provider of clientless network access control (NAC) solutions that enable customers to gain complete control over network security without disrupting end-user productivity.
GameLogic, Inc.
GameLogic is a provider of next generation games, gaming systems, and platforms for casinos and lotteries. The company provides large-scale interactive games and game technology for distribution on a variety of digital media.
Gomez, Inc.
Gomez supplies enterprise solutions that help companies achieve and maintain the performance of their mission-critical Internet applications. Gomez provides performance measurement, benchmarking and competitive analysis to companies across all industry segments, including financial services, e-commerce, information technology and travel.
Guava Technologies, Inc.
Guava Technologies is a biotechnology company that develops, manufactures and markets cellular analysis systems for the life science research marketplace.
Gynesonics, Inc.
Gynesonics is a development stage company focusing on minimally invasive devices for women’s health.
HedgeStreet, Inc.
HedgeStreet is an Internet-based, government regulated market where traders can hedge against or speculate on economic events and price movements.
71
High Roads, Inc.
HighRoads provides technology-based solutions and services to provide visibility and enable collaboration throughout the design, procurement, management and communication of employee benefits plans.
Ikano Communications, Inc.
Ikano Communications partners with Internet Service Providers to help such providers in reducing operating costs, increasing revenues and expanding geographic reach and product offerings.
Intelliden, Inc.
Intelliden offers Intelligent Networking software solutions for network-driven organizations to control, manage and scale their networks.
Interwise, Inc.
Interwise, Inc. is a provider of an integrated data, video, and voice conferencing solution for delivering realtime multimedia communications across the extended enterprise. The solution combines voice, rich interactive content, and streaming video in a single platform to support a customer’s e-learning.
Invoke Solutions, Inc.
Invoke Solutions develops and provides real-time research technologies that seek to help businesses gain instant insight into the opinions, views, and dynamics of their customers, employees, and other constituents.
Inxight Software, Inc.
Inxight is a provider of software solutions that enables customers to discover, retrieve, and collect information contained in unstructured data sources in a number of languages.
iWatt, Inc.
iWatt is a power management IC company that designs, develops and markets semiconductors for computer, communications and industrial markets.
Labopharm USA, Inc.
Labopharm seeks to develop improved formulations of currently marketed drugs using its advanced, proprietary controlled-release drug delivery technologies. Labopharm seeks to develop and commercialize new value-added formulations of existing products that address the market’s preference for drugs that offer simplified dosing regimens, improved efficacy or a reduced side effect profile.
Lilliputian Systems, Inc.
Lilliputian Systems, Inc. is developing a next generation micro fuel cell system for portable electronics and wireless applications.
Luminus Devices, Inc.
Luminus Devices, Inc., develops and manufactures high performance solid state light emitting devices. PhlatLight (Photonic Lattice) technology, developed by Luminus Devices based on research done at MIT, is a solid state light source that provides enough brightness to illuminate large screen projection televisions. With PhlatLight chipsets in commercial production, Luminus provides a light source for a variety of applications, including projection TVs and other advanced, high-definition displays. Luminus recently began shipping its products to customers and is dependent on a small number of customers the loss of which could have a material adverse effect on its business.
Market Force Information, Inc.
Market Force is an emerging provider of store-level, customer experience information for retailers, restaurants, consumer packaged goods companies and the financial and hospitality communities.
72
Memory Pharmaceuticals Corp.
Memory Pharmaceuticals Corp., a biopharmaceutical company, is focused on developing innovative drugs for the treatment of debilitating central nervous system disorders such as Alzheimer’s disease, depression, schizophrenia, vascular dementia, Mild Cognitive Impairment, and memory impairments associated with aging.
Merrimack Pharmaceuticals, Inc.
Merrimack Pharmaceuticals is a drug discovery and clinical development company that has developed a proprietary drug discovery platform. Its clinical programs are focused on developing drugs in the fields of autoimmune disease and cancer.
NeoScale Systems, Inc.
NeoScale is a provider of storage security, enabling enterprise customers to achieve data privacy with the lowest operational impact and at the lowest total cost.
NEXX Systems, Inc.
Nexx is a provider of processing equipment for advance wager level packaging applications.
Novasys Medical, Inc.
Novasys is a medical company dedicated to the development of innovative therapies in women’s health.
NuGEN Technologies, Inc.
NuGEN is dedicated to the development and commercialization of high sensitivity nucleic acid amplification and detection technologies. These technologies form the foundation for a range of products used by researchers to prepare samples for genetic analysis.
OATSystems, Inc.
OATSystems is a developer of radio-frequency identification (RFID) framework software and services that provide solutions to centrally manage and control RFID for retail, consumer packaged goods and pharmaceutical companies.
OptiScan Biomedical Corporation
OptiScan Biomedical Corporation is developing a non-invasive blood glucose monitor utilizing proprietary infrared technology.
Paratek Pharmaceuticals, Inc.
Paratek is developing new therapeutics for the infectious disease market to combat the problem of antibiotic resistance.
Pathfire, Inc.
Pathfire provides digital content distribution and management solutions for the broadcast, media and entertainment industries and seeks to supply innovative digital solutions, from distribution to air, for broadcasters, news organizations, television networks, Hollywood studios and other media companies.
Ping Identity Corporation
Ping Identity Corporation provides federated identity solutions for web single sign-on and identity-enabled web services. Ping’s software seek to allow organizations to securely share identity information across security boundaries.
Portola Pharmaceuticals
Portola is a biopharmaceutical company focused on the discovery and development of novel therapeutics for the treatment and prevention of severe cardiovascular diseases.
73
Power Medical Interventions, Inc.
Power Medical seeks to combine computer-mediated technology with minimally invasive surgical techniques to create next-generation surgical staplers.
Proficiency, Inc.
Proficiency is delivering technology and products that make design intelligence portable and that increase the efficiency of product development processes. Proficiency supplies feature-based design interoperability and feature-based design data exchange solutions.
PSS Systems, Inc.
PSS Systems is a developer of automated records and information lifecycle management solutions.
QuatRx Pharmaceuticals Company
QuatRx Pharmaceuticals Company is a pharmaceutical company focused on discovering, licensing, developing and commercializing compounds in the endocrine, metabolic and cardiovascular therapeutic areas.
RazorGator, Inc.
RazorGator is an Internet-based ticket sales company focusing on sold-out or hard-to-find tickets for sporting events, concerts and theatrical productions. RazorGator also operates an electronic broker trading and clearing platform for the resale of tickets.
Rivulet Communications, Inc.
Rivulet develops technology that enables IP networks to carry all kinds of real-time and other delivery-critical traffic. Rivulet’s sophisticated suite of algorithms guarantee real-time delivery of packets with zero packet loss due to router queue overflow.
Savvion, Inc.
Savvion develops software focused on helping businesses control and improve operations performed by their people and software systems.
Simpler Networks Corp
Simpler Networks seeks to engineer network solutions for local service providers to help them reduce their operational costs by automating labor-intensive processes at the distribution frame.
Sirtris Pharmaceuticals, Inc.
Sirtris is a biopharmaceutical company developing and commercializing novel therapeutics that modulate sirtuins, a recently discovered family of enzymes that promotes the body’s natural defense against disease. Also known as class III histone deacetylases (HDACs), sirtuins are attractive drug targets for diseases of aging, including metabolic and neurological diseases.
Sling Media, Inc.
Sling Media is a provider of consumer electronics for the digital media consumers. The company’s solutions aim to enhance existing products and standards with hardware and software that will improve consumers’ usage experience. The first member of the Sling Media family is the Slingbox™, a device that allows consumers to access their living room television experience at any time, from any location.
74
Solutionary, Inc.
Solutionary is a security company that provides protection of the networks and electronic assets of companies and organizations. The company tailors its security solutions to clients’ individual requirements.
Sportvision, Inc.
Sportvision is an interactive sports marketing and technology company developing products to enrich fans’ interaction with sports via its unique broadcast and interactive solutions and helping create new value for sports properties, marketers and media companies. Sportvision’s technologies have been utilized in broadcasts of all of the major sports including the NFL, NBA, NASCAR, NHL, PGA Tour, LPGA Tour, Major League Baseball, NCAA football and basketball, WTA, Arena Football League, XTERRA, Ironman Triathlon and other sporting events on-air and online.
Talisma Corporation
Talisma Corporation is a provider of multi-channel Customer Resource Management (CRM) software. The software integrates email, chat, real-time collaboration, and telephony applications with a multi-channel interaction management platform. In addition, the software offers comprehensive analytics and a fully integrated system-wide knowledgebase and customer database.
Transoral Pharmaceuticals, Inc.
TransOral is a specialty pharmaceutical company developing novel formulations of proven active agents to provide meaningful new patient benefits. The Company’s initial proprietary technology is being employed to accelerate efficacy and reduce drug dose in the development of therapeutics for the treatment of migraine and insomnia.
ViDeOnline Communications, Ltd.
ViDeOnline develops an end to end secure network specifically designed to address the secure distribution and delivery of personal entertainment media.
Wageworks, Inc.
WageWorks provides employer-sponsored, tax-advantaged spending solutions, including medical and family-care reimbursement and transit passes.
Wallop, Inc.
Wallop is a social networking site using a user interface that enables people to interact in a way similar to the way they would in the real world.
Waterfront Media, Inc.
Waterfront Media is an internet-based publisher of health and wellness information. Waterfront Media derives both subscription and advertising revenue.
Wireless Channels, Inc.
Wireless Channels consolidates a number of large wholesalers (master distributors) and creates a distribution channel for wireless and associated products and services.
Xillix Technologies Corp.
Xillix Technologies Corp. develops fluorescence endoscopy technology for improved cancer detection. Xillix’s latest device incorporates fluorescence and white-light endoscopy in a single device that has been developed for the detection and localization of lung and gastrointestinal (GI) cancers.
75
Information about our senior securities is shown in the following table for the periods ended December 31, 2006, 2005 and 2004 and March 31, 2007. The information has been derived from our financial statements which have been audited by Ernst & Young LLP for the periods ending December 31, 2006, 2005 and 2004. The March 31, 2007 information has been derived from our unaudited financial statements. Ernst & Young LLP’s report on the senior securities table is attached as an exhibit to the registration statement of which this prospectus is a part. See “Management’s Discussion and Analysis—Borrowings” for updated senior securities information.
| Class and Year |
Total Amount Outstanding Exclusive of Treasury Securities (1) |
Asset Coverage per Unit (2) |
Average Market Value per Unit (3) | |||||
| Bridge Loan Credit Facility with Alcmene Funding L.L.C. |
||||||||
| December 31, 2004 |
— | — | N/A | |||||
| December 31, 2005 |
$ | 25,000,000 | $ | 2,505 | N/A | |||
| December 31, 2006 |
— | — | N/A | |||||
| March 31, 2007 |
— | — | N/A | |||||
| Securitized Credit Facility with Citigroup Global Markets Realty Corp. |
||||||||
| December 31, 2004 |
— | — | N/A | |||||
| December 31, 2005 |
$ | 51,000,000 | $ | 2,505 | N/A | |||
| December 31, 2006 |
$ | 41,000,000 | $ | 7,230 | N/A | |||
| March 31, 2007 |
$ | 113,000,000 | $ | 3,386 | N/A | |||
| (1) | Total amount of each class of senior securities outstanding at the end of the period presented. |
| (2) | The asset coverage ratio for a class of senior securities representing indebtedness is calculated as our consolidated total assets, less all liabilities and indebtedness not represented by senior securities, divided by senior securities representing indebtedness. This asset coverage ratio is multiplied by $1,000 to determine the Asset Coverage per Unit. |
| (3) | Not applicable because senior securities are not registered for public trading. |
DETERMINATION OF NET ASSET VALUE
We determine the net asset value per share of our common stock quarterly. The net asset value per share is equal to the value of our total assets minus liabilities and any preferred stock outstanding divided by the total number of shares of common stock outstanding. As of the date of this prospectus, we do not have any preferred stock outstanding.
At March 31, 2007, approximately 89% of our total assets represented investments in portfolio companies of which 99% are valued at fair value by the Board of Directors. Value, as defined in Section 2(a) (41) of the 1940 Act, is (i) the market price for those securities for which a market quotation is readily available and (ii) for all other securities and assets, fair value is as determined in good faith by the Board of Directors in accordance with established valuation procedures and the recommendation of the Valuation Committee of the Board of Directors. Since there is typically no readily available market value for the investments in our portfolio, we value substantially all of our investments at fair value as determined in good faith by our management pursuant to a valuation policy and a consistent valuation process. Due to the inherent uncertainty in determining the fair value of investments that do not have a readily available market value, the fair value of our investments determined in good faith by our management may differ significantly from the value that would have been used had a ready market existed for such investments, and the differences could be material.
There is no single standard for determining fair value in good faith. As a result, determining fair value requires that judgment be applied to the specific facts and circumstances of each portfolio investment. Unlike banks, we are not permitted to provide a general reserve for anticipated loan losses. Instead, we must determine the fair value of each individual investment on a quarterly basis. We will record unrealized depreciation on investments when we believe that an investment has decreased in value, including where collection of a loan or realization of an equity security is doubtful. Conversely, we will record unrealized appreciation if we believe that the underlying portfolio company has appreciated in value and, therefore, our investment has also appreciated in value, where appropriate.
76
As a business development company, we invest primarily in illiquid securities including debt and equity-related securities of private companies. Our investments are generally subject to some restrictions on resale and generally have no established trading market. Because of the type of investments that we make and the nature of our business, our valuation process requires an analysis of various factors. Our valuation methodology includes the examination of, among other things, the underlying investment performance, financial condition and market changing events that impact valuation.
With respect to private debt and equity-related securities, each investment is valued using industry valuation benchmarks and, where appropriate, equity values are assigned a discount reflecting the illiquid nature of the investment, and our minority, non-control position. When a qualifying external event such as a significant purchase transaction, public offering, or subsequent debt or equity sale occurs, the pricing indicated by the external event will be used to corroborate our private debt or equity valuation. Securities that are traded in the over-the-counter market or on a stock exchange generally will be valued at the prevailing bid price on the valuation date. However, restricted or thinly traded public securities may be valued at discounts from the public market value due to restrictions on sale.
Determinations In Connection With Offerings
In connection with each offering of shares of our common stock, the Board of Directors or a committee thereof is required to make the determination that we are not selling shares of our common stock at a price below our then current net asset value at the time at which the sale is made. The Board of Directors considers the following factors, among others, in making such determination:
| • | the net asset value of our common stock disclosed in the most recent periodic report we filed with the SEC; |
| • | our management’s assessment of whether any material change in the net asset value has occurred (including through the realization of net gains on the sale of our portfolio investments) from the period beginning on the date of the most recently disclosed net asset value to the period ending two days prior to the date of the sale of our common stock; and |
| • | the magnitude of the difference between the net asset value disclosed in the most recent periodic report we filed with the SEC and our management’s assessment of any material change in the net asset value since the date of the most recently disclosed net asset value, and the offering price of the shares of our common stock in the proposed offering. |
Importantly, this determination does not require that we calculate net asset value in connection with each offering of shares of our common stock, but instead it involves the determination by the Board of Directors or a committee thereof that we are not selling shares of our common stock at a price below the then current net asset value at the time at which the sale is made.
Moreover, to the extent that there is even a remote possibility that we may (i) issue shares of our common stock at a price below the then current net asset value of our common stock at the time at which the sale is made or (ii) trigger the undertaking (which we provided to the SEC in the registration statement to which this prospectus is a part) to suspend the offering of shares of our common stock pursuant to this prospectus if the net asset value fluctuates by certain amounts in certain circumstances until the prospectus is amended, the Board of Directors or a committee thereof will elect, in the case of clause (i) above, either to postpone the offering until such time that there is no longer the possibility of the occurrence of such event or to undertake to determine net asset value within two days prior to any such sale to ensure that such sale will not be below our then current net asset value, and, in the case of clause (ii) above, to comply with such undertaking or to undertake to determine net asset value to ensure that such undertaking has not been triggered.
These processes and procedures are part of our compliance policies and procedures. Records will be made contemporaneously with all determinations described in this section and these records will be maintained with other records we are required to maintain under the 1940 Act.
77
Our business and affairs are managed under the direction of our Board of Directors. Our Board of Directors elects our officers who serve at the discretion of the Board of Directors. Our Board of Directors currently consists of four members, one who is an “interested person” of Hercules Technology Growth Capital as defined in Section 2(a)(19) of the 1940 Act and three who are not interested persons and who we refer to as our independent directors.
Directors, Executive Officers and Key Employees
Our executive officers, directors and key employees and their positions are set forth below. The address for each executive officer, director and key employee is c/o Hercules Technology Growth Capital, Inc., 400 Hamilton Avenue, Suite 310, Palo Alto, California 94301.
| Name |
Age | Positions | ||
| Interested Director:(1) |
||||
| Manuel A. Henriquez |
43 | Chairman of the Board of Directors, President and Chief Executive Officer | ||
| Independent Directors: |
||||
| Robert P. Badavas(2)(3)(4)(5) |
54 | Director | ||
| Joseph W. Chow(2)(3)(4)(5) |
54 | Director | ||
| Allyn C. Woodward, Jr.(2)(3)(4)(5) |
66 | Director | ||
| Executive Officers: |
||||
| Manuel A. Henriquez |
43 | Chairman of the Board of Directors, President and Chief Executive Officer | ||
| Samir Bhaumik |
43 | Senior Managing Director | ||
| James C. Crumpton |
53 | Chief Credit Officer | ||
| H. Scott Harvey |
53 | Chief Legal Officer and Chief Compliance Officer | ||
| David M. Lund |
53 | Chief Financial Officer | ||
| Shane A. Stettenbenz |
36 | Chief Technology Officer | ||
| Parag I. Shah |
35 | Senior Managing Director | ||
| Key Employees: |
||||
| Kathleen Conte |
60 | Managing Director | ||
| Mark S. Denomme |
40 | Managing Director | ||
| Kevin L. Grossman |
38 | Managing Director | ||
| Roy Y. Liu |
46 | Managing Director | ||
| Edward M. Messman |
36 | Managing Director | ||
| Paul Walborsky |
41 | Managing Director | ||
| (1) | Mr. Henriquez is an interested person, as defined in section 2(a)(19) of the 1940 Act, of the Company due to his position as an officer of the Company. |
| (2) | Member of the Audit Committee. |
| (3) | Member of the Valuation Committee. |
| (4) | Member of the Compensation Committee. |
| (5) | Member of the Nominating and Corporate Governance Committee. |
Interested Director
Manuel A. Henriquez is a co-founder of the company and has been our Chairman and Chief Executive Officer since December 2003 and our President since April 2005. Prior to co-founding our company, Mr. Henriquez was a Partner at VantagePoint Venture Partners from August 2000 through July 2003. Prior to
78
VantagePoint Venture Partners, Mr. Henriquez was the President and Chief Investment Officer of Comdisco Ventures, a division of Comdisco, Inc., a leading technology and financial services company, from November 1999 to March 2000. Prior to that, from March 1997 to November 1999, Mr. Henriquez was a Managing Director of Comdisco Ventures. Mr. Henriquez was a senior member of the investment team at Comdisco Ventures that originated over $2.0 billion of equipment lease, debt and equity transactions from 1997 to 2000. Mr. Henriquez received a B.S. in Business Administration from Northeastern University.
Independent Directors
Robert P. Badavas has served as a director since March 2006. Mr. Badavas is the President and Chief Executive Officer of TAC Worldwide, a staffing and business services company owned by Goodwill Group of Japan. From November 2003 until becoming president and CEO in December 2005, he was the Executive Vice President and Chief Financial Officer of TAC Worldwide. Prior to joining TAC Worldwide, Mr. Badavas was Senior Principal and Chief Operating Officer of Atlas Venture, a venture capital firm, from September 2001 to September 2003. Prior to joining Atlas Venture, he was Senior Corporate Adviser to the Office of the Chairman of Aether Systems, Inc., a provider of wireless data products and services, from September 2000 to June 2001. Prior to that, he was Chief Executive Officer of Cerulean Technology, Inc., a provider of mobile information systems applications, from December 1995 until Aether Systems, Inc. acquired the company in September 2000. From 1986 to October 1995, Mr. Badavas was Senior Vice President and Chief Financial Officer, among other capacities, of Chipcom Corporation, a manufacturer of computer networking intelligent switching systems. Mr. Badavas was previously a board member and Chairman of the Audit Committee for RSA Security, Inc. until its acquisition by EMC Corporation in September 2006. He was previously a director and Chairman of the Audit Committee of ON Technology, until ON Technology was acquired by Symantec, Inc. in 2004 and is a former director of Renaissance Worldwide, until its acquisition by a privately-held company in 2001. Mr. Badavas is a Trustee of both Bentley College in Waltham, MA and Hellenic College/Holy Cross School of Theology in Brookline, MA. He is also Chairman of the Board of the Learning Center for Deaf Children, Framingham, MA. Mr. Badavas is a graduate of Bentley College with a BS in Accounting and Finance.
Joseph W. Chow has served as a director since February 2004. Mr. Chow is Executive Vice President and Chief Risk and Corporate Administration Officer at State Street Corporation, having retired from the company in August 2003 and rejoining it in July 2004. Prior to August 2003, Mr. Chow was Executive Vice President and Head of Credit and Risk Policy at State Street. Before joining State Street in 1990, Mr. Chow worked at Bank of Boston in various international and corporate banking roles and specialized in the financing of emerging-stage high technology companies from 1983 to 1989. Mr. Chow is a graduate of Brandeis University with a B.A. in Economics. He also received an M.C.P. from the Massachusetts Institute of Technology and an M.S. in Management (Finance) from the MIT Sloan School of Management.
Allyn C. Woodward, Jr. has served as a director since February 2004. Mr. Woodward was Vice Chairman of Adams Harkness Financial Group (AHFG-formerly Adams, Harkness & Hill) from April, 2001 until January, 2006 when AHFG was sold to Canaccord, Inc. He previously served as President from 1995-2001. AHFG was an independent institutional research, brokerage and investment banking firm headquartered in Boston, MA. Prior to joining AHFG, Mr. Woodward worked for Silicon Valley Bank from April, 1990 to April 1995, initially as Executive Vice President and Co-founder of the Wellesley MA office and more recently as Senior Executive Vice President and Chief Operating Officer of the parent bank in California. Silicon Valley Bank is a commercial bank, headquartered in Santa Clara, CA whose principal lending focus is directed toward the technology, healthcare and venture capital industries. Prior to joining Silicon Valley Bank, Mr. Woodward was Senior Vice President and Group Manager of the Technology group at Bank of New England, Boston, MA where he was employed from 1963-1990. Mr. Woodward is currently a Director, Chairman of the Compensation Committee and a member of the Audit Committee of Lecroy Corporation. He is also a former Director of Viewlogic and Cayenne Software, Inc. Mr. Woodward serves on the Board of Directors of three private companies and is on the Board of Advisors of five venture capital firms. Mr. Woodward is on the Board of Overseers and a member of the Finance Committee of Newton Wellesley Hospital, a 250 bed hospital located in Newton, MA.
79
Mr. Woodward is on the Board of Overseers and the Investment Committee and the Finance Committee of Babson College in Babson Park, MA. Mr. Woodward graduated from Babson College with a degree in finance and accounting. He also graduated from the Stonier Graduate School of Banking at Rutgers University.
Executive Officers who are not Directors
Samir Bhaumik joined the company in November 2004 as a Managing Director and was promoted to Senior Managing Director in June 2006. Mr. Bhaumik previously served as Vice President—Western Region of the New York Stock Exchange from January 2003 to October 2004. Prior to working for the New York Stock Exchange, Mr. Bhaumik was Senior Vice President of Comerica Bank, previously Imperial Bank, from April 1993 to January 2003. Mr. Bhaumik received a B.A. from San Jose State University and an M.B.A from Santa Clara University. He serves on the advisory boards of Santa Clara University Leavey School of Business, Junior Achievement of Silicon Valley and the American Electronics Association-Bay Area council.
James C. Crumpton joined the company in April 2007 as Chief Credit Officer. Prior to joining Hercules, Mr. Crumpton served as Senior Vice President and Credit Administration Officer at Comerica Bank since 1999. Prior to that, he served as Senior Vice President and Senior Technology Leader at Silicon Valley Bank and Vice President, Relationship Management at Wells Fargo Bank. Mr. Crumpton also held executive positions at First Interstate Bank, Bank Boston and The CIT Group. Mr. Crumpton earned a Master of Business Administration from the Edward S. Ageno School of Business at Golden Gate University and a Bachelor of Arts from the University of California at Santa Barbara.
H. Scott Harvey is a co-founder of the company and has been our Chief Legal Officer since December 2003. Mr. Harvey has over 20 years of legal and business experience with leveraged finance and financing public and private technology-related companies. Since July 2002, and prior to joining us, Mr. Harvey was in a diversified private practice. Previously, Mr. Harvey was Deputy General Counsel of Comdisco, Inc., a leading technology and financial services company, from January 1997 to July 2002. From 1991 to 1997, Mr. Harvey served as Vice President of Marketing, Administration & Alliances with Comdisco, Inc. and was Corporate Counsel from 1983 to 1991. Mr. Harvey received a B.S. in Agricultural Economics from the University of Missouri, a J.D. and LLM in taxation from The John Marshall Law School and an M.B.A. from Illinois Institute of Technology.
David M. Lund joined us in July 2005 as Vice President of Finance and Corporate Controller, and was promoted to Chief Financial Officer on October 2, 2006. Mr. Lund is our principal financial and accounting officer. He has over 20 years of experience in finance and accounting serving companies in the technology sector. Prior to joining Hercules, Mr. Lund served in senior financial positions for publicly traded companies: InterTrust Technologies, Centillium Communications and Rainmaker Systems, and in private companies: Urban Media, Scion Photonics and APT Technology. Mr. Lund also served in public accounting with Ernst & Young LLP and Grant Thornton LLP. He received a B.S. degree in Business Administration with an emphasis in Accounting from San Jose State University and a B.S. degree in Business Administration with an emphasis in Marketing from California State University, Chico. Mr. Lund is a Certified Public Accountant in the State of California.
Parag I. Shah joined the company in November 2004 as Managing Director of Life Sciences and was promoted to Senior Managing Director in June 2006. Prior to joining Hercules, Mr. Shah served as Managing Director for Biogenesys Capital from April to November 2004. From April 2000 to April 2004, Mr. Shah served as a Senior Vice President in Imperial Bank’s Life Sciences Group, which was acquired by Comerica Bank in early 2001. Prior to working at Comerica Bank, Mr. Shah was an Assistant Vice President at Bank Boston from January 1997 to March 2000. Bank Boston was acquired by Fleet Bank in 1999. Mr. Shah completed his Masters degrees in Technology, Management and Policy as well as his Bachelors degree in Molecular Biology at the Massachusetts Institute of Technology (MIT). During his tenure at MIT, Mr. Shah conducted research at the Whitehead Institute for Biomedical Research and was chosen to serve on the Whitehead Institute’s Board of Associates in 2003.
80
Shane A. Stettenbenz joined the company in February 2004 as Vice President—Information Systems and has served as Chief Technology Officer since December 2004. Mr. Stettenbenz previously served as an IT Director for VantagePoint Venture Partners from May 2001 to June 2003. Prior to that, Mr. Stettenbenz was an IT Manager for Comdisco Ventures, a division of Comdisco, Inc. from May 1997 to May 2001. Mr. Stettenbenz attended San Jose State University from 1991 to 1995 while majoring in Management Information Systems.
Key Employees
Kathleen Conte joined the company as a Managing Director of Life Sciences in November 2004. From December 2003 to November 2004, she worked as an independent consultant. From 1993 to December 2003, she served as Senior Vice President at Comerica Bank running its West Coast Life Sciences Group. Ms. Conte was at Prudential Capital Corporation from 1988 to 1993 originating structured private placements. Prior to that she spent 13 years at Wells Fargo Bank in various lending positions. Ms. Conte holds a B.A. degree and an M.B.A. from the University of Delaware.
Mark S. Denomme joined the company as a Managing Director in September 2006. Mr. Denomme has over 18 years of experience in financial services. Prior to joining the company, Mr. Denomme was a Senior Vice President at Brown Brothers Harriman & Co., focusing on investments in middle market healthcare companies. From 2000 to 2006, Mr. Denomme was a Managing Director and co-founder of Consilium Partners, an investment banking firm focused on sell-side and buy-side engagements for middle market companies. From 1997 to 2000, Mr. Denomme was a Director in the Leveraged Finance group of BancBoston Robertson Stephens, focusing on originating loan syndication and high yield debt opportunities for the firm’s technology and media clients. From 1988 to 1997, Mr. Denomme was a commercial lender with Bank of Boston focused on structured debt opportunities with technology and media-related companies. Mr. Denomme holds a BBA degree from the University of Michigan and his series 7, 63 and 24 NASD licenses.
Kevin Grossman joined the company in September 2006 as a Managing Director. Mr. Grossman previously served as a Senior Relationship Manager and Senior Vice President in Silicon Valley Bank’s Colorado office from July 1999 to August 2006 servicing technology and life sciences companies throughout Arizona, New Mexico, Utah, and Colorado. From December 1998 through July 1999, Mr. Grossman was with Fremont Financial in a Business Development capacity providing Asset Based Lending facilities. Prior to that he served from January 1996 through February 1998 at the National Bank of Canada providing Asset Based Lending deals with Portfolio Management responsibilities. From June 1993 through December 1995 he opened two offices for an asset based lending company in the Pacific Northwest providing services to highly leveraged entities and companies experiencing financial stress. Mr. Grossman earned a Bachelor’s degree in Business Economics at the University of California at Santa Barbara and a Master’s degree in Business Administration from Northern Arizona University. Mr. Grossman is a member of the Board of Advisors for Agility Leasing, and a member of Association for Corporate Growth, Rockies Venture Club, and the Colorado Venture Capital Association. He is also on the Board of Directors of the Denver Metro YMCA and serves as Program Chairman for the Duncan Family Branch.
Roy Y. Liu joined the company as a Managing Director in April 2004. Mr. Liu has over 20 years experience in operations and finance of technology companies. Formerly, Mr. Liu was a Vice President at GrandBanks Capital, an early-stage, information technology-focused venture capital firm. From 2000 to 2002, Mr. Liu was a founding principal of VantagePoint Structured Investments, a debt fund affiliated with VantagePoint Venture Partners. Prior to joining VantagePoint, Mr. Liu was VP Finance and Chief Financial Officer for toysmart.com, Inc. Prior to joining toysmart.com, he was a First Vice President and co-founded Imperial Bank’s Emerging Growth Industries Boston office in 1997, where he focused specifically on debt financing for venture-backed companies. Prior to co-founding Imperial Bank’s Emerging Growth Industries Boston office, Mr. Liu was the Chief Financial Officer of Microwave Bypass Systems, Inc. Prior to joining Microwave Bypass, Mr. Liu was Vice President and head of the High Tech Lending group for State Street Bank & Trust Co. Mr. Liu started his finance career in the Acquisition Finance Division of the Bank of Boston. Prior to his career in finance, Mr. Liu
81
worked four years at IBM in research and product development. He holds a B.S. degree in Electrical Engineering and an M.B.A. from the University of Michigan.
Edward M. Messman joined the company in July 2005 as a Managing Director. From June 2004 to July 2005, Mr. Messman served as the Southwest Regional Market Manager of the Structured Finance Group of Silicon Valley Bank. Prior to Silicon Valley Bank, Mr. Messman worked as an independent consultant from December 2003 to June 2004. From October 1998 to December 2003, Mr. Messman was Vice President of Comerica Bank, previously Imperial Bank, where he formed and managed the Technology and Life Sciences group in Denver, Colorado covering the Rocky Mountain region. Mr. Messman received a B.S. degree in International Business from Grand Canyon University and an M.B.A from the University of Colorado.
Paul Walborsky joined the company in November 2006 as a Managing Director. He previously served as founder and CEO of Grupo Arca, Inc., from January 2004 to November 2006. Prior to founding Grupo Arca, Paul was Senior Vice President in the Wealth and Asset Management group of Lehman Brothers from May 2002 to December 2003. Paul was a Senior Vice President of Business Development at Moneyline, Inc. from November 2001 until May 2002. Prior to this, Paul founded and served as Senior Vice President of Corporate Development at WorldStreet Corporation from February 1996 through October 2001. Paul holds a B.A. in Economics from Brandeis University and an M.A. in Finance and Economics from the Lemberg Program at Brandeis University.
Board of Directors
The number of directors is currently fixed at four directors.
Our Board of Directors is divided into three classes. One class holds office for a term expiring at the annual meeting of stockholders to be held in 2007, a second class holds office for a term expiring at the annual meeting of stockholders to be held in 2008, and a third class holds office initially for a term expiring at the annual meeting of stockholders to be held in 2009. Each director holds office for the term to which he or she is elected and until his or her successor is duly elected and qualifies. Mr. Henriquez’s term expires in 2007, Mr. Badavas and Mr. Chow’s terms expire in 2008 and Mr. Woodward’s term expires in 2009. At each annual meeting of our stockholders, the successors to the class of directors whose terms expire at such meeting will be elected to hold office for a term expiring at the annual meeting of stockholders held in the third year following the year of their election and until their successors are duly elected and qualify.
Compensation of Directors
The Compensation Committee engages an outside compensation consultant to review the competitiveness and effectiveness of our director compensation program relative to market practices within a select group of peers based on market size, industries, geographic regions and other factors. We historically have retained Watson Wyatt Worldwide, Inc. to act as its compensation consultant regarding independent director compensation. The consultant recommends to the Compensation Committee the mix of cash versus equity compensation to be offered as well as the types of long-term incentives to be granted.
The following table discloses the cash, equity awards and other compensation earned, paid or awarded, as the case may be, to each of our directors during the fiscal year ended 2006.
| Name |
Fees Earned or Paid in Cash ($)(1) |
Stock Awards ($) |
Option Awards ($)(2) |
All Other Compensation ($) |
Total ($) | ||||||||||
| Robert P. Badavas |
$ | 204,215 | $ | — | $ | — | $ | — | $ | 204,215 | |||||
| Joseph W. Chow |
521,085 | — | — | — | 521,085 | ||||||||||
| Allyn C. Woodward, Jr. |
524,835 | — | — | — | 524,835 | ||||||||||
| Manuel A. Henriquez(3) |
— | — | — | — | — | ||||||||||
82
| (1) | During 2006, Messrs. Badavas, Chow and Woodward were awarded additional fees of $125,465, $374,085 and $374,085 respectively. Messrs. Badavas, Chow and Woodward elected to receive 5,001, 15,000 and 15,000 shares of our common stock, respectively, in lieu of a portion of the cash payment. The total value of the shares issued for services in fiscal 2006 was $65,368, $194,900 and $194,900 for Messrs. Badavas, Chow and Woodward, respectively. |
| (2) | As part of our plan to compensate our non-employee directors, Messrs. Chow and Woodward were granted options to purchase shares of our common stock when they joined the board of directors in 2004. Pursuant to the requirements of the 1940 Act, we cancelled these options when we elected to be regulated as a business development company in 2005. On February 15, 2007, we received exemptive relief from the SEC to issue stock options to our non-employee directors, though no options have been granted yet. |
| (3) | As an employee director, Mr. Henriquez does not receive any compensation for his service as a director. The compensation Mr. Henriquez receives as Chief Executive officer of the company is disclosed in the Summary Compensation Table. |
As compensation for serving on our Board, each of our independent directors receives an annual fee of $50,000 and the chairperson of each committee receives an additional $15,000 annual fee. Each independent director also receives $2,000 for each Board or committee meeting they attend, whether in person or telephonically. Employee directors and non-independent directors will not receive compensation for serving on the Board. In addition, we reimburse our directors for their reasonable out-of-pocket expenses incurred in attending meetings of the Board.
Directors do not receive any perquisites or other personal benefits from the Company.
Under current SEC rules and regulations applicable to business development companies, a business development company may not grant options to non-employee directors, unless it receives exemptive relief from the SEC. On June 21, 2005, we applied for exemptive relief from the SEC to permit us to grant options to purchase shares of our common stock to our non-employee directors as a portion of their compensation for service on our Board and on February 15, 2007, we received approval from the SEC on this exemptive request. No stock options were granted to our non-employee directors as of December 31, 2006.
Committees of the Board of Directors
Audit Committee. Our Board has established an Audit Committee. The Audit Committee is comprised of Messrs. Badavas, Chow and Woodward, each of whom is an independent director and satisfies the independence requirements for purposes of the Nasdaq Global Market listing standards and the requirements to be a non-interested director as defined in Section 2(a)(19) of 1940 Act. Mr. Badavas currently serves as Chairman of the Audit Committee and is a financial expert as defined under Nasdaq rules. The Audit Committee is responsible for approving our independent accountants, reviewing with our independent accountants the plans and results of the audit engagement, approving professional services provided by our independent accountants, reviewing the independence of our independent accountants and reviewing the adequacy of our internal accounting controls. During the last fiscal year, the Audit Committee held seven meetings.
Valuation Committee. Our Board has established a Valuation Committee. The Valuation Committee is comprised of Messrs. Badavas, Chow and Woodward, each of whom is an independent director and satisfies the independence requirements for purposes of the Nasdaq National Market listing standards and the requirements to be a non-interested director as defined in Section 2(a)(19) of the 1940 Act. Mr. Chow currently serves as chairman of the Valuation Committee. The Valuation Committee is responsible for reviewing and recommending to the full board the fair value of debt and equity securities that are not publicly traded in accordance with established valuation procedures. The Valuation Committee may utilize the services of an independent valuation firm in arriving at fair value of these securities. During the last fiscal year, the Valuation Committee held five meetings.
Compensation Committee. Our Board has established a Compensation Committee. The Compensation Committee is comprised of Messrs. Badavas, Chow and Woodward, each of whom is an independent director and satisfies the independence requirements for purposes of the Nasdaq National Market listing standards and the requirements to be a non-interested director as defined in Section 2(a)(19) of the 1940 Act. Mr. Woodward
83
currently serves as Chairman of the Compensation Committee. The Compensation Committee determines compensation for our executive officers, in addition to administering our 2004 Equity Incentive Plan and the 2006 Non-Employee Director Plan, which is described below and a copy of such plan as proposed to be amended is attached hereto as Exhibits B and C. During the last fiscal year, the Compensation Committee held two meetings.
Nominating and Corporate Governance Committee. Our Board has established a Nominating and Corporate Governance Committee. The Nominating and Corporate Governance Committee is comprised of Messrs. Chow, Badavas and Woodward, each of whom is an independent director and satisfies the independence requirements for purposes of the Nasdaq National Market listing standards and the requirements to be a non-interested director as defined in Section 2(a)(19) of the 1940 Act. Mr. Woodward currently serves as Chairman of the Nominating and Corporate Governance Committee. The Nominating and Corporate Governance Committee will nominate to the Board for consideration candidates for election as directors to the Board. During the last fiscal year, the Nominating and Corporate Governance Committee did not hold any meetings, however, discussions regarding candidate nominations and corporate governance were held in conjunction with the meetings of the Board.
Compensation Committee Interlocks and Insider Participation
All members of the Compensation Committee are independent directors and none of the members are present or past employees of the Company. No member of the Compensation Committee: (i) has had any relationship with the Company requiring disclosure under Item 404 of Regulation S-K under the Exchange Act; or (ii) is an executive officer of another entity, at which one of our executive officers serves on the board of directors.
Compensation of Executive Officers
Under SEC rules applicable to business development companies, we are required to set forth certain information regarding the compensation of certain of our executive officers and directors. The following sets forth information regarding the compensation earned by individuals who served as our chief executive officer or our chief financial officer during the year ended December 31, 2006, as well as our next three most highly compensated executive officers (collectively, they are referred to as “named executive officers”) in all capacities during the fiscal year ending serving as of December 31, 2006. We have not included any disclosure with respect to our Chief Credit Officer who joined the Company in April 2007.
Compensation Discussion and Analysis
Compensation Philosophy
The compensation and benefit programs of Hercules Technology Growth Capital, Inc. are designed with the goal of providing compensation that is fair, reasonable and competitive. The programs are intended to help us align the compensation paid to our executive officers with corporate and executive performance goals that have been established to achieve both our short-term and long-term objectives. We also believe that the compensation programs should enable us to attract, motivate, and retain employees who will contribute to our future success.
The design of the Company’s compensation programs is based on the following:
| • | Competitiveness and Market Alignment—Our compensation and benefits programs are designed to be competitive with compensation plans provided by companies with whom we compete for talent in order to attract the best talent from an increasingly competitive market for top performers in the industries in which we compete. |
We compete with private equity, mezzanine and hedge funds for investment professionals. Such funds commonly pay 20% of the net profits (including capital gains), or carried interest, of each newly-raised fund to
84
the partners and employees of the private equity, mezzanine or hedge fund. Thus, we believe that our employee option plans should be designed to provide an economic interest in us similar to that generally gained by partners and employees in private equity, mezzanine lenders, venture capital or hedge funds.
| • | Compensation Consultant—The Compensation Committee engages an outside compensation consultant to review the competitiveness and effectiveness of our employee compensation program relative to market practices and business goals. We historically have retained Watson Wyatt Worldwide, Inc. to act as our compensation consultant. The consultant reviews overall compensation levels and the relationship of our financial performance to actual compensation levels received over the previous year. |
The consultant recommends to the Compensation Committee changes in the mix of cash versus equity compensation to be offered as well as the types of long-term incentives to be granted. The consultant makes suggestions related to the types of performance measures to be used in the Company’s annual and long-term plans consistent with our business strategies and presents the relevant practices of peer companies. The consultant and the Company developed a list of peer companies based on market size, industries, geographic regions and other factors to be used for compensation and financial analyses. The comparative group included ten business development companies and six other specialty finance companies. However, given the fact that most of our direct competitors are private equity partnerships, specific compensation with respect to our direct competitors typically is not publicly available.
During 2006, the consultant also prepared summary analyses of total compensation for the Compensation Committee with respect to each of the named executive officers and our origination team. These summaries included all forms of current compensation including salary, annual incentives, long-term incentives, and employee benefits.
The consultant shares preliminary findings with the Chair of the Compensation Committee and presents the full report to the Compensation Committee. The Compensation Committee reviews the information provided by the consultant, including the summary analyses of key elements of compensation paid to each of the peer group executives and members of the origination team. In 2006, using the information previously provided by the consultant, the Compensation Committee determined the appropriate mix of short-term and long-term compensation for the Chief Executive Officer and, based upon recommendations from the Chief Executive Officer concerning individual performance, also determined the appropriate mix of short-term and long-term compensation for each of the other named executive officers.
| • | Achievement of Corporate and Individual Performance Objectives—We believe that the best way to align compensation with the interests of our shareholders is to link individual compensation with corporate objectives. Compensation is determined by the Compensation Committee on a discretionary basis and is dependent on the achievement of certain corporate and executive performance objectives that have been established to achieve short-term and long-term objectives of the Company. The objectives considered include, among other things, new investment originations and funding growth, revenue growth, realized and unrealized gains, yield on the investment portfolio, operating efficiency, credit performance, information system improvements, and capital (equity and debt) fund raising. We do not attach a specific weight or apply a formula with respect to the foregoing factors. When individual performance exceeds expectation and performance goals established during the year, compensation levels for the individual may exceed the target compensation level. When individual performance falls below expectations, compensation levels are expected to be below target levels. |
| • | Benchmarking—We do not specifically benchmark the compensation of our executive officers against that paid by other companies with publicly traded securities. This is because we believe that our primary competitors in both our business and for recruiting executive officers and other employees are private equity firms. Such entities do not publicly report the compensation of their executive officers nor do they typically report publicly information on their corporate performance. While various salary surveys, such as those noted above, and other sources provide us Industry Data with regard to these firms, we |
85
| believe that without accurate, publicly disclosed information on these entities that would serve as benchmarks, it is inappropriate to set formal benchmarking procedures. |
| • | Alignment with Requirements of the Investment Company Act of 1940 (the “1940 Act”)—Our compensation program must comply with the requirements of the 1940 Act which imposes certain limitations on the structure of a business development company’s (“BDC”) compensation program. For example, the 1940 Act prohibits a BDC from maintaining an incentive stock option award plan and a profit sharing arrangement simultaneously. As a result, if a BDC has an incentive stock option award plan, it is prohibited from using a profit sharing arrangement such as a carried interest formula, a common form of compensation in the private equity industry, as a form of compensation. These limitations and other similar restrictions imposed by the 1940 Act limit the compensation arrangements that can be utilized in order to attract and retain employees. |
Components of Total Compensation
The Compensation Committee determined that the compensation packages for 2006 for its named executive officers should consist of the following three key components:
| • | Annual base salary, |
| • | Annual cash bonus, and |
| • | Incentive stock option awards. |
Annual Base Salary
Base salary is designed to attract and retain experienced executives who can drive the achievement of our goals and objectives. While our executive’s initial base salaries are determined by an assessment of competitive market levels for comparable experience and responsibilities, the factors used in determining changes in base salary include individual performance, changes in role and/or responsibility and changes in the competitive market environment.
Annual Cash Bonus
The annual cash bonus is designed to reward our executives that have achieved certain corporate and executive performance objectives. The amount of the annual cash bonus is determined by the Compensation Committee on a discretionary basis and is dependent on the achievement of certain quantitative and qualitative objectives during the year that were established to achieve both short-term and long-term objectives.
Incentive Stock Option Awards
The Compensation Committee’s principal objective in awarding incentive stock options is to align each optionee’s interests with our success and the financial interests of its stockholders. The Compensation Committee evaluates a number of criteria, including the past service of each such optionee, the present and potential contributions of such optionee our success, years of service, position, and such other factors as the Compensation Committee believes to be relevant in connection with accomplishing the purposes of the long-term goals of the Company. The Compensation Committee does not apply a formula assigning specific weights to any of these factors when making its determination. The Compensation Committee awards incentive stock options on a subjective basis and such awards depend in each case on the performance of the executive under consideration, and in the case of new hires, their potential performance. See “2004 Stock Incentive Plan” for additional information.
Option awards under the 2004 Equity Incentive Plan are generally awarded upon initial employment and on an annual basis thereafter. Options generally vest one-third one year after the date of grant and ratably over the succeeding 24 months.
86
On July 7, 2006, we applied for exemptive relief with the SEC in order to permit us to issue restricted stock pursuant to the 2004 Equity Incentive Plan and the 2006 Non-Employee Director Plan (together, the “Plans”). The SEC has commenced its review of the exemptive application and we are currently responding to questions on the relief request, but as of the date hereof, we have not received approval of the application and accordingly cannot evaluate when or if an order regarding our application may be granted.
We believe that the issuance of restricted stock permits us to provide long-term incentives to attract experienced business professionals who might otherwise elect to become employed with private equity, mezzanine lenders, venture capital firms or hedge funds.
Benefits and Perquisites
In addition to base salaries, annual cash bonuses and incentive stock option awards, we provide our executives with certain other benefits to assist in remaining competitive in the marketplace. All executive officers and other full-time employees receive general health and welfare benefits, which consist of life and health insurance benefits and the opportunity to participate in our defined contribution 401(k) plan. Our 401(k) plan does not currently provide for a match of contributions by the Company. Our executive officers receive the same benefits and perquisites as our full-time employees. Other than the benefits described above, our executive officers do not receive any other benefits or perquisites from the Company.
Tax and Accounting Implications
Stock-Based Compensation. The Company accounts for stock-based compensation, including options granted pursuant to its 2004 Equity Incentive Plan in accordance with the requirements of SFAS No. 123R.
Deductibility of Executive Compensation. Our compensation philosophy and policies are intended to comply with Code Section 162(m) and related regulations, which establish certain requirements in order for performance-based compensation in excess of $1,000,000 paid to certain executive officers to be deductible by us. In establishing and administering our compensation programs, the Compensation Committee generally intends that performance-based compensation will be deductible under Code Section 162(m), although we retain the flexibility to pay compensation that is not eligible for such treatment if it is in our best interest to do so.
Establishing Compensation Levels
Role of the Compensation Committee and Management
The Compensation Committee is comprised entirely of independent directors who are also non-employee directors as defined in Rule 16b-3 under the Securities Exchange Act of 1934 and independent directors as defined by Nasdaq Global Market rules.
The Compensation Committee operates pursuant to a charter that sets forth the mission of the Compensation Committee and its specific goals and responsibilities. The Compensation Committee Charter is available on our website at www.herculestech.com. The Compensation Committee evaluates the compensation of the executive officers and their performance relative to their compensation to assure that they are compensated effectively in a manner consistent with the compensation philosophy discussed above. In addition, the Compensation Committee evaluates and makes recommendations to the Board regarding the compensation of the directors.
The key member of management involved in the compensation process is our Chief Executive Officer, Manuel Henriquez. Mr. Henriquez identifies certain corporate and executive performance objectives that have been established to achieve short-term and long-term objectives that are used to determine total compensation. Mr. Henriquez also recommends the overall funding level for the annual cash bonus plan. Mr. Henriquez’s recommendations are presented to the Compensation Committee for review and approval, but he is not a member of the Compensation Committee and is not involved in the deliberations of the Committee.
87
The Compensation Committee makes all decisions with respect to compensation of the named executive officers, subject to review and approval by the full Board of Directors. The Chief Executive Officer reviews the performance of our executive officers (other than himself) and, based on that review, provides input regarding the performance of the other executive officers and makes recommendations for compensation amounts payable to the other executive officers, including the other named executive officers. Our Compensation Committee meets outside of the presence of the Chief Executive Officer when reviewing and determining his compensation.
Company Compensation Policies
In determining the individual compensation for the Company’s executives and employees, the Compensation Committee considers the total compensation to be awarded to each executive and employee and exercises discretion in determining the portion allocated to the various components of total compensation. We believe that the focus on total compensation provides the ability to align compensation decisions with short-term and long-term needs of the business. This approach also allows for the flexibility needed to recognize differences in performance by providing differentiated compensation plans to its executives and employees.
Assessment of Company Performance
In determining the 2006 annual cash bonuses for the executives, the Compensation Committee considered the achievement of certain corporate and executive performance objectives and the short-term and long-term objectives of the company as described above. During 2006, we achieved several strategic investment and operational goals and objectives, including increasing revenues to $29.5 million representing a 177% increase over 2005 revenues of $10.7 million, generating $3.3 million in net realized gains attributed to sales of warrants and equity in four portfolio companies, raising approximately $143 million in net proceeds from the sale of our common stock, increasing our credit facility from $100 million to $150 million, investing $193 million in 35 total portfolio companies, paying $1.20 in dividends to stockholders, and expanding our organizational capabilities through growth in investment talent in our Palo Alto office and regional offices in Boulder and Boston.
Determination of 2006 Salaries of Named Executive Officers
The Compensation Committee reviews the components of the compensation provided to our executives.
Individual compensation levels for executives are determined based on individual performance and the achievement of certain corporate and executive performance objectives that have been established to achieve our short-term and long-term objectives.
Increases to base salary are awarded when necessary to address significant changes in the external competitive market for a given position, to recognize an executive for assuming significant additional responsibilities and his/her related performance, or to achieve an appropriate competitive level due to a promotion. Annual increases are generally approved by the Compensation Committee in June or July of each year.
During June 2006, Messrs. Henriquez, Lund, Harvey, Bhaumik and Shah base salaries were set at $550,000, $200,000, $190,000, $210,000 and $210,000, respectively, and base salaries in June 2005 were set at $550,000, $160,000, $150,000, $175,000 and $175,000, respectively.
Determination of 2006 Annual Cash Bonus for Named Executive Officers
In determining the amount of an executive’s variable compensation—the annual cash bonus—the Compensation Committee evaluates the executive’s performance based on qualitative and quantitative measures, for example, new funding originations during the year, yields on our investment portfolio, realized and unrealized gains, credit performance of the investment portfolio, operating efficiency, information system
88
improvements, timeliness of public reporting, amongst other things. Within those guidelines, the Committee considers the overall funding available for such awards, the executive’s performance, and the desired mix between the various components of total compensation. Discretion is exercised in determining the overall total compensation to be awarded to the executive. As a result, the amounts delivered in the form of an annual cash bonus are designed to work together in conjunction with base salary to deliver an appropriate total compensation level to the executive.
We believe that the discretionary design of our variable compensation program supports its overall compensation objectives by allowing for significant differentiation of compensation based on individual performance and by providing the flexibility necessary to ensure that compensation packages for its executives are competitive relative to its market.
During fiscal 2006, Messrs. Henriquez, Lund, Harvey, Bhaumik and Shah received cash bonuses of $1,000,000, $100,000, $100,000, $25,000 and $272,500, respectively, as compared to cash bonuses for 2005 of $700,000, $50,000, $100,000, $65,000 and $150,000, respectively.
Incentive Stock Option Awards
Our principal objective in awarding incentive stock option awards to the eligible executive officers and employees is to align each optionee’s interests with our success and the financial interests of our stockholders by linking a portion of such optionee’s compensation with the long-term performance. The Compensation Committee awards incentive stock option awards on a subjective basis and such awards depend in each case on the performance of the executive and employee under consideration, and in the case of new hires, their potential performance. Incentive stock option awards are priced at the closing price of the stock on the date the Committee meets and the grant is issued. The Compensation Committee takes into account whether there is material non-public information related to the Company at the time of the option grant, among other factors, when granting stock options. See “2004 Equity Incentive Plan” for additional information.
Potential Payments Upon Termination or Change of Control
Upon specified covered transactions (as defined in the 2004 Equity Incentive Plan), in which there is an acquiring or surviving entity, the Board may provide for the assumption of some or all outstanding awards, or for the grant of new awards in substitution, by the acquiror or survivor or an affiliate of the acquiror or survivor, in each case on such terms and subject to such conditions as the Board determines. In the absence of such an assumption or if there is no substitution, except as otherwise provided in the award, each award will become fully exercisable prior to the covered transaction on a basis that gives the holder of the award a reasonable opportunity, as determined by the Board, to participate as a stockholder in the covered transaction following exercise, and the award will terminate upon consummation of the covered transaction. A covered transaction includes the following: (i) a merger or other transaction that results in the common stock of the company being acquired by a single person or group; (ii) a sale of substantially all of the company’s assets; or (iii) a dissolution or liquidation of the company; (iv) a change in a majority of the board’s composition unless approved by a majority of the directors continuing in office.
No executive officer or employee of the Company has a written employment or severance agreement. As a result, no executive officer is entitled to any severance payments.
89
Summary Compensation Table
The following table sets forth the compensation earned by our chief executive officer, chief financial officer and our next three most highly paid executives for services rendered to the Company and its subsidiaries for the fiscal year ended December 31, 2006.
| Name and Principal Position |
Year | Salary ($)(1) |
Bonus ($) |
Option Awards ($)(2) |
Total ($) | ||||||||||
| Chief Executive Officer |
|||||||||||||||
| Manuel A. Henriquez |
2006 | $ | 466,667 | $ | 1,000,000 | $ | 279,200 | (3) | $ | 1,745,867 | |||||
| Chief Financial Officer |
|||||||||||||||
| David M. Lund |
2006 | 180,000 | 100,000 | 26,900 | (4) | 306,900 | |||||||||
| Chief Legal Officer |
|||||||||||||||
| H. Scott Harvey |
2006 | 170,100 | 100,000 | 66,800 | (5) | 336,900 | |||||||||
| Senior Managing Director |
|||||||||||||||
| Samir Bhaumik |
2006 | 195,417 | 25,000 | 43,400 | (6) | 263,817 | |||||||||
| Senior Managing Director |
|||||||||||||||
| Parag I. Shah |
2006 | 195,417 | 272,500 | 41,500 | (7) | 509,417 | |||||||||
| (1) | Salary column represents base salary compensation received by each named executive officer during fiscal 2006. |
| (2) | The amounts reported in the Option Awards column represents the portion of the grant date fair value of the stock option grants made to the Named Executive Officers during 2006 and in prior years that was recognized as expense for financial reporting purposes during 2006 in accordance with the provisions of Statement of Financial Accounting Standards (“SFAS”) No. 123R, “Share-based Payments.” See “Critical Accounting Policies” section of the MD&A in the Company’s Annual Report for the year ended December 31, 2006 regarding assumptions underlying valuation of equity awards. |
| (3) | Represents expense in 2006 for options to purchase 702,400 shares of our common stock issued under our 2004 Equity Incentive Plan. |
| (4) | Represents expense in 2006 for options to purchase 85,000 shares of our common stock issued under our 2004 Equity Incentive Plan. |
| (5) | Represents expense in 2006 for options to purchase 171,000 shares of our common stock issued under our 2004 Equity Incentive Plan. |
| (6) | Represents expense in 2006 for options to purchase 137,900 shares of our common stock issued under our 2004 Equity Incentive Plan. |
| (7) | Represents expense in 2006 for options to purchase 137,900 shares of our common stock issued under our 2004 Equity Incentive Plan. |
Grants of Plan Based Awards
The following table sets forth certain information with respect to the options granted during the fiscal year ended December 31, 2006 to each of our named executive officers:
| Name and Principal Position |
Grant Date |
All Other Option Awards: Number of Securities Underlying Options (#) |
Exercise or Base Price of Option Awards ($/Sh) |
Grant Date Fair Value of Option Awards ($)(1)(2) | ||||||
| Chief Executive Officer |
||||||||||
| Manuel A. Henriquez |
06/16/06 | 97,400 | $ | 12.14 | $ | 124,800 | ||||
| Chief Financial Officer |
||||||||||
| David M. Lund |
06/16/06 | 45,000 | $ | 12.14 | 57,600 | |||||
| Chief Legal Officer |
||||||||||
| H. Scott Harvey |
06/16/06 | 30,000 | $ | 12.14 | 38,400 | |||||
| Senior Managing Director |
||||||||||
| Samir Bhaumik |
06/16/06 | 93,900 | $ | 12.14 | 120,300 | |||||
| Senior Managing Director |
||||||||||
| Parag I. Shah |
06/16/06 | 94,400 | $ | 12.14 | 120,900 | |||||
90
| (1) | Options generally vest 33% one year after the date of grant and ratably over the succeeding 24 months. All options may be exercised for a period ending seven years after the date of grant. |
| (2) | The amounts reported in the Option Awards column represents the grant date fair value of the stock option grants made to the Named Executive Officers during 2006 in accordance with the provisions of Statement of Financial Accounting Standards (“SFAS”) No. 123R, “Share-based Payments.” See “Critical Accounting Policies” section of the MD&A regarding assumptions underlying valuation of equity awards. |
Outstanding Equity Awards at Fiscal Year End
The following table shows outstanding incentive stock option awards classified as exercisable and unexercisable as of December 31, 2006 for each of the named executive officers:
| Name and Principal Position |
Number of Securities Underlying Unexercised Options (#) Exercisable (1) |
Number of Securities Underlying Unexercised Options (#) Unexercisable (2) |
Option Exercise Price ($) |
Option Expiration Date | |||||
| Chief Executive Officer |
|||||||||
| Manuel A. Henriquez |
125,000 | — | $ | 15.00 | 06/23/11 | ||||
| 302,500 | 302,500 | 13.00 | 06/17/12 | ||||||
| — | 97,400 | 12.14 | 06/16/13 | ||||||
| Chief Financial Officer |
|||||||||
| David M. Lund |
18,889 | 21,111 | 13.00 | 07/15/12 | |||||
| — | 45,000 | 12.14 | 06/16/13 | ||||||
| Chief Legal Officer |
|||||||||
| H. Scott Harvey |
12,821 | — | 15.00 | 06/23/11 | |||||
| 70,500 | 70,500 | 13.00 | 06/17/12 | ||||||
| — | 30,000 | 12.14 | 06/16/13 | ||||||
| Senior Managing Director |
|||||||||
| Samir Bhaumik |
4,500 | 1,500 | 15.00 | 12/13/11 | |||||
| 19,000 | 19,000 | 13.00 | 06/17/12 | ||||||
| — | 93,900 | 12.14 | 06/16/13 | ||||||
| Senior Managing Director |
|||||||||
| Parag I. Shah |
4,125 | 1,375 | 15.00 | 12/13/11 | |||||
| 19,000 | 19,000 | 13.00 | 06/17/12 | ||||||
| — | 94,400 | 12.14 | 06/16/13 | ||||||
| (1) | No options were exercised or transferred during the year ended December 31, 2006. |
| (2) | Options expiring in 2011 to Messrs. Henriquez and Harvey were 100% vested on the date of grant. Options to Messrs. Bhaumik and Shah expiring in 2011 were 25% vested one year after the date of grant and ratably over the succeeding 24 months. All other options vest 33% one year after the date of grant and ratably over the succeeding 24 months. All options may be exercised for a period ending seven years after the date of grant. |
2004 Equity Incentive Plan
Our Board of Directors and our stockholders have approved the 2006 Amendment and Restatement of the Hercules Technology Growth Capital, Inc. 2004 Equity Incentive Plan, for the purpose of attracting and retaining the services of executive officers, directors and other key employees. Under the 2004 Equity Incentive Plan, our Compensation Committee may award incentive stock options within the meaning of Section 422 of the Code, or ISOs, to employees, and nonstatutory stock options to employees and employee directors.
Under the 2004 Equity Incentive Plan, we have authorized for issuance up to 7,000,000 shares of common stock. Participants in the 2004 Equity Incentive Plan may receive awards of options to purchase our common stock, as determined by our Compensation Committee. Options granted under the 2004 Equity Incentive Plan
91
generally may be exercised for a period of no more than ten years from the date of grant unless the option agreement provides for an earlier expiration. Unless sooner terminated by our Board of Directors, the 2004 Equity Incentive Plan will terminate on the tenth anniversary of its adoption and no additional awards may be made under the 2004 Equity Incentive Plan after that date. The 2004 Equity Incentive Plan provides that all awards granted under the plan are subject to modification as required to ensure that such awards do not conflict with the requirements of the 1940 Act applicable to us.
Options granted under the 2004 Equity Incentive Plan will entitle the optionee, upon exercise, to purchase shares of common stock from us at a specified exercise price per share. ISOs must have a per share exercise price of no less than the fair market value of a share of stock on the date of the grant or, if the optionee owns or is treated as owning (under Section 424(d) of the Code) more than 10% of the total combined voting power of all classes of our stock, 110% of the fair market value of a share of stock on the date of the grant. Nonstatutory stock options granted under the 2004 Equity Incentive Plan must have a per share exercise price of no less than the fair market value of a share of stock on the date of the grant. Options will not be transferable other than by laws of descent and distribution, or in the case of nonstatutory stock options, by gift, and will generally be exercisable during an optionee’s lifetime only by the optionee.
Our Compensation Committee administers the 2004 Equity Incentive Plan and has the authority, subject to the provisions of the 2004 Equity Incentive Plan, to determine who will receive awards under the 2004 Equity Incentive Plan and the terms of such awards. Our Compensation Committee will have the authority to adjust the number of shares available for awards, the number of shares subject to outstanding awards and the exercise price for awards following the occurrence of events such as stock splits, dividends, distributions and recapitalizations. The exercise price of an option may be paid in the form of shares of stock that are already owned by such optionholder.
Upon specified covered transactions (as defined in the 2004 Equity Incentive Plan), all outstanding awards under the 2004 Equity Incentive Plan may either be assumed or substituted for by the surviving entity. If the surviving entity does not assume or substitute similar awards, the awards held by the participants will be accelerated in full and then terminated to the extent not exercised prior to the covered transaction.
2006 Non-Employee Director Plan
Our Board of Directors and stockholders have approved the 2006 Non-employee Director Plan (the “Director Plan”). Under current SEC rules and regulations applicable to business development companies, a business development company may not grant options to non-employee directors. On February 15, 2007, we received exemptive relief from the SEC to permit us to grant options to non-employee directors as a portion of their compensation for service on our Board. The following is a summary of the material features of the Director Plan.
The Company has instituted the Director Plan for the purpose of advancing the interests of the Company by providing for the grant of awards under the Director Plan to eligible non-employee Directors. The Director Plan authorizes the issuance of non-statutory stock options (“NSOs”) to non-employee Directors to purchase shares of common stock at a specified exercise price per share. NSOs granted under the Director Plan will have a per share exercise price of no less than the current market value of a share of stock as determined in good faith by the Board on the date of the grant.
Under the Director Plan, non-employee Directors will each receive an initial grant of an option, to purchase shares of common stock. In addition, options granted to the Company’s non-employee Directors will generally vest over two years, in equal installments on each of the first two anniversaries of the date of grant. The Compensation Committee has the authority to adjust the number of shares available for options, the number of shares subject to outstanding options under the Director Plan and the exercise price of options; provided,
92
however, that the exercise price of options granted under the Director Plan will not be adjusted unless the Company receives an exemptive order from the SEC or written confirmation from the staff of the SEC that the Company may do so (except for adjustments resulting from changes in the Company’s capital structure, such as stock dividends, stock splits and reverse stock splits).
Unless sooner terminated by the Board, the Director Plan will terminate on the tenth anniversary of its adoption and no additional awards may be made under the Director Plan after that date. The Director Plan provides that all awards granted under the Director Plan are subject to modification as required to ensure that such awards do not conflict with the requirements of the 1940 Act.
The Board will determine the period during which any options granted under the Director Plan shall remain exercisable, provided that no option will be exercisable after the expiration of ten years from the date on which it was granted. Options granted under the Director Plan are not transferable other than by will or the laws of descent and distribution, or by gift, and will generally be exercisable during a non-employee Director’s lifetime only by such non-employee Director. In general, any portion of any options that are not then exercisable will terminate upon the termination of the non-employee Director’s services to the Company. Generally, any portion of any options that are exercisable at the time of the termination of the non-employee Director’s services to the Company will remain exercisable for the lesser of (i) a period of three months (or one year if the non-employee Director’s services to the Company terminated by reason of the non-employee Director’s death) or (ii) the period ending on the latest date on which such options could have been exercised had the non-employee Director’s services to the Company not terminated. In addition, if the Board determines that a non-employee Director’s service to the Company terminated for reasons that cast such discredit on the non-employee Director as to justify immediate termination of the non-employee Director’s options, then all options then held by the non-employee Director will immediately terminate.
The Compensation Committee administers the Director Plan. Under the Director Plan, options may be granted from time-to-time for up to a maximum of 1,000,000 shares of common stock. No options have been issued pursuant to the Director Plan.
If there is a change in the capital structure of the Company by reason of a stock dividend, stock split or combination of shares (including a reverse stock split), recapitalization or other change in the Company’s capital structure, the Board will make appropriate adjustments to the number and class of shares of stock subject to the Director Plan and each option outstanding under it. In the event of a consolidation, merger, stock sale, a sale of all or substantially all of the Company’s assets, a dissolution or liquidation of the Company or other similar events (a “Covered Transaction”), the Board may provide for the assumption of some or all outstanding options or for the grant of new substitute options by the acquirer or survivor. If no such assumption or substitution occurs, all outstanding options will become exercisable prior to the Covered Transaction and will terminate upon consummation of the Covered Transaction.
On February 15, 2007, we received approval from the SEC to grant awards to our non-employee directors. We intend to award options under the Director Plan on an annual basis, though the amount of the options that may be granted are limited by the terms of the Director Plan, which prohibits any grant that would cause the Company to be in violation of Section 61(a)(3) of the 1940 Act.
The Board may at any time or times amend the Director Plan or any outstanding awards for any purpose which may at the time be permitted by law, and may at any time terminate the Director Plan as to any future grants of awards; provided, that except as otherwise expressly provided in the Director Plan the Board may not, without the participant’s consent, alter the terms of an award so as to affect adversely the participant’s rights under the award, unless the Board expressly reserved the right to do so at the time of the grant of the award.
We intend to issue options and restricted shares to each of Messrs. Badavas, Chow and Woodward.
93
Compensation of Portfolio Management Employees
The compensation of our portfolio management employees, including our investment committee, is set by the compensation committee of our Board of Directors. The portfolio management employees are compensated in the form of annual salaries, annual cash bonuses based on performance measured against specific goals and long-term compensation in the form of stock option grants.
94
CONTROL PERSONS AND PRINCIPAL STOCKHOLDERS
No person will be deemed to control us, as such term is defined in the 1940 Act.
The following table sets forth, as of May 8, 2007, information with respect to the beneficial ownership of our common stock by:
| • | each person known to us to beneficially own more than 5% of the outstanding shares of our common stock based on our records of ownership of our common stock as of the date of our initial public offer and filings submitted by these companies to the SEC regarding their ownership of our common stock. |
| • | each of our directors and each executive officer; and |
| • | all of our directors and executive officers as a group. |
Beneficial ownership is determined in accordance with the rules of the SEC and includes voting or investment power with respect to the securities. Common stock subject to options or warrants that are currently exercisable or exercisable within 60 days of May 8, 2007 are deemed to be outstanding and beneficially owned by the person holding such options or warrants. Such shares, however, are not deemed outstanding for the purposes of computing the percentage ownership of any other person. Percentage of beneficial ownership is based on 23,102,418 shares of common stock outstanding as of May 8, 2007.
Unless otherwise indicated, to our knowledge, each stockholder listed below has sole voting and investment power with respect to the shares beneficially owned by the stockholder, except to the extent authority is shared by spouses under applicable law, and maintains an address of c/o Hercules Technology Growth Capital, Inc., 400 Hamilton Avenue, Suite 310, Palo Alto, California 94301.
| Name and Address |
Shares of Common Stock Beneficially Owned |
||||
| Number of Shares |
Percentage of Class |
||||
| Principal Stockholders: |
|||||
| Farallon Capital Management, L.L.C.(1)(2) One Maritime Plaza, |
2,006,181 | 8.7 | % | ||
| T. Rowe Price Associates, Inc.(2) 100 E. Pratt Street |
1,631,668 | 7.1 | % | ||
| Dreman Value Management L.L.C.(2) Harbor Side Financial Center Plaza 10, |
1,474,567 | 6.4 | % | ||
| JMP Group LLC(2)(3) 600 Montgomery Street, |
1,342,411 | 5.8 | % | ||
| Jolson 1996 Trust(4) |
645,942 | 2.8 | % | ||
| (1) | Farallon Capital Management, L.L.C. may be deemed to beneficially own shares of our common stock held of record by certain investment funds affiliated with Farallon Capital Management, L.L.C. |
95
| (2) | Information about the beneficial ownership of our principal stockholders is derived from filings made by them with the SEC. |
| (3) | Includes 152,797 shares of common stock that can be acquired upon the exercise of outstanding 5-year warrants. JMP Group LLC may be deemed to beneficially own shares of our common stock, including shares of common stock issuable upon the exercise of outstanding 5-year warrants, held of record by certain investment funds for which its wholly-owned subsidiary, JMP Asset Management LLC, acts as either general partner or investment adviser. JMP Group LLC and JMP Asset Management LLC each disclaim beneficial ownership of all shares held of record by the funds to the extent attributable to partnership or equity interests therein held by persons other than JMP Group LLC, JMP Asset Management LLC, or their affiliates. Joseph A. Jolson serves as Chief Executive Officer of JMP Group LLC. |
| (4) | Includes 548,280 shares of our common stock and 52,994 shares of our common stock issuable upon the exercise of outstanding 5-year warrants held by the Jolson 1996 Trust. Joseph A. Jolson serves as the trustee of the Jolson 1996 Trust and, as a result, may be deemed to beneficially own such shares of common stock, including such 5-year warrants to purchase shares of common stock. This does not include 54,996 shares of our common stock and 9,008 shares of our common stock issuable upon the exercise of 5-year warrants held by the Jolson Family Foundation. Mr. Jolson may be deemed to beneficially own the shares of common stock, including the 5-year warrants to purchase common stock held of record by the Jolson Family Foundation, for which he serves as the President. Mr. Jolson disclaims beneficial ownership of all such shares held by the Jolson Family Foundation. |
| Name |
Shares of Common Stock Beneficially Owned |
||||
| Number of Shares |
Percentage of Class |
||||
| Interested Director |
|||||
| Manuel A. Henriquez(1) |
1,116,771 | 4.8 | % | ||
| Independent Directors |
|||||
| Robert P. Badavas |
13,668 | * | |||
| Joseph W. Chow(2) |
35,126 | * | |||
| Allyn C. Woodward, Jr. |
29,016 | * | |||
| Executive Officers |
|||||
| Samir Bhaumik(3) |
86,001 | * | |||
| James C. Crumpton |
— | — | |||
| H. Scott Harvey(4) |
131,105 | * | |||
| David M. Lund(5) |
43,881 | * | |||
| Parag I Shah (6) |
79,532 | * | |||
| Shane A. Stettenbenz(7) |
73,891 | * | |||
| Executive officers and directors as a group(8) |
1,608,990 | 7.0 | % | ||
| (1) | Includes 560,800 shares of common stock that can be acquired upon the exercise of outstanding options. Includes shares of our common stock held by certain trusts controlled by Mr. Henriquez. |
| (2) | Includes 794 shares of common stock that can be acquired upon the exercise of outstanding 5-year warrants. |
| (3) | Includes 3,797 shares of common stock that can be acquired upon the exercise of outstanding 5-year warrants and 61,321 shares of common stock that can be acquired upon the exercise of outstanding options. |
| (4) | Includes 4,279 shares of common stock that can be acquired upon the exercise of outstanding 5-year warrants and 116,821 shares of common stock that can be acquired upon the exercise of outstanding options. |
| (5) | Includes 40,556 shares of common stock that can be acquired upon the exercise of outstanding options. |
| (6) | Includes 2,994 shares of common stock that can be acquired upon the exercise of outstanding 5-year warrants and 61,097 shares of common stock that can be acquired upon the exercise of outstanding options. |
| (7) | Includes 71,667 shares of common stock that can be acquired upon the exercise of outstanding options. |
| (8) | Includes 11,864 shares of common stock that can be acquired upon the exercise of outstanding 5-year warrants and 912,261 shares of common stock that can be acquired upon the exercise of outstanding options. |
96
The following table sets forth as of May 8, 2007, the dollar range of our securities owned by our directors and portfolio management employees.
| Name |
Dollar Range of Equity Securities in the Company | |
| Independent Directors: |
||
| Robert P. Badavas |
over $100,000 | |
| Joseph W. Chow |
over $100,000 | |
| Allyn C. Woodward, Jr. |
over $100,000 | |
| Interested Director/Portfolio Management Employee: |
||
| Manuel A. Henriquez |
over $100,000 | |
| Portfolio Management Employees: |
||
| Samir Bhaumik |
over $100,000 | |
| James C. Crumpton |
0 | |
| H. Scott Harvey |
over $100,000 | |
| David M. Lund |
$10,001-$50,000 | |
| Shane A. Stettenbenz |
$10,001-$50,000 | |
| Parag I. Shah |
over $100,000 |
97
CERTAIN RELATIONSHIPS AND RELATED TRANSACTIONS
In December 2003, we entered into an engagement letter with JMP Securities LLC, the lead underwriter in our initial public offering. The engagement letter expired on June 16, 2004. Pursuant to the engagement letter, we offered to JMP Securities LLC the opportunity to act as the initial purchaser and placement agent in connection with our June 2004 private offering. As compensation for the services rendered, we agreed to pay to JMP Securities LLC an aggregate amount equal to 7% of the gross proceeds of the private offering, subject to limited exceptions in connection with sales of our securities to persons affiliated with us. In addition, we agreed to reimburse JMP Securities LLC, upon its request, for up to $150,000 of its reasonable out-of-pocket expenses. In accordance with the foregoing, we paid $1,343,619 in placement fees to JMP Securities LLC in connection with our June 2004 private placement. We have agreed to indemnify JMP Securities LLC, its affiliates and other related parties against certain liabilities, including liabilities under the Securities Act, and to contribute to payments that such persons may be required to make for these liabilities.
In February 2004, we issued and sold 400 shares of our Series A-1 preferred stock to JMP Group LLC, the ultimate parent entity of JMP Securities LLC, for an aggregate purchase price of $2.5 million and, in connection with such sale, we paid a $175,000 placement fee to JMP Securities LLC. In addition, we issued and sold 100 shares of our Series A-2 preferred stock to an entity related to Mr. Henriquez for an aggregate purchase price of $125,000, and we issued and sold 100 shares of our Series A-2 preferred stock to Mr. Howard for an aggregate purchase price of $125,000. Our Series A-1 preferred stock held a liquidation preference over our Series A-2 preferred stock and also carried separate, preferential voting rights. In June 2004, each share of Series A-1 preferred stock and Series A-2 preferred stock was exchanged for 208.3333 units with the same terms as the units sold in our June 2004 private offering.
In connection with the issuance of our Series A-1 preferred stock and Series A-2 preferred stock, we entered into a registration rights agreement with the holders of our Series A-1 preferred stock and Series A-2 preferred stock. In June 2004, in connection with the conversion of the Series A preferred stock, the registration rights agreement entered into in connection with the issuance of our preferred stock was terminated and the shares of our common stock issued upon conversion were included in the registration rights agreement entered into in connection with our June 2004 private offer. See “Description of Capital Stock—Registration Rights.”
We have entered into a letter agreement with Farallon Capital Management, L.L.C. that provides that prior to the date that is two years after certain investment funds controlled by Farallon Capital Management, L.L.C. cease to own at least 10% of our outstanding common stock and without the written consent of Farallon Capital Management, L.L.C., we will not (i) take any action to alter or repeal the resolution adopted by our board exempting from the Business Combination Act any business combination between us and certain investment funds managed by Farallon Capital Management, L.L.C. in a manner that would make the Business Combination Act applicable to acquisitions of our stock by such investment funds or (ii) amend the applicable provision of our bylaws in a manner that would make the Control Share Acquisition Act applicable to an acquisition of the Company’s common stock by investment funds controlled by Farallon Capital Management, L.L.C.
We have also entered into a letter agreement with JMP Asset Management LLC that provides that prior to the date that is two years after certain investment funds controlled by JMP Asset Management LLC cease to own at least 10% of our outstanding common stock and without the written consent of JMP Asset Management LLC that we will not (i) take any action to alter or repeal the resolution adopted by our board exempting from the Business Combination Act any business combination between us and certain investment funds managed by JMP Asset Management LLC in a manner that would make the Business Combination Act applicable to acquisitions of our stock by such investment funds or (ii) amend the applicable provision of our bylaws in a manner that would make the Control Share Acquisition Act applicable to an acquisition of the Company’s common stock by investment funds controlled by JMP Asset Management LLC.
In connection with our June 2004 private offering, we agreed to obtain the approval of each of JMP Asset Management LLC and Farallon Capital Management, L.L.C. for each investment made by us. Though this
98
arrangement was terminated in connection with our election to be regulated as a business development company, under the terms of the letter agreements described above, we have agreed to indemnify, to the maximum extent permitted by Maryland law and the 1940 Act, representatives of JMP Asset Management LLC and Farallon Capital Management, L.L.C. in connection with their activities in evaluating our investment opportunities prior to our election to be regulated as a business development company on terms similar to those afforded to our directors and officers under our charter and bylaws.
In accordance with a letter agreement dated June 22, 2004 between us and JMP Group LLC, in January 2005 we issued and sold 72,000 units to funds managed by JMP Asset Management LLC at a price equal to $30.00 per unit, less a $2.10 initial purchaser’s discount per unit.
On April 12, 2005, we entered into our Bridge Loan Credit Facility with Alcmene Funding, LLC, a special purpose entity affiliated with Farallon Capital Management, L.L.C., one of our significant stockholders. See “Management’s Discussion and Analysis of Financial Condition—Borrowings.” In connection with the closing of the Bridge Loan Credit Facility, we paid a $500,000 upfront fee and will be obligated to pay additional fees under the terms of the facility. On August 1, 2005, we amended our Bridge Loan Credit Facility. The amendment agreement extended the term of the loan to April 12, 2006, eliminated the loan extension fee, revised the interest rate effective August 1, 2005 to LIBOR plus 5.6% through December 31, 2005 and thereafter to 13.5% per annum, and amended certain collateral rights and financial covenants. The loan fees are being amortized over the remaining ten-month period. On March 6, 2006, we entered into an amendment of our Bridge Loan Facility pursuant to which we repaid $10 million to Alcmene Funding LLC, extended the maturity date to June 30, 2006 and decreased the interest rate to 10.86%. On May 10, 2006, we repaid the remaining $15.0 million of the Bridge Loan Credit Facility and paid a $500,000 loan fee due on maturity and all accrued and unpaid interest through the date of repayment. At December 31, 2006, the Bridge Loan Credit Facility was no longer outstanding.
At March 2, 2006, we entered into an agreement with various affiliates of Farallon Capital Management, L.L.C. to sell $5 million of common stock, priced at the net asset value on February 28, 2006. On March 20, 2006, we completed the sale of 432,900 shares of common stock to the Farallon funds at a price per share of $11.55, which was the net asset value per share at February 28, 2006.
On June 8, 2005, we entered into an Underwriting Agreement with JMP Securities LLC pursuant to which JMP Securities LLC purchased 4,200,000 shares of our common stock and served as the lead underwriter in our initial public offer.
In conjunction with the Company’s Rights offering completed on April 21, 2006, the Company agreed to pay JMP Securities LLC a fee of approximately $700,000 as co-manager of the offering.
In conjunction with the Company’s public offering completed on December 7, 2006, the Company agreed to pay JMP Securities LLC a fee of approximately $1.2 million as co-manager of the offering.
In August 2000, Mr. Henriquez acquired an interest in JMP Group LLC, the ultimate parent entity of the lead underwriter in our initial public offering. Mr. Henriquez’s interest represents approximately 0.1% of the fully-diluted equity of JMP Group LLC.
99
CERTAIN UNITED STATES FEDERAL INCOME TAX CONSIDERATIONS
The following discussion is a general summary of the material United States federal income tax considerations applicable to us and to an investment in our shares. This summary does not purport to be a complete description of the income tax considerations applicable to such an investment. For example, we have not described tax consequences that we assume to be generally known by investors or certain considerations that may be relevant to certain types of holders subject to special treatment under United States federal income tax laws, including stockholders subject to the alternative minimum tax, tax-exempt organizations, insurance companies, dealers in securities, pension plans and trusts, and financial institutions. This summary assumes that investors hold our common stock as capital assets (within the meaning of the Code). The discussion is based upon the Code, Treasury regulations, and administrative and judicial interpretations, each as in effect as of the date of this prospectus and all of which are subject to change, possibly retroactively, which could affect the continuing validity of this discussion. We have not sought and will not seek any ruling from the Internal Revenue Service regarding this offer. This summary does not discuss any aspects of United States estate or gift tax or foreign, state or local tax. It does not discuss the special treatment under United States federal income tax laws that could result if we invested in tax-exempt securities or certain other investment assets in which we do not currently intend to invest.
A “U.S. stockholder” generally is a beneficial owner of shares of our common stock who is for United States federal income tax purposes:
| • | a citizen or individual resident of the United States including an alien individual who is a lawful permanent resident of the United States or meets the “substantial presence” test under Section 7701(b) of the Code; |
| • | a corporation or other entity taxable as a corporation, for United States federal income tax purposes, created or organized in or under the laws of the United States or any political subdivision thereof; |
| • | a trust over which a court in the United States has primary supervision over its administration or over which United States persons have control; or |
| • | an estate, the income of which is subject to United States federal income taxation regardless of its source. |
A “Non-U.S. stockholder” is a beneficial owner of shares of our common stock that is not a U.S. stockholder.
If a partnership (including an entity treated as a partnership for United States federal income tax purposes) holds shares of our common stock, the tax treatment of a partner in the partnership will generally depend upon the status of the partner and the activities of the partnership. A prospective stockholder who is a partner of a partnership holding shares of our common stock should consult his, her or its tax advisors with respect to the purchase, ownership and disposition of shares of our common stock.
Tax matters are very complicated and the tax consequences to an investor of an investment in our shares will depend on the facts of his, her or its particular situation. We encourage investors to consult their own tax advisors regarding the specific consequences of such an investment, including tax reporting requirements, the applicability of federal, state, local and foreign tax laws, eligibility for the benefits of any applicable tax treaty and the effect of any possible changes in the tax laws.
Election to be Taxed as a Regulated Investment Company
In conjunction with the filing of our December 31, 2006 tax return, we will elect to be treated as a RIC under Subchapter M of the Code as of January 1, 2006. However, such an election and qualification to be treated
100
as a RIC and as eligible for RIC tax treatment requires that we comply with certain requirements contained in Subchapter M of the Code. For example, a RIC must meet certain requirements, including source-of income, asset diversification and income distribution requirements. The income-source requirement mandates that we receive 90% or more of our income from qualified earnings, typically referred to as “good income.” Qualified earnings may exclude such income as management fees received in connection with our SBIC or other potential outside managed funds and certain other fees.
Conversion to Regulated Investment Company Status
We operate to qualify as a regulated investment company, or RIC, under Subchapter M of Code. If we qualify as a regulated investment company and annually distribute to our stockholders in a timely manner at least 90% of our investment company taxable income, we will not be subject to federal income tax on the portion of our taxable income and capital gains we distribute to our shareholders. Taxable income generally differs from net income as defined by generally accepted accounting principles due to temporary and permanent timing differences in the recognition of income and expenses, returns of capital and net unrealized appreciation or depreciation.
We have met the criteria specified below to qualify as a RIC, and will elect to be treated as a RIC under Subchapter M of the Code with the filing of our federal tax return for 2006, which election will be effective as of January 1, 2006. As a RIC, we generally will not have to pay corporate taxes on any income we distribute to our stockholders as dividends, which allows us to reduce or eliminate our corporate level tax. Prior to the effective date of our RIC election, we were taxed as a regular corporation under Subchapter C of the Code. Immediately before the effective date of that election, we held assets (including intangible assets not reflected on the balance sheet, such as goodwill) with “built-in gain,” which are assets whose fair market value as of the effective date of the election exceeds their tax basis. We elected to recognize all of our net built-in gains at the time of the conversion and paid tax on the built-in gains with the filing of our 2005 tax return. In making this election, we marked our portfolio to market at the time of our RIC election and paid approximately $294,000 in tax on the resulting taxable income.
By December 31, 2006, we were required to distribute our accumulated earnings and profits while we were taxable as a C corporation. During 2006, we distributed $1.20 per share to our shareholders of which approximately $0.09 was deemed to be a distribution of these accumulated earnings and profits, $0.97 was deemed to be a distribution of income and $0.14 was a return of capital. The distribution of our income and our accumulated earnings and profits is considered ordinary income to our shareholders in 2006.
Taxation as a Regulated Investment Company
For any taxable year in which we:
| • | qualify as a RIC; and |
| • | distribute to our stockholders, for each taxable year, at least 90% of our “investment company taxable income,” which is generally our net ordinary income plus the excess, if any, of realized net short-term capital gains over realized net long-term capital losses (the “Annual Distribution Requirement”): |
we generally will not be subject to federal income tax on the portion of our investment company taxable income and net capital gain (i.e., net realized long-term capital gains in excess of net realized short-term capital losses) we distribute to stockholders with respect to that year. In addition, if we subsequently acquire built-in gain assets from a C corporation in a carryover basis transaction, then we may be subject to tax on the gains recognized by us on dispositions of such assets unless we make a special election to pay corporate-level tax on such built-in gain at the time the assets are acquired. We will be subject to United States federal income tax at the regular corporate rates on any income or capital gain not distributed (or deemed distributed) to our stockholders.
101
In order to qualify as a RIC for federal income tax purposes and obtain the tax benefits of RIC status, in addition to satisfying the Annual Distribution Requirement, we must, among other things:
| • | have in effect at all times during each taxable year an election to be regulated as a business development company under the 1940 Act; |
| • | derive in each taxable year at least 90% of our gross income from (a) dividends, interest, payments with respect to certain securities loans, gains from the sale of stock or other securities, or other income derived with respect to our business of investing in such stock or securities and (b) net income derived from an interest in a “qualified publicly traded limited partnership” (the “90% Income Test”); and |
| • | diversify our holdings so that at the end of each quarter of the taxable year: |
| • | at least 50% of the value of our assets consists of cash, cash equivalents, U.S. government securities, securities of other RICs, and other securities if such other securities of any one issuer do not represent more than 5% of the value of our assets or more than 10% of the outstanding voting securities of such issuer; and |
| • | no more than 25% of the value of our assets is invested in (i) securities (other than U.S. government securities or securities of other RICs) of one issuer, (ii) securities of two or more issuers that are controlled, as determined under applicable tax rules, by us and that are engaged in the same or similar or related trades or businesses or (iii) securities of one or more “qualified publicly traded partnerships” (the “Diversification Tests”). |
Qualified earnings may exclude such income as management fees received in connection with our SBIC or other potential outside managed funds and certain other fees.
As a RIC, we will be subject to a 4% nondeductible federal excise tax on certain undistributed income unless we distribute in a timely manner an amount at least equal to the sum of (1) 98% of our ordinary income for each calendar year, (2) 98% of our capital gain net income for the 1-year period ending October 31 in that calendar year and (3) any income realized, but not distributed, in the preceding year (the “Excise Tax Avoidance Requirement”). We will not be subject to excise taxes on amounts on which we are required to pay corporate income tax (such as retained net capital gains). We currently intend to make sufficient distributions each taxable year to satisfy the Excise Tax Avoidance Requirement.
We may be required to recognize taxable income in circumstances in which we do not receive cash. For example, if we hold debt obligations that are treated under applicable tax rules as having original issue discount (such as debt instruments with payment-in-kind interest or, in certain cases, increasing interest rates or issued with warrants), we must include in income each year a portion of the original issue discount that accrues over the life of the obligation, regardless of whether cash representing such income is received by us in the same taxable year. Because any original issue discount accrued will be included in our investment company taxable income for the year of accrual, we may be required to make a distribution to our stockholders in order to satisfy the Annual Distribution Requirement, even though we will not have received any corresponding cash amount.
Gain or loss realized by us from the sale or exchange of warrants acquired by us as well as any loss attributable to the lapse of such warrants generally will be treated as capital gain or loss. Such gain or loss generally will be long-term or short-term, depending on how long we held a particular warrant.
We are authorized to borrow funds and to sell assets in order to satisfy the Annual Distribution Requirement and the Excise Tax Avoidance Requirement (collectively, the “Distribution Requirements”). However, under the 1940 Act, we are not permitted to make distributions to our stockholders while our debt obligations and other senior securities are outstanding unless certain “asset coverage” tests are met. See “Regulation—Senior Securities; Coverage Ratio.” Moreover, our ability to dispose of assets to meet the Distribution Requirements may be limited by (1) the illiquid nature of our portfolio, or (2) other requirements relating to our status as a RIC,
102
including the Diversification Tests. If we dispose of assets in order to meet the Distribution Requirements, we may make such dispositions at times that, from an investment standpoint, are not advantageous.
Any transactions in options, futures contracts, hedging transactions, and forward contracts will be subject to special tax rules, the effect of which may be to accelerate income to us, defer losses, cause adjustments to the holding periods of our investments, convert long-term capital gains into short-term capital gains, convert short-term capital losses into long-term capital losses or have other tax consequences. These rules could affect the amount, timing and character of distributions to stockholders. We do not currently intend to engage in these types of transactions.
A RIC is limited in its ability to deduct expenses in excess of its “investment company taxable income” (which is, generally, ordinary income plus net realized short-term capital gains in excess of net realized long-term capital losses). If our expenses in a given year exceed investment company taxable income (e.g., as the result of large amounts of equity-based compensation), we would experience a net operating loss for that year. However, a RIC is not permitted to carry forward net operating losses to subsequent years. In addition, expenses can be used only to offset investment company taxable income, not net capital gain. Due to these limits on the deductibility of expenses, we may for tax purposes have aggregate taxable income for several years that we are required to distribute and that is taxable to our stockholders even if such income is greater than the aggregate net income we actually earned during those years. Such required distributions may be made from our cash assets or by liquidation of investments, if necessary. We may realize gains or losses from such liquidations. In the event we realize net capital gains from such transactions, you may receive a larger capital gain distribution than you would have received in the absence of such transactions.
Taxation of U.S. Stockholders
For federal income tax purposes, distributions by us generally are taxable to U.S. stockholders as ordinary income or capital gains. Distributions of our “investment company taxable income” (which is, generally, our ordinary income plus net realized short-term capital gains in excess of net realized long-term capital losses) will be taxable as ordinary income to U.S. stockholders to the extent of our current or accumulated earnings and profits, whether paid in cash or reinvested in additional common stock. For taxable years beginning on or before December 31, 2010, to the extent such distributions paid by us are attributable to dividends from U.S. corporations and certain qualified foreign corporations, such distributions may be designated by us as “qualified dividend income” eligible to be taxed in the hands of non-corporate stockholders at the rates applicable to long-term capital gains, provided holding period and other requirements are met at both the stockholder and company levels. In this regard, it is anticipated that distributions paid by us generally will not be attributable to dividends and, therefore, generally will not be qualified dividend income. Distributions of our net capital gains (which is generally our realized net long-term capital gains in excess of realized net short-term capital losses) properly designated by us as “capital gain dividends” will be taxable to a U.S. stockholder as long-term capital gains (currently at a maximum rate of 15%) in the case of individuals, trusts or estates, regardless of the U.S. stockholder’s holding period for his, her or its common stock and regardless of whether paid in cash or reinvested in additional common stock. Distributions in excess of our current and accumulated earnings and profits first will reduce a U.S. stockholder’s adjusted tax basis in such stockholder’s common stock and, after the adjusted basis is reduced to zero, will constitute capital gains to such U.S. stockholder.
We currently intend to retain some or all of our realized net long-term capital gains in excess of realized net short-term capital losses, but to designate the retained net capital gain as a “deemed distribution.” In that case, among other consequences, we will pay tax on the retained amount, each U.S. stockholder will be required to include his, her or its share of the deemed distribution in income as if it had been actually distributed to the U.S. stockholder, and the U.S. stockholder will be entitled to claim a tax credit equal to his, her or its allocable share of the tax paid thereon by us. The amount of the deemed distribution net of such tax will be added to the U.S. stockholder’s cost basis for his, her or its common stock. Since we expect to pay tax on any retained net
103
capital gains at our regular corporate tax rate, and since that rate is in excess of the maximum rate currently payable by individuals on long-term capital gains, the amount of tax that individual stockholders will be treated as having paid and for which they will receive a credit will exceed the tax they owe on the retained net capital gain. Such excess generally may be claimed as a credit against the U.S. stockholder’s other federal income tax obligations or may be refunded to the extent it exceeds a stockholder’s liability for federal income tax. A stockholder that is not subject to federal income tax or otherwise required to file a federal income tax return would be required to file a federal income tax return on the appropriate form in order to claim a refund for the taxes we paid. For federal income tax purposes, the tax basis of shares owned by a stockholder will be increased by an amount equal under current law to the difference between the amount of undistributed capital gains included in the stockholder’s gross income and the tax deemed paid by the stockholder as described in this paragraph. In order to utilize the deemed distribution approach, we must provide written notice to our stockholders prior to the expiration of 60 days after the close of the relevant taxable year. We cannot treat any of our investment company taxable income as a “deemed distribution.”
For purposes of determining (1) whether the Annual Distribution Requirement is satisfied for any year and (2) the amount of capital gain dividends paid for that year, we may, under certain circumstances, elect to treat a dividend that is paid during the following taxable year as if it had been paid during the taxable year in question. If we make such an election, the U.S. stockholder will still be treated as receiving the dividend in the taxable year in which the distribution is made. However, any dividend declared by us in October, November or December of any calendar year, payable to stockholders of record on a specified date in such a month and actually paid during January of the following year, will be treated as if it had been received by our U.S. stockholders on December 31 of the year in which the dividend was declared.
If an investor purchases shares of our common stock shortly before the record date of a distribution, the price of the shares will include the value of the distribution and the investor will be subject to tax on the distribution even though economically it may represent a return of his, her or its investment.
A stockholder generally will recognize taxable gain or loss if the stockholder sells or otherwise disposes of his, her or its shares of our common stock. Any gain arising from such sale or disposition generally will be treated as long-term capital gain or loss if the stockholder has held his, her or its shares for more than one year. Otherwise, it will be classified as short-term capital gain or loss. However, any capital loss arising from the sale or disposition of shares of our common stock held for six months or less will be treated as long-term capital loss to the extent of the amount of capital gain dividends received, or undistributed capital gain deemed received, with respect to such shares. In addition, all or a portion of any loss recognized upon a disposition of shares of our common stock may be disallowed if other shares of our common stock are purchased (whether through reinvestment of distributions or otherwise) within 30 days before or after the disposition. In such a case, the basis of the newly purchased shares will be adjusted to reflect the disallowed loss.
For taxable years beginning on or before December 31, 2010, individual U.S. stockholders are subject to a maximum federal income tax rate of 15% on their net capital gain (i.e. , the excess of realized net long-term capital gain over realized net short-term capital loss for a taxable year) including any long-term capital gain derived from an investment in our shares. Such rate is lower than the maximum rate on ordinary income currently payable by individuals. Corporate U.S. stockholders currently are subject to federal income tax on net capital gain at the maximum 35% rate also applied to ordinary income. Non-corporate stockholders with net capital losses for a year (i.e. , capital losses in excess of capital gains) generally may deduct up to $3,000 of such losses against their ordinary income each year; any net capital losses of a non-corporate stockholder in excess of $3,000 generally may be carried forward and used in subsequent years as provided in the Code. Corporate stockholders generally may not deduct any net capital losses for a year, but may carry back such losses for three years or carry forward such losses for five years.
We will send to each of our U.S. stockholders, as promptly as possible after the end of each calendar year, a notice detailing, on a per share and per distribution basis, the amounts includible in such U.S. stockholder’s
104
taxable income for such year as ordinary income and as long-term capital gain. In addition, the federal tax status of each year’s distributions generally will be reported to the Internal Revenue Service (including the amount of dividends, if any, eligible for the 15% “qualified dividend income” rate). Distributions may also be subject to additional state, local, and foreign taxes depending on a U.S. stockholder’s particular situation. Dividends distributed by us generally will not be eligible for the corporate dividends-received deduction or the preferential rate applicable to “qualified dividend income.”
In some taxable years, we may be subject to the alternative minimum tax (“AMT”). If we have tax items that are treated differently for AMT purposes than for regular tax purposes, we may apportion those items between us and our stockholders, and this may affect our stockholder’s AMT liabilities. Although regulations explaining the precise method of apportionment have not yet been issued by the Internal Revenue Service, we may apportion these items in the same proportion that dividends paid to each stockholder bear to our taxable income (determined without regard to the dividends paid deduction), unless we determine that a different method for a particular item is warranted under the circumstances. You should consult your own tax advisor to determine how an investment in our stock could affect your AMT liability.
We may be required to withhold federal income tax (“backup withholding”), currently at a rate of 28%, from all taxable distributions to any non-corporate U.S. stockholder (1) who fails to furnish us with a correct taxpayer identification number or a certificate that such stockholder is exempt from backup withholding, or (2) with respect to whom the Internal Revenue Service (the “IRS”) notifies us that such stockholder has failed to properly report certain interest and dividend income to the IRS and to respond to notices to that effect. An individual’s taxpayer identification number is his or her social security number. Any amount withheld under backup withholding is allowed as a credit against the U.S. stockholder’s federal income tax liability, provided that proper information is provided to the IRS.
Taxation of Non-U.S. Stockholders
Whether an investment in the shares is appropriate for a Non-U.S. stockholder will depend upon that person’s particular circumstances. An investment in the shares by a Non-U.S. stockholder may have adverse tax consequences. Non-U.S. stockholders should consult their tax advisors before investing in our common stock.
In general, dividend distributions (other than certain distributions derived from net long-term capital gains) paid by us to a Non-U.S. stockholder are subject to withholding of U.S. federal income tax at a rate of 30% (or lower applicable treaty rate) even if they are funded by income or gains (such as portfolio interest, short-term capital gains, or foreign-source dividend and interest income) that, if paid to a Non-U.S. stockholder directly, would not be subject to withholding. If the distributions are effectively connected with a U.S. trade or business of the Non-U.S. stockholder, (and, if an income tax treaty applies, attributable to a permanent establishment in the United States), we will not be required to withhold federal tax if the Non-U.S. stockholder complies with applicable certification and disclosure requirements, although the distributions will be subject to federal income tax at the rates applicable to U.S. stockholders. (Special certification requirements apply to a Non-U.S. stockholder that is a foreign partnership or a foreign trust, and such entities are urged to consult their own tax advisors.)
For taxable years beginning prior to January 1, 2008, except as provided below, we generally will not be required to withhold any amounts with respect to certain distributions of (i) U.S.-source interest income, and (ii) net short-term capital gains in excess of net long-term capital losses, in each case to the extent we properly designate such distributions. We may or may not make any such designations. In respect of distributions described in clause (i) above, we will be required to withhold amounts with respect to distributions to a Non-U.S. stockholder:
| • | that has not provided a satisfactory statement that the beneficial owner is not a U.S. person; |
105
| • | to the extent that the dividend is attributable to certain interest on an obligation if the Non-U.S. stockholder is the issuer or is a 10% stockholder of the issuer; |
| • | that is within certain foreign countries that have inadequate information exchange with the United States; or |
| • | to the extent the dividend is attributable to interest paid by a person that is a related person of the Non-U.S. stockholder and the Non-U.S. stockholder is a “controlled foreign corporation” for United States federal income tax purposes. |
The cash dividend(s) we intend to pay to our stockholders representing all of our accumulated earnings and profits, if any, for the period from our inception through the effective date of our election to be treated as a RIC, generally will be taxable to Non-U.S. stockholders in the same manner as other dividend distributions described above.
Actual or deemed distributions of our net capital gains to a Non-U.S. stockholder, and gains realized by a Non-U.S. stockholder upon the sale of our common stock, will not be subject to federal withholding tax and generally will not be subject to federal income tax unless the distributions or gains, as the case may be, are effectively connected with a U.S. trade or business of the Non-U.S. stockholder (and, if an income tax treaty applies, are attributable to a permanent establishment maintained by the Non-U.S. stockholder in the U.S.), or in the case of an individual stockholder, the stockholder is present in the U.S. for a period or periods aggregating 183 days or more during the year of the sale or capital gain dividend and certain other conditions are met.
If we distribute our net capital gains in the form of deemed rather than actual distributions, a Non-U.S. stockholder will be entitled to a federal income tax credit or tax refund equal to the stockholder’s allocable share of the tax we pay on the capital gains deemed to have been distributed. In order to obtain the refund, the Non-U.S. stockholder must obtain a U.S. taxpayer identification number and file a federal income tax return even if the Non-U.S. stockholder would not otherwise be required to obtain a U.S. taxpayer identification number or file a federal income tax return. For a corporate Non-U.S. stockholder, distributions (both actual and deemed), and gains realized upon the sale of our common stock that are effectively connected to a U.S. trade or business may, under certain circumstances, be subject to an additional “branch profits tax” at a 30% rate (or at a lower rate if provided for by an applicable treaty). Accordingly, investment in the shares may not be appropriate for a Non-U.S. stockholder.
A Non-U.S. stockholder who is a non-resident alien individual, and who is otherwise subject to withholding of federal tax, may be subject to information reporting and backup withholding of federal income tax on dividends unless the Non-U.S. stockholder provides us or the dividend paying agent with an IRS Form W-8BEN (or an acceptable substitute or successor form) or otherwise meets documentary evidence requirements for establishing that it is a Non-U.S. stockholder or otherwise establishes an exemption from backup withholding.
Non-U.S. persons should consult their own tax advisors with respect to the United States federal income tax and withholding tax, and state, local and foreign tax consequences of an investment in the shares.
Failure to Qualify as a Regulated Investment Company
If we were unable to qualify for treatment as a RIC, we would be subject to tax on all of our taxable income at regular corporate rates. We would not be able to deduct distributions to stockholders, nor would they be required to be made. Such distributions (if made in a taxable year beginning on or before December 31, 2010) would be taxable to our stockholders and, provided certain holding period and other requirements were met, could qualify for treatment as “qualified dividend income” eligible for the 15% maximum rate to the extent of our current and accumulated earnings and profits. Subject to certain limitations under the Code, corporate distributees would be eligible for the dividends-received deduction. Distributions in excess of our current and
106
accumulated earnings and profits would be treated first as a return of capital to the extent of the stockholder’s tax basis, and any remaining distributions would be treated as a capital gain. To requalify as a RIC in a subsequent taxable year, we would be required to satisfy the RIC qualification requirements for that year and dispose of any earnings and profits from any year in which we failed to qualify as a RIC. Subject to a limited exception applicable to RICs that qualified as such under Subchapter M of the Code for at least one year prior to disqualification and that requalify as a RIC no later than the second year following the nonqualifying year, we could be subject to tax on any unrealized net built-in gains in the assets held by us during the period in which we failed to qualify as a RIC that are recognized within the subsequent 10 years, unless we made a special election to pay corporate-level tax on such built-in gain at the time of our requalification as a RIC.
107
The following discussion is a general summary of the material prohibitions and descriptions governing business development companies generally. It does not purport to be a complete description of all of the laws and regulations affecting business development companies.
We have elected to be treated as a business development company under the 1940 Act and will elect to be treated as a RIC under Subchapter M of the Code as of January 1, 2006. A business development company is a unique kind of investment company that primarily focuses on investing in or lending to private companies and making managerial assistance available to them. A business development company provides stockholders with the ability to retain the liquidity of a publicly-traded stock, while sharing in the possible benefits of investing in emerging-growth or expansion-stage privately-owned companies. The 1940 Act contains prohibitions and restrictions relating to transactions between business development companies and their directors and officers and principal underwriters and certain other related persons and requires that a majority of the directors be persons other than “interested persons,” as that term is defined in the 1940 Act. In addition, the 1940 Act provides that we may not change the nature of our business so as to cease to be, or to withdraw our election as, a business development company unless approved by a majority of our outstanding voting securities. A majority of the outstanding voting securities of a company is defined under the 1940 Act as the lesser of: (i) 67% or more of such company’s shares present at a meeting if more than 50% of the outstanding shares of such company are present or represented by proxy, or (ii) more than 50% of the outstanding shares of such company.
Qualifying Assets
Under the 1940 Act, a business development company may not acquire any asset other than assets of the type listed in Section 55(a) of the 1940 Act, which are referred to as qualifying assets, unless, at the time the acquisition is made, qualifying assets represent at least 70% of the company’s total assets. The principal categories of qualifying assets relevant to our proposed business are the following:
| (1) | Securities purchased in transactions not involving any public offering from the issuer of such securities, which issuer (subject to certain limited exceptions) is an eligible portfolio company, or from any person who is, or has been during the preceding 13 months, an affiliated person of an eligible portfolio company, or from any other person, subject to such rules as may be prescribed by the SEC. An eligible portfolio company is defined in the 1940 Act as any issuer which: |
| (a) | is organized under the laws of, and has its principal place of business in, the United States; |
| (b) | is not an investment company (other than a small business investment company wholly owned by the business development company) or a company that would be an investment company but for certain exclusions under the 1940 Act; and |
| (c) | does not have any class of securities listed on a national securities exchange. |
| (2) | Securities of any eligible portfolio company which we control. |
| (3) | Securities purchased in a private transaction from a U.S. issuer that is not an investment company or from an affiliated person of the issuer, or in transactions incident thereto, if the issuer is in bankruptcy and subject to reorganization or if the issuer, immediately prior to the purchase of its securities was unable to meet its obligations as they came due without material assistance other than conventional lending or financing arrangements. |
| (4) | Securities of an eligible portfolio company purchased from any person in a private transaction if there is no ready market for such securities and we already own 60% of the outstanding equity of the eligible portfolio company. |
| (5) | Securities received in exchange for or distributed on or with respect to securities described in (1) through (4) above, or pursuant to the exercise of warrants or rights relating to such securities. |
108
| (6) | Cash, cash equivalents, U.S. Government securities or high-quality debt securities maturing in one year or less from the time of investment. |
Significant Managerial Assistance
A business development company must have been organized and have its principal place of business in the United States and must be operated for the purpose of making investments in the types of securities described above. However, in order to count portfolio securities as qualifying assets for the purpose of the 70% test, the business development company must either control the issuer of the securities or must offer to make available to the issuer of the securities (other than companies that have total assets of not more than $4,000,000 and capital surplus (shareholders’ equity less retained earnings) of not less than $2,000,000) significant managerial assistance; except that, where the business development company purchases such securities in conjunction with one or more other persons acting together, one of the other persons in the group may make available such managerial assistance. Making available significant managerial assistance means, among other things, any arrangement whereby the business development company, through its directors, officers or employees, offers to provide and, if accepted, does so provide, significant guidance and counsel concerning the management, operations or business objectives and policies of a portfolio company through monitoring of portfolio company operations, selective participation in board and management meetings, consulting with and advising a portfolio company’s officers or other organizational or financial guidance.
Temporary Investments
Pending investment in other types of qualifying assets, as described above, our investments may consist of cash, cash equivalents, U.S. government securities or high quality debt securities maturing in one year or less from the time of investment, which we refer to, collectively, as temporary investments, so that 70% of our assets are qualifying assets. Typically, we will invest in U.S. treasury bills or in repurchase agreements, provided that such agreements are fully collateralized by cash or securities issued by the U.S. government or its agencies. A repurchase agreement involves the purchase by an investor, such as us, of a specified security and the simultaneous agreement by the seller to repurchase it at an agreed upon future date and at a price which is greater than the purchase price by an amount that reflects an agreed-upon interest rate. There is no percentage restriction on the proportion of our assets that may be invested in such repurchase agreements. However, if more than 25% of our total assets constitute repurchase agreements from a single counterparty, we would not meet the diversification tests imposed on us by the Code in order to qualify as a RIC for federal income tax purposes. Thus, we do not intend to enter into repurchase agreements with a single counterparty in excess of this limit. We will monitor the creditworthiness of the counterparties with which we enter into repurchase agreement transactions.
Warrants and Options
Under the 1940 Act, a business development company is subject to restrictions on the amount of warrants, options or rights to purchase shares of capital stock that it may have outstanding at any time. In particular, the amount of capital stock that would result from the conversion or exercise of all outstanding warrants, options or rights to purchase capital stock cannot exceed 25% of the business development company’s total outstanding shares of capital stock. This amount is reduced to 20% of the business development company’s total outstanding shares of capital stock if the amount of warrants, options or rights issued pursuant to an executive compensation plan would exceed 15% of the business development company’s total outstanding shares of capital stock.
Senior Securities; Coverage Ratio
We will be permitted, under specified conditions, to issue multiple classes of indebtedness and one class of stock senior to our common stock if our asset coverage, as defined in the 1940 Act, is at least equal to 200%
109
immediately after each such issuance. In addition, while any senior securities remain outstanding, we must make provisions to prohibit any dividend distribution to our stockholders or the repurchase of such securities or shares unless we meet the applicable asset coverage ratios at the time of the dividend distribution or repurchase. We may also borrow amounts up to 5% of the value of our total assets for temporary or emergency purposes. For a discussion of the risks associated with the resulting leverage, see “Risk Factors — Because we borrow money, there would be increased risk in investing in our company.”
Code of Ethics
We have adopted and will maintain a code of ethics pursuant to Rule 17j-1 under the 1940 Act that establishes procedures for personal investments and restricts certain personal securities transactions. Personnel subject to the code may invest in securities for their personal investment accounts, including securities that may be purchased or held by us, so long as such investments are made in accordance with the code’s requirements. Our code of ethics will generally not permit investments by our employees in securities that may be purchased or held by us. We may be prohibited under the 1940 Act from conducting certain transactions with our affiliates without the prior approval of our directors who are not interested persons and, in some cases, the prior approval of the SEC.
Our code of ethics was filed with the SEC as an exhibit to the registration statement (Registration No. 333-126604) for our initial public offering. You may read and copy the code of ethics at the SEC’s Public Reference Room in Washington, D.C. You may obtain information on the operation of the Public Reference Room by calling the SEC at 1-202-942-8090. In addition, the code of ethics is available on the EDGAR Database on the SEC’s Internet site at http://www.sec.gov. You may obtain copies of the code of ethics, after paying a duplicating fee, by electronic request at the following email address: publicinfo@sec.gov, or by writing the SEC’s Public Reference Section, Washington, D.C. 20549.
Privacy Principles
We are committed to maintaining the privacy of our stockholders and safeguarding their non-public personal information. The following information is provided to help you understand what personal information we collect, how we protect that information and why, in certain cases, we may share information with select other parties.
Generally, we do not receive any non-public personal information relating to our stockholders, although certain non-public personal information of our stockholders may become available to us. We do not disclose any non-public personal information about our stockholders or former stockholders to anyone, except as permitted by law or as is necessary in order to service stockholder accounts (for example, to a transfer agent).
We restrict access to non-public personal information about our stockholders to our employees with a legitimate business need for the information. We maintain physical, electronic and procedural safeguards designed to protect the non-public personal information of our stockholders.
Proxy Voting Policies and Procedures
We vote proxies relating to our portfolio securities in the best interest of our stockholders. We review on a case-by-case basis each proposal submitted to a stockholder vote to determine its impact on the portfolio securities held by us. Although we generally vote against proposals that may have a negative impact on our portfolio securities, we may vote for such a proposal if there exists compelling long-term reasons to do so.
110
Our proxy voting decisions are made by our investment committee, which is responsible for monitoring each of our investments. To ensure that our vote is not the product of a conflict of interest, we require that: (i) anyone involved in the decision making process disclose to our Chief Compliance Officer any potential conflict that he or she is aware of and any contact that he or she has had with any interested party regarding a proxy vote; and (ii) employees involved in the decision making process or vote administration are prohibited from revealing how we intend to vote on a proposal in order to reduce any attempted influence from interested parties.
Exemptive Relief
On June 21, 2005, we applied for exemptive relief from the SEC to permit us to grant options to purchase shares of our common stock to our non-employee directors as a portion of their compensation for service on our Board and on February 15, 2007, we received approval from the SEC on this exemptive request. No stock options were granted to our non-employee directors as of December 31, 2006.
On July 7, 2006, we applied for exemptive relief with the SEC in order to permit us to issue restricted stock pursuant to the 2004 Equity Incentive Plan and our 2006 Non-Employee Director Plan (together, the “Plans”). The SEC has commenced its review of the exemptive application and we are currently responding to questions on the relief request, but as of the date hereof, we have not received approval of the application and accordingly cannot evaluate when or if an order regarding our application may be granted.
In addition, on September 28, 2005, we filed an exemptive relief application requesting that the SEC permit us to exclude the indebtedness that our wholly-owned subsidiary, Hercules Technology II, L.P., which is qualified as a small business investment company, issues to the Small Business Administration from the 200% asset coverage requirement applicable to us. We received the exemptive order on April 5, 2007.
Other
We will be periodically examined by the SEC for compliance with the 1934 Act and the 1940 Act.
We are required to provide and maintain a bond issued by a reputable fidelity insurance company to protect us against larceny and embezzlement. Furthermore, as a business development company, we are prohibited from protecting any director or officer against any liability to our stockholders arising from willful misfeasance, bad faith, gross negligence or reckless disregard of the duties involved in the conduct of such person’s office.
We are required to adopt and implement written policies and procedures reasonably designed to prevent violation of the federal securities laws, review these policies and procedures annually for their adequacy and the effectiveness of their implementation. We have designated Mr. Harvey, our Chief Legal Officer, to be our Chief Compliance Officer to be responsible for administering these policies and procedures.
Small Business Administration Regulations
In January 2005, we formed HTII and HTM. On September 27, 2006, HTII received final approval to be licensed as a Small Business Investment Company (“SBIC”). HTII is able to borrow funds from the Small Business Administration against eligible pre-approved investments and additional deposits to regulatory capital. The Small Business Investment Company regulations currently limit the amount that is available to borrow by any SBIC to $127.2 million, subject to periodic adjustments by the SBA. There is no assurance that we will draw up to the maximum limit available under the Small Business Investment Company program.
111
Small business investment companies are designed to stimulate the flow of private equity capital to eligible small businesses. Under present Small Business Administration regulations, eligible small businesses include businesses that have a tangible net worth not exceeding $18 million and have average annual fully taxed net income not exceeding $6 million for the two most recent fiscal years. In addition, a small business investment company must devote 20% of its investment activity to “smaller” concerns as defined by the Small Business Administration. A smaller concern is one that has a tangible net worth not exceeding $6 million and has average annual fully taxed net income not exceeding $2 million for the two most recent fiscal years. Small Business Administration regulations also provide alternative size standard criteria to determine eligibility, which depend on the industry in which the business is engaged and are based on such factors as the number of employees and gross sales. According to Small Business Administration regulations, small business investment companies may make long-term loans to small businesses, invest in the equity securities of such businesses and provide them with consulting and advisory services. Through our wholly-owned subsidiary HTII, we plan to provide long-term loans to qualifying small businesses, and in connection therewith, make equity investments.
Our investment committee process is generally the same at the SBIC except that Parag Shah and Sam Bhaumik are also members of the Committee. Messrs. Shah and Bhaumik abstain from voting with respect to investments they originate.
HTII will be periodically examined and audited by the Small Business Administration’s staff to determine its compliance with small business investment company regulations. On January 30, 2007, HTII received notification that its initial application for leverage under its SBC license was approved allowing HTII to commence drawing up to $50.0 million of leverage under its first tranche of capital from the SBA. On April 26, 2007, we received our first borrowing of $12.0 million under the program. In May 2007, we submitted an application for approval to borrow an additional $77.2 million under the program.
112
We have adopted a dividend reinvestment plan (the “DRP”), through which all dividend distributions are paid to our stockholders in the form of additional shares of our common stock, unless a stockholder elects to receive cash as provided below. In this way, a stockholder can maintain an undiluted investment in our common stock and still allow us to pay out the required distributable income.
No action is required on the part of a registered stockholder to receive a dividend distribution in shares of our common stock. A registered stockholder may elect to receive an entire dividend distribution in cash by notifying American Stock Transfer & Trust Company, the plan administrator and our transfer agent and registrar, so that such notice is received by the plan administrator no later than 3 days prior to the payment date for dividend distributions to stockholders. The plan administrator will set up an account for shares acquired through the DRP for each stockholder who has not elected to receive distributions in cash (each a “Participant”) and hold such shares in non-certificated form. Upon request by a Participant, received not less than 3 days prior to the payment date, the plan administrator will, instead of crediting shares to the Participant’s account, issue a certificate registered in the Participant’s name for the number of whole shares of our common stock and a check for any fractional share.
Those stockholders whose shares are held by a broker or other financial intermediary may receive distributions in cash by notifying their broker or other financial intermediary of their election.
We expect to use primarily newly-issued shares to implement the DRP, whether our shares are trading at a premium or at a discount to net asset value. The number of shares to be issued to a stockholder is determined by dividing the total dollar amount of the dividend distribution payable to such stockholder by the market price per share of our common stock at the close of regular trading on the Nasdaq Global Market on the valuation date for such dividend distribution. Market price per share on that date will be the closing price for such shares on the Nasdaq Global Market or, if no sale is reported for such day, at the average of their electronically-reported bid and asked prices. The number of shares of our common stock to be outstanding after giving effect to payment of the distribution cannot be established until the value per share at which additional shares will be issued has been determined and elections of our stockholders have been tabulated.
There is no charge to our stockholders for receiving their dividend distributions in the form of additional shares of our common stock. The plan administrator’s fees for handling dividend distributions in stock are paid by us. There are no brokerage charges with respect to shares we have issued directly as a result of dividend distributions payable in stock. If a Participant elects by internet or by written or telephonic notice to the plan administrator to have the plan administrator sell part or all of the shares held by the plan administrator in the Participant’s account and remit the proceeds to the Participant, the plan administrator is authorized to deduct a $15.00 transaction fee plus brokerage commissions from the proceeds.
Any shares issued in connection with a stock split or stock dividend will be added to a Participant’s account with the Plan Administrator. The Plan Administrator may curtail or suspend transaction processing until the completion of such stock split or payment of such stock dividend.
Stockholders who receive dividend distributions in the form of stock generally are subject to the same federal, state and local tax consequences as are stockholders who elect to receive their dividend distributions in cash. A stockholder’s basis for determining gain or loss upon the sale of stock received in a dividend distribution from us will be equal to the total dollar amount of the dividend distribution payable to the stockholder.
The DRP may be terminated by us upon notice in writing mailed to each Participant at least 30 days prior to any record date for the payment of any dividend distribution by us. All correspondence concerning the DRP, including requests for additional information, should be directed to the plan administrator by mail at American Stock Transfer & Trust Company, Attn: Dividend Reinvestment Department, P.O. Box 922, Wall Street Station, New York, NY 10269-0560 or by phone at 1-866-669-9888.
113
The following description is based on relevant portions of the Maryland General Corporation Law and on our charter and bylaws. This summary may not contain all of the information that is important to you, and we refer you to the Maryland General Corporation Law and our charter and bylaws for a more detailed description of the provisions summarized below.
Under the terms of our charter, our authorized capital stock consists of 60,000,000 shares of common stock, par value $0.001 per share, of which 23,102,418 shares are outstanding as of May 8, 2007. Under our charter, our Board of Directors is authorized to classify and reclassify any unissued shares of stock into other classes or series of stock, and to cause the issuance of such shares, without obtaining stockholder approval. In addition, as permitted by the Maryland General Corporation Law, but subject to the 1940 Act, our charter provides that the Board of Directors, without any action by our stockholders, may amend the charter from time to time to increase or decrease the aggregate number of shares of stock or the number of shares of stock of any class or series that we have authority to issue. Under Maryland law, our stockholders generally are not personally liable for our debts or obligations.
| Title of Class |
Amount Authorized |
Amount Held by Company for its Account |
Amount Outstanding | |||
| Common Stock, $0.001 par value per share |
60,000,000 | — | 23,102,418 |
Common Stock
All shares of our common stock have equal rights as to earnings, assets, dividends and voting privileges, except as described below and, when they are issued, will be duly authorized, validly issued, fully paid and nonassessable.
Distributions may be paid to the holders of our common stock if, as and when authorized by our Board of Directors and declared by us out of assets legally available therefor. Shares of our common stock have no conversion, exchange, preemptive or redemption rights. In the event of a liquidation, dissolution or winding up of Hercules Technology Growth Capital each share of our common stock would be entitled to share ratably in all of our assets that are legally available for distribution after we pay all debts and other liabilities and subject to any preferential rights of holders of our preferred stock, if any preferred stock is outstanding at such time. Each share of our common stock is entitled to one vote on all matters submitted to a vote of stockholders, including the election of directors. Except as provided with respect to any other class or series of stock, the holders of our common stock will possess exclusive voting power. There is no cumulative voting in the election of directors, which means that holders of a majority of the outstanding shares of common stock will elect all of our directors, and holders of less than a majority of such shares will be unable to elect any director.
Preferred Stock
Our charter authorizes our Board of Directors to classify and reclassify any unissued shares of stock into other classes or series of stock, including preferred stock. Prior to issuance of shares of each class or series, the Board of Directors is required by Maryland law and by our charter to set the terms, preferences, conversion or other rights, voting powers, restrictions, limitations as to dividends or other distributions, qualifications and terms or conditions of redemption for each class or series. Thus, the Board of Directors could authorize the issuance of shares of preferred stock with terms and conditions which could have the effect of delaying, deferring or preventing a transaction or a change in control that might involve a premium price for holders of our common stock or otherwise be in their best interest. You should note, however, that any issuance of preferred stock must comply with the requirements of the 1940 Act. The 1940 Act requires, among other things, that (1) immediately
114
after issuance and before any dividend or other distribution is made with respect to our common stock and before any purchase of common stock is made, such preferred stock together with all other senior securities must not exceed an amount equal to 50% of our total assets after deducting the amount of such dividend, distribution or purchase price, as the case may be, and (2) the holders of shares of preferred stock, if any are issued, must be entitled as a class to elect two directors at all times and to elect a majority of the directors if dividends on such preferred stock are in arrears by two years or more. Certain matters under the 1940 Act require the separate vote of the holders of any issued and outstanding preferred stock. We believe that the availability for issuance of preferred stock will provide us with increased flexibility in structuring future financings and acquisitions.
5-Year Warrants
As of March 31, 2007, we had outstanding 5-year warrants to purchase an aggregate of 393,664 shares of our common stock. These warrants were issued as part of the units that we sold in our prior private financings and were issued either under our warrant agreement with American Stock Transfer & Trust Company, as warrant agent, or pursuant to the terms of our 2004 Equity Incentive Plan. Each 5-year warrant is exercisable until June 17, 2009 and entitles the holder thereof to purchase one share of our common stock. In connection with our election to be regulated as a business development company, the exercise price per share for all of our 5-year warrants was reduced from $15.00 per share to $10.57 per share, the net asset value per share of our common stock on the date of determination, in accordance with the terms of the warrant agreement or the applicable warrant certificate. In addition, the warrant agreement, restricts the transfer of warrants outstanding thereunder to transactions involving the transfer of at least 4,000 shares (or securities convertible into or exchangeable for shares) of our common stock.
Registration Rights
Pursuant to the registration rights agreement we entered on March 2, 2006, we agreed to register for resale the 432,900 shares of common stock purchased by Farallon Capital Management, L.L.C. and its affiliated funds. Such shares are included in the registration statement of which this prospectus is a part. See “Selling Shareholders.” The registration rights agreement also permits the Farallon funds to include any shares of common stock they hold in future underwritten public offerings of our equity securities, subject to certain limitations.
Limitation on Liability of Directors and Officers; Indemnification and Advance of Expenses
Maryland law permits a Maryland corporation to include in its charter a provision limiting the liability of its directors and officers to the corporation and its stockholders for money damages except for liability resulting from (a) actual receipt of an improper benefit or profit in money, property or services or (b) active and deliberate dishonesty established by a final judgment as being material to the cause of action. Our charter contains such a provision which eliminates directors’ and officers’ liability to the maximum extent permitted by Maryland law, subject to the requirements of the 1940 Act.
Our charter authorizes us, to the maximum extent permitted by Maryland law and subject to the requirements of the 1940 Act, to indemnify any present or former director or officer or any individual who, while a director or officer and at our request, serves or has served another corporation, real estate investment trust, partnership, joint venture, trust, employee benefit plan or other enterprise as a director, officer, partner or trustee, from and against any claim or liability to which such person may become subject or which such person may incur by reason of his or her service in any such capacity, except with respect to any matter as to which such person shall have been finally adjudicated in any proceeding not to have acted in good faith in the reasonable belief that their action was in our best interest or to be liable to us or our stockholders by reason of willful misfeasance, bad
115
faith, gross negligence or reckless disregard of the duties involved in the conduct of such person’s office. Our charter also provides that, to the maximum extent permitted by Maryland law, with the approval of our Board of Directors and provided that certain conditions described in our charter are met, we may pay certain expenses incurred by any such indemnified person in advance of the final disposition of a proceeding upon receipt of an undertaking by or on behalf of such indemnified person to repay amounts we have so paid if it is ultimately determined that indemnification of such expenses is not authorized under our charter. Our bylaws obligate us, to the maximum extent permitted by Maryland law and subject to the requirements of the 1940 Act, to indemnify any present or former director or officer or any individual who, while a director or officer and at our request, serves or has served another corporation, real estate investment trust, partnership, joint venture, trust, employee benefit plan or other enterprise as a director, officer, partner or trustee and who is made, or threatened to be made, a party to the proceeding by reason of his or her service in any such capacity from and against any claim or liability to which that person may become subject or which that person may incur by reason of his or her service in any such capacity, except with respect to any matter as to which such person shall have been finally adjudicated in any proceeding not to have acted in good faith in the reasonable belief that their action was in our best interest or to be liable to us or our stockholders by reason of willful misfeasance, bad faith, gross negligence or reckless disregard of the duties involved in the conduct of such person’s office. Our bylaws also provide that, to the maximum extent permitted by Maryland law, with the approval of our Board of Directors and provided that certain conditions described in our bylaws are met, we may pay certain expenses incurred by any such indemnified person in advance of the final disposition of a proceeding upon receipt of an undertaking by or on behalf of such indemnified person to repay amounts we have so paid if it is ultimately determined that indemnification of such expenses is not authorized under our bylaws.
Maryland law requires a corporation (unless its charter provides otherwise, which our charter does not) to indemnify a director or officer who has been successful in the defense of any proceeding to which he or she is made, or threatened to be made, a party by reason of his or her service in that capacity. Maryland law permits a corporation to indemnify its present and former directors and officers, among others, against judgments, penalties, fines, settlements and reasonable expenses actually incurred by them in connection with any proceeding to which they may be made, or threatened to be made, a party by reason of their service in those or other capacities unless it is established that (a) the act or omission of the director or officer was material to the matter giving rise to the proceeding and (1) was committed in bad faith or (2) was the result of active and deliberate dishonesty, (b) the director or officer actually received an improper personal benefit in money, property or services or (c) in the case of any criminal proceeding, the director or officer had reasonable cause to believe that the act or omission was unlawful. However, under Maryland law, a Maryland corporation may not indemnify for an adverse judgment in a suit by or in the right of the corporation or for a judgment of liability on the basis that a personal benefit was improperly received, unless in either case a court orders indemnification, and then only for expenses. In addition, Maryland law permits a corporation to advance reasonable expenses to a director or officer upon the corporation’s receipt of (a) a written affirmation by the director or officer of his or her good faith belief that he or she has met the standard of conduct necessary for indemnification by the corporation and (b) a written undertaking by him or her or on his or her behalf to repay the amount paid or reimbursed by the corporation if it is ultimately determined that the standard of conduct was not met.
In addition, we have agreed to indemnify, to the maximum extent permitted by Maryland law and the 1940 Act, representatives of JMP Asset Management LLC and Farallon Capital Management, L.L.C. on terms similar to those afforded to our directors and officers under our charter and bylaws in connection with their activities in evaluating our investment opportunities prior to our election to be regulated as a business development company.
We currently have in effect a directors’ and officers’ insurance policy covering our directors and officers and us for any acts and omissions committed, attempted or allegedly committed by any director or officer during the policy period. The policy is subject to customary exclusions.
116
Provisions of the Maryland General Corporation Law and Our Charter and Bylaws
The Maryland General Corporation Law and our charter and bylaws contain provisions that could make it more difficult for a potential acquiror to acquire us by means of a tender offer, proxy contest or otherwise. These provisions are expected to discourage certain coercive takeover practices and inadequate takeover bids and to encourage persons seeking to acquire control of us to negotiate first with our Board of Directors. We believe that the benefits of these provisions outweigh the potential disadvantages of discouraging any such acquisition proposals because, among other things, the negotiation of such proposals may improve their terms.
Classified Board of Directors
Our Board of Directors is divided into three classes of directors serving staggered three-year terms. The terms of the first, second and third classes will expire in 2006, 2007 and 2008, respectively. Beginning in 2005, upon expiration of their current terms, directors of each class will be elected to serve for three-year terms and until their successors are duly elected and qualify and each year one class of directors will be elected by the stockholders. A classified board may render a change in control of us or removal of our incumbent management more difficult. We believe, however, that the longer time required to elect a majority of a classified Board of Directors will help to ensure the continuity and stability of our management and policies.
Election of Directors
Our charter provides that, except as otherwise provided in the bylaws, the affirmative vote of the holders of a majority of the outstanding shares of stock entitled to vote in the election of directors will be required to elect each director. Our bylaws currently provide that directors are elected by a plurality of the votes cast in the election of directors. Pursuant to our charter and bylaws, our Board of Directors may amend the bylaws to alter the vote required to elect directors.
Number of Directors; Vacancies; Removal
Our charter provides that the number of directors will be set only by the Board of Directors in accordance with our bylaws. Our bylaws provide that a majority of our entire Board of Directors may at any time increase or decrease the number of directors. However, unless the bylaws are amended, the number of directors may never be less than one nor more than 12. We have elected to be subject to the provision of Subtitle 8 of Title 3 of the Maryland General Corporation Law regarding the filling of vacancies on the Board of Directors. Accordingly, at such time, except as may be provided by the Board of Directors in setting the terms of any class or series of preferred stock, any and all vacancies on the Board of Directors may be filled only by the affirmative vote of a majority of the remaining directors in office, even if the remaining directors do not constitute a quorum, and any director elected to fill a vacancy shall serve for the remainder of the full term of the directorship in which the vacancy occurred and until a successor is elected and qualifies, subject to any applicable requirements of the 1940 Act.
Our charter provides that a director may be removed only for cause, as defined in the charter, and then only by the affirmative vote of at least two-thirds of the votes entitled to be cast in the election of directors.
Action by Stockholders
Under the Maryland General Corporation Law, stockholder action may be taken only at an annual or special meeting of stockholders or by unanimous consent in lieu of a meeting (unless the charter provides for stockholder action by less than unanimous written consent, which our charter does not). These provisions, combined with the requirements of our bylaws regarding the calling of a stockholder-requested special meeting of stockholders discussed below, may have the effect of delaying consideration of a stockholder proposal until the next annual meeting.
117
Advance Notice Provisions for Stockholder Nominations and Stockholder Proposals
Our bylaws provide that with respect to an annual meeting of stockholders, nominations of persons for election to the Board of Directors and the proposal of business to be considered by stockholders may be made only (1) pursuant to our notice of the meeting, (2) by the Board of Directors or (3) by a stockholder who is entitled to vote at the meeting and who has complied with the advance notice procedures of the bylaws. With respect to special meetings of stockholders, only the business specified in our notice of the meeting may be brought before the meeting. Nominations of persons for election to the Board of Directors at a special meeting may be made only (1) pursuant to our notice of the meeting, (2) by the Board of Directors or (3) provided that the Board of Directors has determined that directors will be elected at the meeting, by a stockholder who is entitled to vote at the meeting and who has complied with the advance notice provisions of the bylaws.
The purpose of requiring stockholders to give us advance notice of nominations and other business is to afford our Board of Directors a meaningful opportunity to consider the qualifications of the proposed nominees and the advisability of any other proposed business and, to the extent deemed necessary or desirable by our Board of Directors, to inform stockholders and make recommendations about such qualifications or business, as well as to provide a more orderly procedure for conducting meetings of stockholders. Although our bylaws do not give our Board of Directors any power to disapprove stockholder nominations for the election of directors or proposals recommending certain action, they may have the effect of precluding a contest for the election of directors or the consideration of stockholder proposals if proper procedures are not followed and of discouraging or deterring a third party from conducting a solicitation of proxies to elect its own slate of directors or to approve its own proposal without regard to whether consideration of such nominees or proposals might be harmful or beneficial to us and our stockholders.
Calling of Special Meeting of Stockholders
Our bylaws provide that special meetings of stockholders may be called by our Board of Directors and certain of our officers. Additionally, our bylaws provide that, subject to the satisfaction of certain procedural and informational requirements by the stockholders requesting the meeting, a special meeting of stockholders shall be called by our secretary upon the written request of stockholders entitled to cast not less than a majority of all of the votes entitled to be cast at such meeting.
Approval of Extraordinary Corporate Action; Amendment of Charter and Bylaws
Under Maryland law, a Maryland corporation generally cannot dissolve, amend its charter, merge, sell all or substantially all of its assets, engage in a share exchange or engage in similar transactions outside the ordinary course of business, unless approved by the affirmative vote of stockholders entitled to cast at least two-thirds of the votes entitled to be cast on the matter. However, a Maryland corporation may provide in its charter for approval of these matters by a lesser percentage, but not less than a majority of all of the votes entitled to be cast on the matter. Our charter generally provides for approval of charter amendments and extraordinary transactions by the stockholders entitled to cast at least a majority of the votes entitled to be cast on the matter. Our charter also provides that certain charter amendments and any proposal for our conversion, whether by merger or otherwise, from a closed-end company to an open-end company or any proposal for our liquidation or dissolution requires the approval of the stockholders entitled to cast at least 75% of the votes entitled to be cast on such matter. However, if such amendment or proposal is approved by at least 75% of our continuing directors (in addition to approval by our Board of Directors), such amendment or proposal may be approved by the stockholders entitled to cast a majority of the votes entitled to be cast on such a matter. The “continuing directors” are defined in our charter as our current directors, as well as those directors whose nomination for election by the stockholders or whose election by the directors to fill vacancies is approved by a majority of the continuing directors then on the Board of Directors.
Our charter and bylaws provide that the Board of Directors will have the exclusive power to make, alter, amend or repeal any provision of our bylaws.
118
No Appraisal Rights
Except with respect to appraisal rights arising in connection with the Control Share Act discussed below, as permitted by the Maryland General Corporation Law, our charter provides that stockholders will not be entitled to exercise appraisal rights.
Control Share Acquisitions
The Maryland Control Share Acquisition Act (the “Control Share Act”) provides that control shares of a Maryland corporation acquired in a control share acquisition have no voting rights except to the extent approved by a vote of two-thirds of the votes entitled to be cast on the matter. Shares owned by the acquiror, by officers or by directors who are employees of the corporation are excluded from shares entitled to vote on the matter. Control shares are voting shares of stock which, if aggregated with all other shares of stock owned by the acquiror or in respect of which the acquiror is able to exercise or direct the exercise of voting power (except solely by virtue of a revocable proxy), would entitle the acquiror to exercise voting power in electing directors within one of the following ranges of voting power:
| • | one-tenth or more but less than one-third; |
| • | one-third or more but less than a majority; or |
| • | a majority or more of all voting power. |
The requisite stockholder approval must be obtained each time an acquiror crosses one of the thresholds of voting power set forth above. Control shares do not include shares the acquiring person is then entitled to vote as a result of having previously obtained stockholder approval. A control share acquisition means the acquisition of control shares, subject to certain exceptions.
A person who has made or proposes to make a control share acquisition may compel the Board of Directors of the corporation to call a special meeting of stockholders to be held within 50 days of demand to consider the voting rights of the shares. The right to compel the calling of a special meeting is subject to the satisfaction of certain conditions, including an undertaking to pay the expenses of the meeting. If no request for a meeting is made, the corporation may itself present the question at any stockholders meeting.
If voting rights are not approved at the meeting or if the acquiring person does not deliver an acquiring person statement as required by the statute, then the corporation may repurchase for fair value any or all of the control shares, except those for which voting rights have previously been approved. The right of the corporation to repurchase control shares is subject to certain conditions and limitations. Fair value is determined, without regard to the absence of voting rights for the control shares, as of the date of the last control share acquisition by the acquiror or of any meeting of stockholders at which the voting rights of the shares are considered and not approved. If voting rights for control shares are approved at a stockholders meeting and the acquiror becomes entitled to vote a majority of the shares entitled to vote, all other stockholders may exercise appraisal rights. The fair value of the shares as determined for purposes of appraisal rights may not be less than the highest price per share paid by the acquiror in the control share acquisition.
The Control Share Act does not apply (a) to shares acquired in a merger, consolidation or share exchange if the corporation is a party to the transaction or (b) to acquisitions approved or exempted by the charter or bylaws of the corporation.
Our bylaws contain a provision exempting from the Control Share Act any and all acquisitions by any person of our shares of stock. There can be no assurance that such provision will not be otherwise amended or eliminated at any time in the future. However, we will amend our bylaws to be subject to the Control Share Act only if the Board of Directors determines that it would be in our best interests and if the staff of the SEC does not object to our determination that our being subject to the Control Share Act does not conflict with the 1940 Act.
119
Business Combinations
Under the Maryland Business Combination Act (the “Business Combination Act”), “business combinations” between a Maryland corporation and an interested stockholder or an affiliate of an interested stockholder are prohibited for five years after the most recent date on which the interested stockholder becomes an interested stockholder. These business combinations include a merger, consolidation, share exchange or, in circumstances specified in the statute, an asset transfer or issuance or reclassification of equity securities. An interested stockholder is defined as:
| • | any person who beneficially owns 10% or more of the voting power of the corporation’s shares; or |
| • | an affiliate or associate of the corporation who, at any time within the two-year period prior to the date in question, was the beneficial owner of 10% or more of the voting power of the then outstanding voting stock of the corporation. |
A person is not an interested stockholder under this statute if the Board of Directors approved in advance the transaction by which such stockholder otherwise would have become an interested stockholder. However, in approving a transaction, the Board of Directors may provide that its approval is subject to compliance, at or after the time of approval, with any terms and conditions determined by the board.
After the 5-year prohibition, any business combination between the Maryland corporation and an interested stockholder generally must be recommended by the Board of Directors of the corporation and approved by the affirmative vote of at least:
| • | 80% of the votes entitled to be cast by holders of outstanding shares of voting stock of the corporation; and |
| • | two-thirds of the votes entitled to be cast by holders of voting stock of the corporation other than shares held by the interested stockholder with whom or with whose affiliate the business combination is to be effected or held by an affiliate or associate of the interested stockholder. |
These super-majority vote requirements do not apply if the corporation’s common stockholders receive a minimum price, as defined under Maryland law, for their shares in the form of cash or other consideration in the same form as previously paid by the interested stockholder for its shares.
The statute permits various exemptions from its provisions, including business combinations that are exempted by the Board of Directors before the time that the interested stockholder becomes an interested stockholder. Our Board of Directors has adopted a resolution exempting any business combination between us and any other person from the provisions of the Business Combination Act, provided that the business combination is first approved by the Board of Directors, including a majority of the directors who are not interested persons as defined in the 1940 Act. This resolution, however, may be altered or repealed in whole or in part at any time. In addition, our Board of Directors has adopted a resolution exempting any business combination with certain investment funds managed by JMP Asset Management LLC and certain investment funds managed by Farallon Capital Management, L.L.C. from the provisions of the Business Combination Act. We have agreed with such investment funds that we will not repeal or amend such resolution prior to the date that is two years after such investment funds cease to own at least 10% of our outstanding common stock in a manner that would make the Business Combination Act applicable to acquisitions of our stock by such investment funds without the written consent of such investment funds. If these resolutions are repealed, or the Board of Directors does not otherwise approve a business combination, the statute may discourage others from trying to acquire control of us and increase the difficulty of consummating any offer.
Conflict with 1940 Act
Our bylaws provide that, if and to the extent that any provision of the Maryland General Corporation Law, or any provision of our charter or bylaws conflicts with any provision of the 1940 Act, the applicable provision of the 1940 Act will control.
120
Regulatory Restrictions
Our wholly-owned subsidiary, Hercules Technology II, L.P., has obtained a small business investment company license. The Small Business Administration prohibits, without prior Small Business Administration approval, a “change of control” or transfers which would result in any person (or group of persons acting in concert) owning 10% or more of any class of capital stock of a small business investment company. A “change of control” is any event which would result in a transfer of the power, direct or indirect, to direct the management and policies of a small business investment company, whether through ownership, contractual arrangements or otherwise.
121
Below is information with respect to the number of shares of common stock owned by each of the shareholders. The common stock is being registered to permit public secondary trading of the shares of common stock. Selling holders, which term includes their transferees, pledgees or donees or their successors, may offer the shares of common stock for resale from time to time.
The following table sets forth the name of each selling holder and the following information as of May 8, 2007: the amount of common stock owned by each selling holder; the amount of common stock which may be offered for the account of such selling holder under this prospectus; and the amount of common stock to be owned by such security holder after completion of the offering.
The information included in the table under “Shares Beneficially Owned and Ownership Percentage After Offering” assumes that each stockholder below will elect to sell all of the shares set forth under “Shares Being Offered.” The information regarding the identity of the selling stockholders and their affiliations, including their beneficial ownership of our shares of common stock, is based solely on information provided by or on behalf of the selling stockholders.
These assumptions have been made under the rules and regulations of the SEC and do not reflect any knowledge that we have with respect to the present intent of the persons listed as selling stockholders.
The address for each stockholder listed below is c/o Hercules Technology Growth Capital, Inc., 400 Hamilton Avenue, Suite 310 Palo Alto, CA 94301.
| Name |
Shares Beneficially Owned and Ownership
Percentage |
Shares Offered |
Shares Beneficially Ownership Percentage |
|||||||||
| Shares | Percentage | Shares | Percentage | |||||||||
| Robert P. Badavas |
13,668 | * | 6,668 | 7,000 | * | |||||||
| Allyn C. Woodward Jr. |
29,016 | * | 20,000 | 9,016 | * | |||||||
| Joseph W. Chow(4) |
35,126 | * | 20,000 | 15,126 | * | |||||||
| Entities affiliated with Farallon Capital Management, L.L.C. |
2,006,181 | 8.7 | % | 432,900 | 1,573,281 | 6.8 | % | |||||
| c/o Farallon Capital Management, L.L.C. |
||||||||||||
| * | Less than 1% |
| (1) | Beneficial ownership is determined in accordance with the rules and regulations of the SEC. Except as indicated in the footnotes to this table, each person named in the table has sole voting and investment power with respect to the shares set forth opposite that person’s name. |
| (2) | Assumes the sale of all shares eligible for sale in this prospectus and no other purchases or sales of our common stock. This assumption has been made under the rules and regulations of the SEC and does not reflect any knowledge that we have with respect to the present intent of the persons listed as selling stockholders. |
| (3) | Applicable percentage of ownership is based on 23,102,418 shares of our common stock outstanding on May 8, 2007. |
| (4) | Includes 794 shares of common stock that can be acquired upon the exercise of outstanding 5-year warrants. |
122
SHARES ELIGIBLE FOR FUTURE SALE
Future sales of substantial amounts of our common stock or warrants in the public market, or the perception that such sales may occur, could adversely affect the market price of our common stock or warrants and could impair our future ability to raise capital through the sale of our equity securities.
We have 23,102,418 shares of our common stock outstanding of which 735,696 are “restricted” securities under the meaning of Rule 144 promulgated under the Securities Act. Of these securities, 479,568 shares may be offered by the selling shareholders named in this prospectus. See “Selling Shareholders.” In addition, we have 393,664 warrants to purchase shares of our common stock outstanding as of March 31, 2007.
In general, under Rule 144 as currently in effect, if one year has elapsed since the date of acquisition of restricted securities from us or any of our affiliates, the holder of such restricted securities can sell such securities; provided that the number of securities sold by such person within any three-month period cannot exceed the greater of:
| • | 1% of the total number of securities then outstanding, or |
| • | the average weekly trading volume of our securities during the four calendar weeks preceding the date on which notice of the sale is filed with the SEC. |
Sales under Rule 144 also are subject to certain manner of sale provisions, notice requirements and the availability of current public information about us. If two years have elapsed since the date of acquisition of restricted securities from us or any of our affiliates and the holder is not one of our affiliates at any time during the three months preceding the proposed sale, such person can sell such securities in the public market under Rule 144(k) without regard to the volume limitations, manner of sale provisions, public information requirements or notice requirements. No assurance can be given as to (1) the likelihood that an active market for our common stock will develop, (2) the liquidity of any such market, (3) the ability of our stockholders to sell our securities or (4) the prices that stockholders may obtain for any of our securities. No prediction can be made as to the effect, if any, that future sales of securities, or the availability of securities for future sale, will have on the market price prevailing from time to time. Sales of substantial amounts of our securities, or the perception that such sales could occur, may affect adversely prevailing market prices of the common stock.
We may offer, from time to time, up to 12,000,000 shares of our common stock. Also, the selling holders named in this prospectus may offer, from time to time, up to 479,568 shares of our common stock. See “Selling Shareholders.” The selling holders may sell the shares held for their own account or the shares may be sold by donees, transferees, pledgees or other successors in interest that receive such shares from the selling holders as a gift or other non-sale related transfer. We and the selling holders may sell the shares of our common stock through underwriters, broker-dealers or agents or through a combination of any such methods of sale. Shares of our common stock may also be sold “at-the-market” to or through a market maker or into an existing trading market for shares, on an exchange or otherwise. Any underwriter or agent involved in the offer and sale of the shares of our common stock will be named in the applicable prospectus supplement.
The distribution of the shares of our common stock may be effected from time to time in one or more transactions at a fixed price or prices, which may be changed, at prevailing market prices at the time of sale, at prices related to such prevailing market prices, or at negotiated prices, provided, however, that the offering price per share of our common stock, less any underwriting commissions or discounts, must equal or exceed the net asset value per share of our common stock at the time of the offering. We also may, from time to time, authorize dealers or agents to offer and sell these securities upon such terms and conditions as may be set forth in the applicable prospectus supplement.
123
In connection with the sale of the shares of our common stock, underwriters or agents may receive compensation from us or the selling holders or from purchasers of the shares of our common stock, for whom they may act as agents, in the form of discounts, concessions or commissions. Underwriters may sell shares of our common stock to or through dealers and such dealers may receive compensation in the form of discounts, concessions or commissions from the underwriters and/or commissions from the purchasers for whom they may act as agents. Underwriters, dealers and agents that participate in the distribution of shares of our common stock may be deemed to be underwriters under the Securities Act, and any discounts and commissions they receive from us or the selling holders and any profit realized by them on the resale of shares of our common stock may be deemed to be underwriting discounts and commissions under the Securities Act. Any such underwriter or agent will be identified and any such compensation received from us or the selling holders will be described in the applicable prospectus supplement.
Any common stock sold pursuant to a prospectus supplement will be quoted on the Nasdaq Global Market, or another exchange on which the common stock is traded.
Under agreements into which we or the selling holders may enter, underwriters, dealers and agents who participate in the distribution of shares of our common stock may be entitled to indemnification by us or the selling holders against certain liabilities, including liabilities under the Securities Act. Underwriters, dealers and agents may engage in transactions with, or perform services for, us or the selling holders in the ordinary course of business.
If so indicated in the applicable prospectus supplement, we or the selling holder will authorize underwriters or other persons acting as our agents to solicit offers by certain institutions to purchase shares of our common stock from us or the selling holders pursuant to contracts providing for payment and delivery on a future date. Institutions with which such contracts may be made include commercial and savings banks, insurance companies, pension funds, investment companies, educational and charitable institutions and others, but in all cases such institutions must be approved by us or the selling holders. The obligations of any purchaser under any such contract will be subject to the condition that the purchase of shares of our common stock shall not at the time of delivery be prohibited under the laws of the jurisdiction to which such purchaser is subject. The underwriters and such other agents will not have any responsibility in respect of the validity or performance of such contracts. Such contracts will be subject only to those conditions set forth in the prospectus supplement, and the prospectus supplement will set forth the commission payable for solicitation of such contracts.
The maximum commission or discount to be received by any member of the National Association of Securities Dealers, Inc. or independent broker-dealer will not be greater than 10% for the sale of any securities being registered and 0.5% for bona fide due diligence.
In order to comply with the securities laws of certain states, if applicable, shares of our common stock offered hereby will be sold in such jurisdictions only through registered or licensed brokers or dealers.
BROKERAGE ALLOCATION AND OTHER PRACTICES
Since we generally acquire and dispose of our investments in privately negotiated transactions, we rarely use brokers in the normal course of business. In those cases in which we do use a broker, we do not execute transactions through any particular broker or dealer, but will seek to obtain the best net results for us, taking into account such factors as price (including the applicable brokerage commission or dealer spread), size of order, difficulty of execution and operational facilities of the firm and the firm’s risk and skill in positioning blocks of securities. While we generally seek reasonably competitive execution costs, we may not necessarily pay the lowest spread or commission available. Subject to applicable legal requirements, we may select a broker based partly upon brokerage or research services provided to us. In return for such services, we may pay a higher commission than other brokers would charge if we determine in good faith that such commission is reasonable in
124
relation to the services provided. For the years ended December 31, 2006, 2005 and 2004 we paid $12,100, $4,000 and $0 in brokerage commissions, respectively. For the three months ended March 31, 2007 we did not pay any brokerage commissions.
CUSTODIAN, TRANSFER AND DIVIDEND PAYING AGENT AND REGISTRAR
Securities we hold in connection with our investments are held under a custody agreement with Union Bank of California. The address of the custodian is 475 Sansome Street, 15th Floor, San Francisco, California 94111. We have also entered into a custody agreement with U.S. Bank National Association, which is located at One Federal Street, Third Floor, Boston, Massachusetts 02110. The transfer agent and registrar for our common stock, American Stock Transfer & Trust Company, will act as our transfer agent, dividend paying and reinvestment agent and registrar. The principal business address of the transfer agent is 59 Maiden Lane, New York, New York 10038.
Certain legal matters regarding the securities offered by this prospectus will be passed upon for us by Sutherland Asbill & Brennan LLP, Washington, D.C. Certain legal matters will be passed upon for underwriters, if any, by the counsel named in the prospectus supplement.
Ernst & Young LLP, independent registered public accounting firm, has audited our consolidated financial statements at December 31, 2006 and December 31, 2005 and for the years ended December 31, 2006 and 2005, and for the period from February 2, 2004 (commenced operations) to December 31, 2004 as set forth in their report. We have included our consolidated financial statements in this prospectus and elsewhere in the registration statement in reliance on Ernst & Young LLP’s report, given on their authority as experts in accounting and auditing.
We have filed with the SEC a registration statement on Form N-2, together with all amendments and related exhibits, under the Securities Act, with respect to our shares of common stock offered by this prospectus. The registration statement contains additional information about us and our shares of common stock being offered by this prospectus.
We file annual, quarterly and current periodic reports, proxy statements and other information with the SEC under the Exchange Act. You may inspect and copy these reports, proxy statements and other information, as well as the registration statement of which this prospectus forms a part and the related exhibits and schedules, at the Public Reference Room of the SEC at 100 F Street, N.E., Washington, D.C. 20549-0102. You may obtain information on the operation of the Public Reference Room by calling the SEC at 1-800-SEC-0330. The SEC maintains an Internet website that contains reports, proxy and information statements and other information filed electronically by us with the SEC which are available on the SEC’s Internet website at http://www.sec.gov. Copies of these reports, proxy and information statements and other information may be obtained, after paying a duplicating fee, by electronic request at the following E-mail address: publicinfo@sec.gov, or by writing the SEC’s Public Reference Section, Washington, D.C. 20549-0102.
125
| AUDITED FINANCIAL STATEMENTS |
||
| F-2 | ||
| Consolidated Statements of Assets and Liabilities as of December 31, 2006 and December 31, 2005 |
F-3 | |
| Consolidated Schedule of Investments as of December 31, 2006 |
F-4 | |
| Consolidated Schedule of Investments as of December 31, 2005 |
F-11 | |
| F-15 | ||
| F-16 | ||
| F-17 | ||
| F-18 | ||
| UNAUDITED FINANCIAL STATEMENTS |
||
| F-34 | ||
| Consolidated Schedule of Investments as of March 31, 2007 (unaudited) |
F-35 | |
| Consolidated Schedule of Investments as of December 31, 2006 |
F-44 | |
| F-52 | ||
| F-53 | ||
| F-54 | ||
| F-55 | ||
F-1
REPORT OF INDEPENDENT REGISTERED PUBLIC ACCOUNTING FIRM
Board of Directors and Shareholders
Hercules Technology Growth Capital, Inc.
We have audited the accompanying consolidated statements of assets and liabilities of Hercules Technology Growth Capital, Inc., including the consolidated schedules of investments, as of December 31, 2006 and 2005, and the related consolidated statements of operations, changes in net assets and cash flows for each of the two years in the period ended December 31, 2006 and for the period from February 2, 2004 (commencement of operations) to December 31, 2004. These financial statements are the responsibility of the Company’s management. Our responsibility is to express an opinion on these financial statements based on our audits.
We conducted our audits in accordance with auditing standards of the Public Company Accounting Oversight Board (United States). Those standards require that we plan and perform the audit to obtain reasonable assurance about whether the financial statements and financial highlights are free of material misstatement. An audit also includes examining, on a test basis, evidence supporting the amounts and disclosures in the financial statements and financial highlights, assessing the accounting principles used and significant estimates made by management, and evaluating the overall financial statement presentation. Our procedures included correspondence with each portfolio company. We believe that our audits provide a reasonable basis for our opinion.
In our opinion, the consolidated financial statements referred to above present fairly, in all material respects, the consolidated financial position of Hercules Technology Growth Capital, Inc. at December 31, 2006 and 2005, the consolidated results of its operations, the changes in its net assets and its cash flows for each of the two years in the period ended December 31, 2006 and for the period from February 2, 2004 (commencement of operations) to December 31, 2004, in conformity with U.S. generally accepted accounting principles.
We have also audited, in accordance with the standards of the Public Company Accounting Oversight Board (United States), the effectiveness of Hercules Technology Growth Capital, Inc.’s internal control over financial reporting as of December 31, 2006, based on criteria established in Internal Control—Integrated Framework issued by the Committee of Sponsoring Organizations of the Treadway Commission and our report dated February 28, 2007 expressed an unqualified opinion thereon.
/s/ Ernst & Young LLP
San Francisco, California
February 28, 2007
F-2
HERCULES TECHNOLOGY GROWTH CAPITAL, INC.
CONSOLIDATED STATEMENTS OF ASSETS AND LIABILITIES
| December 31, | ||||||||
| 2006 | 2005 | |||||||
| Assets |
||||||||
| Investments, at value (cost of $279,946,465 and $176,004,865, respectively) |
$ | 283,233,751 | $ | 176,673,226 | ||||
| Deferred loan origination revenue |
(3,450,971 | ) | (2,729,982 | ) | ||||
| Cash and cash equivalents |
16,404,214 | 15,362,447 | ||||||
| Interest receivable |
2,906,831 | 1,479,375 | ||||||
| Deferred tax asset |
— | 1,454,000 | ||||||
| Other assets |
2,048,384 | 1,408,813 | ||||||
| Total assets |
301,142,209 | 193,647,879 | ||||||
| Liabilities |
||||||||
| Accounts payable |
540,376 | 150,081 | ||||||
| Income tax payable |
— | 1,709,000 | ||||||
| Accrued liabilities |
4,189,011 | 1,436,468 | ||||||
| Short-term loans payable |
41,000,000 | 76,000,000 | ||||||
| Total liabilities |
45,729,387 | 79,295,549 | ||||||
| Net assets |
$ | 255,412,822 | $ | 114,352,330 | ||||
| Net assets consist of: |
||||||||
| Par value |
$ | 21,927 | $ | 9,802 | ||||
| Capital in excess of par value |
257,234,729 | 114,524,833 | ||||||
| Unrealized appreciation on investments |
2,860,654 | 353,093 | ||||||
| Accumulated realized gains (losses) on investments |
(1,972,014 | ) | 481,694 | |||||
| Distributions in excess of investment income |
(2,732,474 | ) | (1,017,092 | ) | ||||
| Total net assets |
$ | 255,412,822 | $ | 114,352,330 | ||||
| Shares of common stock outstanding ($0.001 par value, 30,000,000 authorized) |
21,927,034 | 9,801,965 | ||||||
| Net asset value per share |
$ | 11.65 | $ | 11.67 | ||||
See notes to consolidated financial statements.
F-3
HERCULES TECHNOLOGY GROWTH CAPITAL., INC.
CONSOLIDATED SCHEDULE OF INVESTMENTS
December 31, 2006
| Portfolio Company |
Industry |
Type of Investment(1)(7) |
Principal Amount | Cost(2) | Value(3) | ||||||||
| Acceleron Pharmaceuticals, Inc. (1.74%)*(4) |
Biopharmaceuticals | Senior Debt |
$ | 4,069,607 | $ | 3,987,624 | $ | 3,987,624 | |||||
| Preferred Stock Warrants |
69,106 | 417,115 | |||||||||||
| Preferred Stock Warrants |
34,996 | 34,393 | |||||||||||
| Acceleron Pharmaceuticals, Inc. (0.44%) |
Preferred Stock |
1,000,000 | 1,111,112 | ||||||||||
| Total Acceleron Pharmaceuticals, Inc. |
5,091,726 | 5,550,244 | |||||||||||
| Aveo Pharmaceuticals, Inc. (5.88%)(4) |
Biopharmaceuticals | Senior Debt |
$ | 15,000,000 | 14,849,099 | 14,849,099 | |||||||
| Preferred Stock Warrants |
144,056 | 115,212 | |||||||||||
| Preferred Stock Warrants |
46,288 | 43,771 | |||||||||||
| Total Aveo Pharmaceuticals, Inc. |
15,039,443 | 15,008,082 | |||||||||||
| Elixir Pharmaceuticals, Inc. (3.92%) |
Biopharmaceuticals | Senior Debt |
$ | 10,000,000 | 9,857,610 | 9,857,610 | |||||||
| Preferred Stock Warrants |
74,755 | 73,334 | |||||||||||
| Preferred Stock Warrants |
74,755 | 73,334 | |||||||||||
| Total Elixir Pharmaceuticals, Inc. |
10,007,120 | 10,004,278 | |||||||||||
| EpiCept Corporation (3.84%) |
Biopharmaceuticals | Senior Debt |
$ | 10,000,000 | 9,312,750 | 9,312,750 | |||||||
| Common Stock Warrants |
794,633 | 507,592 | |||||||||||
| Total EpiCept Corporation |
10,107,383 | 9,820,342 | |||||||||||
| Guava Technologies, Inc. (2.26%)(4) |
Biopharmaceuticals | Senior Debt |
$ | 5,266,485 | 5,193,710 | 5,193,710 | |||||||
| Revolving Line of Credit |
$ | 500,000 | 500,000 | 500,000 | |||||||||
| Preferred Stock Warrants |
105,399 | 83,940 | |||||||||||
| Total Guava Technologies, Inc. |
5,799,109 | 5,777,650 | |||||||||||
| Labopharm USA, Inc. (2.58%)(4)(5) |
Biopharmaceuticals | Senior Debt |
$ | 6,675,417 | 6,598,870 | 6,598,870 | |||||||
| Total Labopharm USA, Inc. |
6,598,870 | 6,598,870 | |||||||||||
| Merrimack Pharmaceuticals, Inc. (2.61%)(4) |
Biopharmaceuticals | Convertible Senior Debt |
$ | 6,043,382 | 5,967,550 | 6,254,550 | |||||||
| Preferred Stock Warrants |
155,456 | 409,159 | |||||||||||
| Total Merrimack Pharmaceuticals, Inc. |
6,123,006 | 6,663,709 | |||||||||||
| Paratek Pharmaceuticals, Inc. (2.62%)(4) |
Biopharmaceuticals | Senior Debt |
$ | 6,651,586 | 6,586,705 | 6,586,705 | |||||||
| Preferred Stock Warrants |
137,396 | 110,553 | |||||||||||
| Total Paratek Pharmaceuticals, Inc. |
6,724,101 | 6,697,258 | |||||||||||
| Portola Pharmaceuticals, Inc. (4.41%) . |
Biopharmaceuticals | Senior Debt |
$ | 11,250,000 | 11,145,804 | 11,145,804 | |||||||
| Preferred Stock Warrants |
113,668 | 107,489 | |||||||||||
| Total Portola Pharmaceuticals, Inc |
11,259,472 | 11,253,293 | |||||||||||
See notes to consolidated financial statements.
F-4
HERCULES TECHNOLOGY GROWTH CAPITAL., INC.
CONSOLIDATED SCHEDULE OF INVESTMENTS—(Continued)
December 31, 2006
| Portfolio Company |
Industry |
Type of Investment(1)(7) |
Principal Amount | Cost(2) | Value(3) | ||||||||
| Quatrx Pharmaceuticals Company (7.05%)(4) |
Biopharmaceuticals | Senior Debt |
$ | 18,000,000 | $ | 17,834,735 | $ | 17,834,735 | |||||
| Preferred Stock Warrants |
220,354 | 179,708 | |||||||||||
| Total Quatrx Pharmaceuticals Company |
18,055,089 | 18,014,443 | |||||||||||
| Sirtris Pharmaceuticals, Inc. (3.91%)(4) |
Biopharmaceuticals | Senior Debt |
$ | 10,000,000 | 9,924,495 | 9,924,495 | |||||||
| Preferred Stock Warrants |
88,829 | 70,986 | |||||||||||
| Total Sirtris Pharmaceuticals, Inc. |
10,013,324 | 9,995,481 | |||||||||||
| TransOral Pharmaceuticals, Inc. (3.92%)(4) |
Biopharmaceuticals | Senior Debt |
$ | 10,000,000 | 9,921,976 | 9,921,976 | |||||||
| Preferred Stock Warrants |
35,630 | 28,265 | |||||||||||
| Preferred Stock Warrants |
51,067 | 50,548 | |||||||||||
| Total TransOral Pharmaceuticals, Inc. |
10,008,673 | 10,000,789 | |||||||||||
| Total Biopharmaceuticals (45.18%) |
114,827,316 | 115,384,439 | |||||||||||
| Atrenta, Inc. (2.03%)(4) |
Software | Senior Debt |
$ | 5,000,000 | 4,929,298 | 4,929,298 | |||||||
| Atrenta, Inc. (0.10%) |
Preferred Stock Warrants Preferred Stock Warrants Preferred Stock |
|
102,396 33,760 250,000 |
|
200,285 65,719 250,000 | ||||||||
| Total Atrenta, Inc. |
5,315,454 | 5,445,302 | |||||||||||
| Blurb, Inc. (0.10%) |
Software | Senior Debt |
$ | 250,000 | 237,454 | 237,454 | |||||||
| Preferred Stock Warrants |
12,904 | 12,653 | |||||||||||
| Total Blurb, Inc. |
250,358 | 250,107 | |||||||||||
| Compete, Inc. (1.52%)(4) |
Software | Senior Debt |
$ | 3,884,338 | 3,839,045 | 3,839,045 | |||||||
| Preferred Stock Warrants |
62,067 | 49,247 | |||||||||||
| Total Compete, Inc. |
3,901,112 | 3,888,292 | |||||||||||
| Forescout Technologies, Inc. (0.78%) |
Software | Senior Debt |
$ | 2,000,000 | 1,950,584 | 1,950,584 | |||||||
| Preferred Stock Warrants |
55,593 | 50,800 | |||||||||||
| Total Forescout Technologies, Inc. |
2,006,177 | 2,001,384 | |||||||||||
| GameLogic, Inc. (1.17%)(4) |
Software | Senior Debt |
$ | 3,000,000 | 2,957,416 | 2,957,416 | |||||||
| Preferred Stock Warrants |
52,604 | 41,860 | |||||||||||
| Total GameLogic, Inc. |
3,010,020 | 2,999,276 | |||||||||||
| Gomez, Inc. (0.48%)(4) |
Software | Senior Debt |
$ | 1,212,506 | 1,201,811 | 1,201,811 | |||||||
| Preferred Stock Warrants |
35,000 | 18,832 | |||||||||||
| Total Gomez, Inc. |
1,236,811 | 1,220,643 | |||||||||||
See notes to consolidated financial statements.
F-5
HERCULES TECHNOLOGY GROWTH CAPITAL., INC.
CONSOLIDATED SCHEDULE OF INVESTMENTS—(Continued)
December 31, 2006
| Portfolio Company |
Industry |
Type of Investment(1)(7) |
Principal Amount | Cost(2) | Value(3) | ||||||||
| HighRoads, Inc. (0.77%)(4) |
Software | Senior Debt |
$ | 1,954,723 | $ | 1,923,844 | $ | 1,923,844 | |||||
| Preferred Stock Warrants |
44,466 | 35,484 | |||||||||||
| Total HighRoads, Inc. |
1,968,310 | 1,959,328 | |||||||||||
| Intelliden, Inc. (1.17%) |
Software | Senior Debt |
$ | 3,000,000 | 2,984,169 | 2,984,169 | |||||||
| Preferred Stock Warrants |
17,542 | 16,688 | |||||||||||
| Total Intelliden, Inc. |
3,001,711 | 3,000,857 | |||||||||||
| Inxight Software, Inc. (1.60%)(4) |
Software | Senior Debt |
$ | 4,073,794 | 4,051,059 | 4,051,059 | |||||||
| Preferred Stock Warrants |
55,963 | 29,800 | |||||||||||
| Total Inxight Software, Inc. |
4,107,022 | 4,080,859 | |||||||||||
| Oatsystems, Inc. (2.36%)(4) |
Software | Senior Debt |
$ | 6,000,000 | 5,973,007 | 5,973,007 | |||||||
| Preferred Stock Warrants |
33,742 | 26,881 | |||||||||||
| Total Oatsystems, Inc. |
6,006,749 | 5,999,888 | |||||||||||
| Proficiency, Inc. (1.43%)(5) |
Software | Senior Debt |
$ | 4,000,000 | 3,951,815 | 3,548,185 | |||||||
| Preferred Stock Warrants |
96,370 | 115,977 | |||||||||||
| Total Proficiency, Inc. |
4,048,185 | 3,664,162 | |||||||||||
| Savvion, Inc. (1.58%)(4) |
Software | Senior Debt |
$ | 1,000,000 | 1,000,000 | 1,000,000 | |||||||
| Revolving Line of Credit |
$ | 3,000,000 | 2,991,311 | 2,991,311 | |||||||||
| Preferred Stock Warrants |
52,135 | 41,743 | |||||||||||
| Total Savvion, Inc. |
4,043,446 | 4,033,054 | |||||||||||
| Sportvision, Inc. (0.01%) |
Software | Preferred Stock Warrants |
39,339 | 29,667 | |||||||||
| Total Sportvision, Inc. |
39,339 | 29,667 | |||||||||||
| Talisma Corp. (0.74%)(4) |
Software | Subordinated Debt |
$ | 1,873,774 | 1,858,802 | 1,858,802 | |||||||
| Preferred Stock Warrants |
49,000 | 25,259 | |||||||||||
| Total Talisma Corp. |
1,907,802 | 1,884,061 | |||||||||||
| Total Software (15.84%) |
40,842,496 | 40,456,880 | |||||||||||
| BabyUniverse, Inc. (1.90%)(4) |
Consumer & Business Products | Senior Debt |
$ | 5,000,000 | 4,728,980 | 4,728,980 | |||||||
| Common Stock Warrants |
325,224 | 146,299 | |||||||||||
| Total BabyUniverse, Inc. |
5,054,204 | 4,875,279 | |||||||||||
See notes to consolidated financial statements.
F-6
HERCULES TECHNOLOGY GROWTH CAPITAL., INC.
CONSOLIDATED SCHEDULE OF INVESTMENTS—(Continued)
December 31, 2006
| Portfolio Company |
Industry |
Type of Investment(1)(7) |
Principal Amount | Cost(2) | Value(3) | ||||||||
| Market Force Information, Inc. (0.70%)(4) |
Consumer & Business Products | Senior Debt |
$ | 1,777,064 | $ | 1,759,510 | $ | 1,759,510 | |||||
| Preferred Stock Warrants |
23,823 | 19,197 | |||||||||||
| Total Market Force Information, Inc. |
1,783,333 | 1,778,707 | |||||||||||
| Wageworks, Inc. (5.89%)(4) |
Consumer & Business Products | Senior Debt |
$ | 14,036,422 | 13,904,441 | 13,904,441 | |||||||
| Preferred Stock Warrants |
251,964 | 1,140,998 | |||||||||||
| Wageworks, Inc. (0.10%) |
Preferred Stock |
249,995 | 249,995 | ||||||||||
| Total Wageworks, Inc. |
14,406,400 | 15,295,434 | |||||||||||
| Total Consumer & Business Products (8.59%) |
21,243,937 | 21,949,420 | |||||||||||
| IKANO Communications, Inc. (0.03%) |
Communications | Preferred Stock Warrants |
45,460 | 33,391 | |||||||||
| & Networking | Preferred Stock Warrants |
72,344 | 55,530 | ||||||||||
| Total IKANO Communications, Inc. |
117,804 | 88,921 | |||||||||||
| Interwise, Inc. (0.83%)(4) |
Communications & Networking | Senior Debt |
$ | 2,094,999 | 1,869,542 | 1,869,542 | |||||||
| Preferred Stock Warrants |
268,401 | 244,653 | |||||||||||
| Total Interwise, Inc. |
2,137,943 | 2,114,195 | |||||||||||
| Pathfire, Inc. (1.84%)(4) |
Communications & Networking | Senior Debt |
$ | 4,713,221 | 4,672,795 | 4,672,795 | |||||||
| Preferred Stock Warrants |
63,276 | 16,918 | |||||||||||
| Total Pathfire, Inc. |
4,736,071 | 4,689,713 | |||||||||||
| Ping Identity Corporation (1.05%)(4) |
Communications & Networking | Senior Debt |
$ | 2,569,123 | 2,530,953 | 2,530,953 | |||||||
| Preferred Stock Warrants |
51,801 | 160,500 | |||||||||||
| Total Ping Identity Corporation |
2,582,754 | 2,691,453 | |||||||||||
| Rivulet Communications, Inc. (1.37%)(4) |
Communications & Networking | Senior Debt |
$ | 3,500,000 | 3,459,966 | 3,459,966 | |||||||
| Preferred Stock Warrants |
50,710 | 40,352 | |||||||||||
| Rivulet Communications, Inc. (0.10%) |
Preferred Stock |
250,000 | 250,000 | ||||||||||
| Total Rivulet Communications, Inc. |
3,760,676 | 3,750,318 | |||||||||||
| Simpler Networks Corp. (2.20%)(4) |
Communications & Networking | Senior Debt |
$ | 5,000,000 | 4,886,659 | 4,886,659 | |||||||
| Preferred Stock Warrants |
160,241 | 742,688 | |||||||||||
| Simpler Networks Corp. (0.20%) |
Preferred Stock |
500,000 | 500,000 | ||||||||||
| Total Simpler Networks Corp. |
5,546,900 | 6,129,347 | |||||||||||
| Total Communications & Networking (7.62%) |
18,882,148 | 19,463,947 | |||||||||||
See notes to consolidated financial statements.
F-7
HERCULES TECHNOLOGY GROWTH CAPITAL., INC.
CONSOLIDATED SCHEDULE OF INVESTMENTS—(Continued)
December 31, 2006
| Portfolio Company |
Industry |
Type of Investment(1)(7) |
Principal Amount | Cost(2) | Value(3) | ||||||||
| Adiana, Inc. (0.53%)(4) |
Medical Devices & Equipment | Senior Debt |
$ | 1,346,551 | $ | 1,312,938 | $ | 1,312,938 | |||||
| Preferred Stock Warrants |
67,225 | 52,427 | |||||||||||
| Adiana, Inc. (0.20%) |
Preferred Stock |
500,000 | 500,000 | ||||||||||
| Total Adiana, Inc. |
1,880,163 | 1,865,365 | |||||||||||
| BARRX Medical, Inc. (0.59%) |
Medical Devices & Equipment | Preferred Stock |
1,500,000 | 1,500,000 | |||||||||
| Total BARRX Medical, Inc. |
1,500,000 | 1,500,000 | |||||||||||
| Gynesonics, Inc. (0.80%) |
Medical Devices & Equipment | Senior Debt |
$ | 2,000,000 | 1,986,209 | 1,986,209 | |||||||
| Preferred Stock Warrants |
17,552 | 54,735 | |||||||||||
| Total Gynesonics, Inc. |
2,003,761 | 2,040,944 | |||||||||||
| Novasys Medical, Inc. (3.13%)(4) |
Medical Devices & Equipment | Senior Debt |
$ | 8,000,000 | 8,000,000 | 8,000,000 | |||||||
| Total Novasys Medical, Inc. |
8,000,000 | 8,000,000 | |||||||||||
| Optiscan Biomedical, Corp. (0.40%)(4) |
Medical Devices & Equipment | Senior Debt |
$ | 1,006,259 | 967,314 | 967,314 | |||||||
| Preferred Stock Warrants |
80,486 | 64,478 | |||||||||||
| Optiscan Biomedical, Corp. (0.39%) |
Preferred Stock |
1,000,000 | 1,000,000 | ||||||||||
| Total Optiscan Biomedical, Corp. |
2,047,800 | 2,031,792 | |||||||||||
| Power Medical Interventions, Inc. (0.01%) |
Medical Devices & Equipment | Common Stock Warrants |
20,687 | 30,200 | |||||||||
| Total Power Medical Interventions, Inc. |
20,687 | 30,200 | |||||||||||
| Xillix Technologies Corp. (1.53%)(4)(5)(6) |
Medical Devices & Equipment | Senior Debt |
$ | 3,975,834 | 3,775,493 | 3,775,493 | |||||||
| Common Stock Warrants |
313,108 | 122,206 | |||||||||||
| Total Xillix Technologies Corp. |
4,088,601 | 3,897,699 | |||||||||||
| Total Medical Devices & Equipment (7.58%) |
19,541,012 | 19,366,000 | |||||||||||
| Hedgestreet, Inc. (1.67%)(4) |
Internet Consumer & Business Services |
Senior Debt |
$ | 4,263,806 | 4,226,674 | 4,226,674 | |||||||
| Preferred Stock Warrants |
54,956 | 44,836 | |||||||||||
| Total Hedgestreet, Inc. |
4,281,630 | 4,271,510 | |||||||||||
| Invoke Solutions, Inc. (0.97%)(4) |
Internet Consumer & Business Services |
Senior Debt |
$ | 2,466,574 | 2,438,574 | 2,438,574 | |||||||
| Preferred Stock Warrants |
43,826 | 35,741 | |||||||||||
| Total Invoke Solutions, Inc. |
2,482,400 | 2,474,315 | |||||||||||
| RazorGator Interactive Group, Inc. (1.25%)(4) |
Internet Consumer & Business Services |
Senior Debt |
$ | 2,637,626 | 2,633,276 | 2,633,276 | |||||||
| Preferred Stock Warrants |
13,050 | 570,026 | |||||||||||
| RazorGator Interactive Group, Inc. (0.67%) |
Preferred Stock |
1,000,000 | 1,708,178 | ||||||||||
| Total RazorGator Interactive Group, Inc. |
3,646,326 | 4,911,480 | |||||||||||
| Total Internet Consumer & Business Services (4.56%) |
$ | 10,410,356 | $ | 11,657,305 | |||||||||
See notes to consolidated financial statements.
F-8
HERCULES TECHNOLOGY GROWTH CAPITAL., INC.
CONSOLIDATED SCHEDULE OF INVESTMENTS—(Continued)
December 31, 2006
| Portfolio Company |
Industry |
Type of Investment(1)(7) |
Principal Amount | Cost(2) | Value(3) | ||||||||
| Agami Systems, Inc. (2.75%)(4) |
Electronics & Computer Hardware | Senior Debt |
$ | 7,000,000 | $ | 6,924,288 | $ | 6,924,288 | |||||
| Preferred Stock Warrants |
85,601 | 79,040 | |||||||||||
| Total Agami Systems, Inc. |
7,009,889 | 7,003,328 | |||||||||||
| Cornice, Inc. (1.44%)(4) |
Electronics & Computer Hardware | Senior Debt |
$ | 3,524,664 | 3,459,755 | 3,459,755 | |||||||
| Preferred Stock Warrants |
101,597 | 80,181 | |||||||||||
| Preferred Stock Warrants |
35,353 | 27,571 | |||||||||||
| Preferred Stock Warrants |
135,403 | 106,862 | |||||||||||
| Total Cornice, Inc. |
3,732,108 | 3,674,369 | |||||||||||
| Luminus Devices, Inc. (5.88%)(4) |
Electronics & Computer Hardware | Senior Debt |
$ | 15,000,000 | 14,765,514 | 14,765,514 | |||||||
| Preferred Stock Warrants |
183,290 | 161,106 | |||||||||||
| Preferred Stock Warrants |
83,529 | 83,466 | |||||||||||
| Total Luminus Devices, Inc. |
15,032,333 | 15,010,086 | |||||||||||
| NeoScale Systems, Inc. (1.17%)(4) |
Electronics & Computer Hardware | Senior Debt |
$ | 3,000,000 | 2,978,373 | 2,978,373 | |||||||
| Preferred Stock Warrants |
23,593 | 22,525 | |||||||||||
| Total NeoScale Systems, Inc. |
3,001,966 | 3,000,898 | |||||||||||
| Sling Media, Inc. (0.56%) |
Electronics & Computer Hardware | Preferred Stock Warrants |
38,968 | 936,565 | |||||||||
| Preferred Stock |
500,000 | 500,000 | |||||||||||
| Total Sling Media, Inc. |
538,968 | 1,436,565 | |||||||||||
| ViDeOnline Communications, Inc. (0.18%)(4) |
Electronics & Computer Hardware | Senior Debt |
$ | 461,158 | 461,158 | 461,158 | |||||||
| Preferred Stock Warrants |
— | — | |||||||||||
| Total ViDeOnline Communications, Inc. |
461,158 | 461,158 | |||||||||||
| Total Electronics & Computer Hardware (11.98%) |
29,776,422 | 30,586,404 | |||||||||||
| Ageia Technologies, Inc. (2.76%)(4) |
Semiconductors | Senior Debt |
$ | 7,027,806 | 6,975,456 | 6,975,456 | |||||||
| Preferred Stock Warrants |
99,190 | 73,604 | |||||||||||
| Ageia Technologies, Inc. (0.20%) |
Preferred Stock |
500,000 | 500,000 | ||||||||||
| Total Ageia Technologies |
7,574,646 | 7,549,060 | |||||||||||
| Cradle Technologies (0.02%) |
Semiconductors | Preferred Stock Warrants |
79,150 | 63,647 | |||||||||
| Total Cradle Technologies |
79,150 | 63,647 | |||||||||||
| iWatt Inc. (1.27%)(4) |
Semiconductors | Senior Debt |
$ | 2,000,000 | 1,959,537 | 1,959,537 | |||||||
| Revolving Line of Credit Matures September 2007 Interest rate Prime + 1.75% |
$ | 1,250,000 | 1,250,000 | 1,250,000 | |||||||||
| Preferred Stock Warrants |
45,684 | 41,417 | |||||||||||
| Total iWatt Inc. |
3,255,221 | 3,250,954 | |||||||||||
See notes to consolidated financial statements.
F-9
HERCULES TECHNOLOGY GROWTH CAPITAL., INC.
CONSOLIDATED SCHEDULE OF INVESTMENTS—(Continued)
December 31, 2006
| Portfolio Company |
Industry |
Type of Investment(1)(7) |
Principal Amount | Cost(2) | Value(3) | ||||||||
| NEXX Systems, Inc. (1.96%)(4) |
Semiconductors | Senior Debt |
$ | 4,000,000 | $ | 3,919,015 | $ | 3,919,015 | |||||
| Revolving Line of Credit |
$ | 1,000,000 | 1,000,000 | 1,000,000 | |||||||||
| Preferred Stock Warrants |
83,116 | 83,938 | |||||||||||
| Total NEXX Systems, Inc. |
5,002,131 | 5,002,953 | |||||||||||
| Total Semiconductors (6.21%) |
15,911,148 | 15,866,614 | |||||||||||
| Lilliputian Systems, Inc. (3.33%)(4) |
Energy | Senior Debt |
$ | 8,500,000 | 8,463,170 | 8,463,170 | |||||||
| Preferred Stock Warrants |
48,460 | 39,572 | |||||||||||
| Total Lilliputian Systems, Inc. |
8,511,630 | 8,502,742 | |||||||||||
| Total Energy (3.33%) |
8,511,630 | 8,502,742 | |||||||||||
| Total Investments (110.89%) |
$ | 279,946,465 | $ | 283,233,751 | |||||||||
| * | Value as a percent of net assets |
| (1) | Preferred and common stock, warrants, and equity interests are generally non-income producing. |
| (2) | Gross unrealized appreciation, gross unrealized depreciation, and net appreciation totaled $4,919,518, $1,632,232 and $3,287,286, respectively. |
| (3) | Except for warrants in three publicly traded companies, all investments are restricted at December 31, 2006 and were valued at fair value as determined in good faith by the Board of Directors. No unrestricted securities of the same issuer are outstanding. The Company uses the Standard Industrial Code for classifying the industry grouping of its portfolio companies. |
| (4) | Debt and warrant investments of this portfolio company have been pledged as collateral under the Citigroup Facility. Citigroup has an equity participation right on loans collateralized under the Citigroup Facility. The value of their participation right on unrealized gains in the related equity investments was approximately $377,000 at December 31, 2006 and is included in accrued liabilities and reduces the unrealized gain recognized by the Company at December 31, 2006. |
| (5) | Non-U.S. company or the company’s principal place of business is outside the United States. |
| (6) | Debt is on non-accrual status at December 31, 2006, and is therefore considered non-income producing. |
| (7) | All investments are less than 5% owned. |
See notes to consolidated financial statements.
F-10
HERCULES TECHNOLOGY GROWTH CAPITAL., INC.
CONSOLIDATED SCHEDULE OF INVESTMENTS
December 31, 2005
| Portfolio Company |
Industry |
Type of Investment(1)(5) |
Principal Amount | Cost(2) | Value(3)(4) | ||||||||
| Acceleron Pharmaceuticals, Inc. (3.50%)* |
Biopharmaceuticals | Senior Debt |
$ | 4,000,000 | $ | 3,932,539 | $ | 3,932,539 | |||||
| Preferred Stock Warrants |
69,106 | 68,054 | |||||||||||
| Total Acceleron Pharmaceuticals, Inc. |
4,001,645 | 4,000,593 | |||||||||||
| Guava Technologies, Inc. (3.94%) |
Biopharmaceuticals | Senior Debt |
$ | 4,500,000 | 4,397,111 | 4,397,111 | |||||||
| Preferred Stock Warrants |
105,399 | 103,837 | |||||||||||
| Total Guava Technologies, Inc. |
4,502,510 | 4,500,948 | |||||||||||
| Labopharm USA, Inc. (8.63%)(4)(6) |
Biopharmaceuticals | Senior Debt |
$ | 9,837,901 | 9,869,420 | 9,869,420 | |||||||
| Labopharm USA, Inc. (1.20%) |
Common Stock |
112,335 | 1,367,268 | ||||||||||
| Total Labopharm USA, Inc. |
9,981,755 | 11,236,688 | |||||||||||
| Merrimack Pharmaceuticals, Inc. (7.89%)(4) |
Biopharmaceuticals | Senior Debt |
$ | 9,000,000 | 8,878,668 | 8,878,668 | |||||||
| Preferred Stock Warrants |
155,456 | 140,675 | |||||||||||
| Total Merrimack Pharmaceuticals, Inc. |
9,034,124 | 9,019,343 | |||||||||||
| Omrix Biopharmaceuticals, Inc. (4.16%) |
Biopharmaceuticals | Senior Debt |
$ | 4,709,994 | 4,701,782 | 4,701,782 | |||||||
| Common Stock Warrants |
11,370 | 58,399 | |||||||||||
| Total Omrix Biopharmaceuticals, Inc. |
4,713,152 | 4,760,181 | |||||||||||
| Paratek Pharmaceuticals, Inc. (8.76%)(4) |
Biopharmaceuticals | Senior Debt |
$ | 10,000,000 | 9,889,320 | 9,889,320 | |||||||
| Preferred Stock Warrants |
137,396 | 141,881 | |||||||||||
| Total Paratek Pharmaceuticals, Inc. |
10,026,716 | 10,031,201 | |||||||||||
| Total Biopharmaceuticals (38.08%) |
42,259,902 | 43,548,954 | |||||||||||
| Atrenta, Inc. (4.38%) |
Software | Senior Debt |
$ | 5,000,000 | 4,869,095 | 4,869,095 | |||||||
| Preferred Stock Warrants |
102,396 | 102,886 | |||||||||||
| Preferred Stock Warrants |
33,760 | 33,760 | |||||||||||
| Total Atrenta, Inc. |
5,005,251 | 5,005,741 | |||||||||||
| Concuity, Inc. (3.99%) |
Software | Senior Debt |
$ | 4,570,498 | 4,567,873 | 4,567,873 | |||||||
| Preferred Stock Warrants |
3,500 | — | |||||||||||
| Total Concuity, Inc. |
4,571,373 | 4,567,873 | |||||||||||
| Gomez, Inc. (1.93%)(4) |
Software | Senior Debt |
$ | 2,197,436 | 2,175,075 | 2,175,075 | |||||||
| Preferred Stock Warrants |
35,000 | 32,467 | |||||||||||
| Total Gomez, Inc. |
2,210,075 | 2,207,542 | |||||||||||
See notes to consolidated financial statements.
F-11
HERCULES TECHNOLOGY GROWTH CAPITAL., INC.
CONSOLIDATED SCHEDULE OF INVESTMENTS—(Continued)
December 31, 2005
| Portfolio Company |
Industry |
Type of Investment(1)(5) |
Principal Amount | Cost(2) | Value(3)(4) | ||||||||
| Inxight Software, Inc. (4.38%)(4) |
Software | Senior Debt |
$ | 5,000,000 | $ | 4,956,279 | $ | 4,956,279 | |||||
| Preferred Stock Warrants |
55,963 | 46,735 | |||||||||||
| Total Inxight Software, Inc. |
5,012,242 | 5,003,014 | |||||||||||
| Metreo, Inc. (1.11%) |
Software | Senior Debt |
$ | 500,000 | 4,525,714 | 1,266,000 | |||||||
| Preferred Stock Warrants |
50,000 | — | |||||||||||
| Total Metreo, Inc. |
4,575,714 | 1,266,000 | |||||||||||
| Proficiency, Inc. (3.51%) |
Software | Senior Debt |
$ | 4,000,000 | 3,917,802 | 3,917,802 | |||||||
| Preferred Stock Warrants |
96,370 | 94,105 | |||||||||||
| Total Proficiency, Inc. |
4,014,172 | 4,011,907 | |||||||||||
| Sportvision, Inc. (3.08%)(4) |
Software | Senior Debt |
$ | 3,518,716 | 3,488,119 | 3,488,119 | |||||||
| Preferred Stock Warrants |
39,339 | 38,523 | |||||||||||
| Total Sportvision, Inc. |
3,527,458 | 3,526,642 | |||||||||||
| Talisma Corp. (2.99%)(4) |
Software | Subordinated Debt |
$ | 3,410,120 | 3,378,814 | 3,378,814 | |||||||
| Preferred Stock Warrants |
49,000 | 43,428 | |||||||||||
| Total Talisma Corp. |
3,427,814 | 3,422,242 | |||||||||||
| Total Software (25.37%) |
32,344,099 | 29,010,961 | |||||||||||
| Wageworks, Inc. (17.12%)(4) |
Consumer & Business Products | Senior Debt |
$ | 18,583,966 | 18,379,995 | 18,379,995 | |||||||
| Preferred Stock Warrants |
251,964 | 1,197,735 | |||||||||||
| Wageworks, Inc. (0.22%) |
Preferred Stock |
249,995 | 249,995 | ||||||||||
| Total Wageworks, Inc. |
18,881,954 | 19,827,725 | |||||||||||
| Total Consumer & Business Products (17.34%) |
18,881,954 | 19,827,725 | |||||||||||
| IKANO Communications, Inc. (14.44%)(4) |
Communications & Networking | Senior Debt |
$ | 16,454,540 | 16,402,789 | 16,402,789 | |||||||
| Preferred Stock Warrants |
45,460 | 43,710 | |||||||||||
| Preferred Stock Warrants |
72,344 | 71,000 | |||||||||||
| Total IKANO Communications, Inc. |
16,520,593 | 16,517,499 | |||||||||||
| Interwise, Inc. (2.46%)(4) |
Communications & Networking | Senior Debt |
$ | 2,809,653 | 2,809,653 | 2,809,653 | |||||||
| Total Interwise, Inc. |
2,809,653 | 2,809,653 | |||||||||||
| Occam Networks, Inc. (2.79%) |
Communications & Networking | Senior Debt |
$ | 2,559,827 | 2,540,021 | 2,540,021 | |||||||
| Preferred Stock Warrants |
14,000 | 286,364 | |||||||||||
| Common Stock Warrants |
17,000 | 368,935 | |||||||||||
| Total Occam Networks, Inc. |
2,571,021 | 3,195,320 | |||||||||||
See notes to consolidated financial statements.
F-12
HERCULES TECHNOLOGY GROWTH CAPITAL., INC.
CONSOLIDATED SCHEDULE OF INVESTMENTS—(Continued)
December 31, 2005
| Portfolio Company |
Industry |
Type of Investment(1)(5) |
Principal Amount | Cost(2) | Value(3)(4) | ||||||||
| Optovia Corporation (4.37%) |
Communications & Networking | Senior Debt |
$ | 5,000,000 | $ | 5,000,000 | $ | 5,000,000 | |||||
| Total Optovia Corporation |
5,000,000 | 5,000,000 | |||||||||||
| Pathfire, Inc. (4.38%) |
Communications & Networking | Senior Debt |
$ | 5,000,000 | 4,938,482 | 4,938,482 | |||||||
| Preferred Stock Warrants |
63,276 | 64,144 | |||||||||||
| Total Pathfire, Inc. |
5,001,758 | 5,002,626 | |||||||||||
| Total Communications & Networking (28.44%) |
31,903,025 | 32,525,098 | |||||||||||
| Adiana, Inc. (1.76%)(4) |
Medical Devices & Equipment | Senior Debt |
$ | 2,000,000 | |||||||||
| Preferred Stock Warrants |
1,943,979 | 1,943,979 | |||||||||||
| Preferred Stock |
67,225 | 66,404 | |||||||||||
| Adiana, Inc. (0.44%) |
500,000 | 500,000 | |||||||||||
| Total Adiana, Inc. |
2,511,204 | 2,510,383 | |||||||||||
| Optiscan Biomedical, Corp. (1.54%)(4) |
Medical Devices & Equipment |
Senior Convertible Term |
$ | 1,753,164 | 1,683,063 | 1,683,063 | |||||||
| Preferred Stock Warrants |
80,486 | 81,185 | |||||||||||
| Optiscan Biomedical, Corp. (0.87%) |
Preferred Stock |
1,000,000 | 1,000,000 | ||||||||||
| Total Optiscan Biomedical, Corp. |
2,763,549 | 2,764,248 | |||||||||||
| Power Medical Interventions, Inc. (3.52%) |
Medical Devices & Equipment | Senior Debt |
$ | 4,000,000 | 3,969,515 | 3,969,515 | |||||||
| Common Stock Warrants |
39,195 | 56,490 | |||||||||||
| Total Power Medical Interventions, Inc. |
4,008,710 | 4,026,005 | |||||||||||
| Xillix Technologies Corp. (4.83%)(6) |
Medical Devices & Equipment | Senior Debt |
$ | 5,500,000 | 5,195,589 | 5,195,589 | |||||||
| Preferred Stock Warrants |
313,108 | 325,601 | |||||||||||
| Total Xillix Technologies Corp. |
5,508,697 | 5,521,190 | |||||||||||
| Total Medical Devices & Equipment (12.96%) |
14,792,160 | 14,821,826 | |||||||||||
| Affinity Express, Inc. (1.54%)(4) |
Internet Consumer & Business | Senior Debt |
$ | 1,583,531 | 1,560,450 | 1,560,450 | |||||||
| Services | Common Stock Warrants |
17,000 | 187,922 | ||||||||||
| Common Stock Warrants |
15,000 | 12,995 | |||||||||||
| Affinity Express, Inc. (0.22%) |
Preferred Stock |
250,000 | 250,000 | ||||||||||
| Total Affinity Express, Inc. |
1,842,450 | 2,011,367 | |||||||||||
| Invoke Solutions, Inc. (1.31%) |
Internet Consumer & Business | Senior Debt |
$ | 1,500,000 | 1,457,391 | 1,457,391 | |||||||
| Services | Preferred Stock Warrants |
43,826 | 44,155 | ||||||||||
| Total Invoke Solutions, Inc. |
1,501,217 | 1,501,546 | |||||||||||
See notes to consolidated financial statements.
F-13
HERCULES TECHNOLOGY GROWTH CAPITAL., INC.
CONSOLIDATED SCHEDULE OF INVESTMENTS—(Continued)
December 31, 2005
| Portfolio Company |
Industry |
Type of Investment(1)(5) |
Principal Amount | Cost(2) | Value(3)(4) | ||||||||
| RazorGator Interactive Group, Inc. (3.64%)(4) |
Internet Consumer & Business | Senior Debt |
$ | 4,104,553 | $ | 4,095,853 | $ | 4,095,853 | |||||
| Services | Preferred Stock Warrants |
13,050 | 64,833 | ||||||||||
| RazorGator Interactive Group, Inc. (0.87%) |
Preferred Stock |
1,000,000 | 1,000,000 | ||||||||||
| Total RazorGator Interactive Group, Inc. |
5,108,903 | 5,160,686 | |||||||||||
| Total Internet Consumer & Business Service (7.58%) |
8,452,570 | 8,673,599 | |||||||||||
| Cornice Inc. (11.24%)(4) |
Electronics & Computer Hardware | Senior Debt |
$ | 5,000,000 | 4,915,455 | 4,915,455 | |||||||
| Revolving Line of Credit |
$ | 7,834,131 | 7,663,375 | 7,663,375 | |||||||||
| Preferred Stock Warrants |
101,597 | 99,336 | |||||||||||
| Preferred Stock Warrants |
35,353 | 34,230 | |||||||||||
| Preferred Stock Warrants |
135,403 | 132,390 | |||||||||||
| Total Cornice, Inc. |
12,851,183 | 12,844,786 | |||||||||||
| Sling Media, Inc. (4.29%)(4) |
Electronics & Computer Hardware | Senior Debt |
$ | 4,000,000 | 3,965,029 | 3,965,029 | |||||||
| Preferred Stock Warrants |
38,968 | 945,365 | |||||||||||
| Total Sling Media, Inc. |
4,003,997 | 4,910,394 | |||||||||||
| Total Electronics & Computer Hardware (15.53%) |
16,855,180 | 17,755,180 | |||||||||||
| Ageia Technologies (7.00%)(4) |
Semiconductor | Senior Debt |
$ | 8,000,000 | 7,914,586 | 7,914,586 | |||||||
| Preferred Stock Warrants |
99,190 | 93,518 | |||||||||||
| Ageia Technologies |
Preferred Stock |
500,000 | 500,000 | ||||||||||
| Total Ageia Technologies |
8,513,776 | 8,508,104 | |||||||||||
| Cradle Technologies (1.75%) |
Semiconductors | Senior Debt |
$ | 2,000,000 | 1,923,049 | 1,923,049 | |||||||
| Preferred Stock Warrants |
79,150 | 78,730 | |||||||||||
| Total Cradle Technologies |
2,002,199 | 2,001,779 | |||||||||||
| Total Semiconductors (9.20%) |
10,515,975 | 10,509,883 | |||||||||||
| Total Investments (154.50%) |
$ | 176,004,865 | $ | 176,673,226 | |||||||||
| * | Value as a percent of net assets |
| (1) | All debt investments are income producing. Preferred and common stock and all warrants are non-income producing. |
| (2) | Tax cost at December 31, 2005 equals book cost. Gross unrealized appreciation, gross unrealized depreciation, and net appreciation totaled $4,035,789, $3,367,428 and $668,361, respectively, at December 31, 2005. |
| (3) | Except for common stock held in Labopharm Biopharmaceuticals, all investments are restricted at December 31, 2005 and were valued at fair value as determined in good faith by the Board of Directors. No unrestricted securities of the same issuer are outstanding. The Company uses the Standard Industrial Code for classifying the industry grouping of its portfolio companies. |
| (4) | Debt and warrant investments of this portfolio company have been pledged as collateral under the Citigroup Facility. (see Note 5) Citigroup has an equity participation right on warrants collateralized under the Citigroup Facility. The value of their participation right on unrealized gains in the related equity investments was approximately $342,000 at December 31, 2005 and is included in accrued liabilities and reduces the unrealized gain recognized by the Company at December 31, 2005. |
| (5) | All investments are less than 5% owned. |
| (6) | Non-U.S. company or the company’s principal place of business is outside of the United States. |
See notes to consolidated financial statements.
F-14
HERCULES TECHNOLOGY GROWTH CAPITAL, INC.
CONSOLIDATED STATEMENTS OF OPERATIONS
| Year Ended December 31, 2006 |
Year Ended December 31, 2005 |
Period
from operations) to |
|||||||||
| Investment income: |
|||||||||||
| Interest |
$ | 26,278,090 | $ | 9,791,214 | $ | 214,100 | |||||
| Fees |
3,230,366 | 875,429 | — | ||||||||
| Total investment income |
29,508,456 | 10,666,643 | 214,100 | ||||||||
| Operating expenses: |
|||||||||||
| Interest |
5,770,485 | 1,800,536 | — | ||||||||
| Loan fees |
809,907 | 1,098,507 | — | ||||||||
| Employee compensation: |
|||||||||||
| Compensation and benefits |
5,778,862 | 3,705,784 | 1,164,504 | ||||||||
| Stock-based compensation |
617,600 | 252,000 | 680,000 | ||||||||
| Total employee compensation |
6,396,462 | 3,957,784 | 1,844,504 | ||||||||
| General and administrative |
5,408,785 | 2,285,038 | 411,418 | ||||||||
| Total operating expenses |
18,385,639 | 9,141,865 | 2,255,922 | ||||||||
| Net investment income (loss) before provision for income taxes and investment gains and losses |
11,122,817 | 1,524,778 | (2,041,822 | ) | |||||||
| Provision for income taxes |
643,088 | 255,000 | — | ||||||||
| Net investment income (loss) |
10,479,729 | 1,269,778 | (2,041,822 | ) | |||||||
| Net realized gain (loss) on investments |
(1,603,692 | ) | 481,694 | — | |||||||
| Net increase in unrealized appreciation on investments |
2,507,561 | 353,093 | — | ||||||||
| Net realized and unrealized gain |
903,869 | 834,787 | — | ||||||||
| Net increase (decrease) in net assets resulting from operations |
$ | 11,383,598 | $ | 2,104,565 | $ | (2,041,822 | ) | ||||
| Net investment income (loss) before provision for income taxes and investment gains and losses per common share: |
|||||||||||
| Basic |
$ | 0.83 | $ | 0.22 | $ | (1.72 | ) | ||||
| Diluted |
$ | 0.82 | $ | 0.22 | $ | (1.58 | ) | ||||
| Change in net assets per common share: |
|||||||||||
| Basic |
$ | 0.85 | $ | 0.30 | $ | (1.72 | ) | ||||
| Diluted |
$ | 0.84 | $ | 0.30 | $ | (1.58 | ) | ||||
| Weighted average shares outstanding: |
|||||||||||
| Basic |
13,352,000 | 6,939,000 | 1,187,000 | ||||||||
| Diluted |
13,527,000 | 7,016,000 | 1,293,000 | ||||||||
See notes to consolidated financial statements.
F-15
HERCULES TECHNOLOGY GROWTH CAPITAL, INC.
CONSOLIDATED STATEMENTS OF CHANGES IN NET ASSETS
| Common Stock | Preferred Stock | Capital in of par value |
Unrealized Appreciation on Investments |
Accumulated Realized on Investments |
Distributions in Excess of Investment |
Net Assets |
|||||||||||||||||||||||||
| Shares | Par Value | Shares | Par Value | ||||||||||||||||||||||||||||
| Balance at February 2, 2004 (commencement of operations) |
— | $ | — | — | $ | — | $ | — | $ | — | $ | — | $ | — | $ | — | |||||||||||||||
| Net decrease in net assets resulting from operations |
— | — | — | — | — | — | — | (2,041,822 | ) | (2,041,822 | ) | ||||||||||||||||||||
| Issuance of convertible preferred stock, net of placement fees |
— | — | 600 | 1 | 2,574,999 | — | — | — | 2,575,600 | ||||||||||||||||||||||
| Issuance of common stock, net of offering costs |
1,809,270 | 1,809 | — | — | 23,863,146 | — | — | — | 23,864,955 | ||||||||||||||||||||||
| Conversion of preferred stock to common stock |
250,000 | 250 | (600 | ) | (1 | ) | (249 | ) | — | — | — | (600 | ) | ||||||||||||||||||
| Stock-based compensation |
— | — | — | — | 680,000 | — | — | — | 680,000 | ||||||||||||||||||||||
| Balance at December 31, 2004 |
2,059,270 | 2,059 | — | — | 27,117,896 | — | — | (2,041,822 | ) | 25,078,133 | |||||||||||||||||||||
| Net increase in net assets resulting from operations |
— | — | — | — | — | 353,093 | 481,694 | 1,269,778 | 2,104,565 | ||||||||||||||||||||||
| Issuance of common shares, net of offering costs |
268,134 | 268 | — | — | 3,870,542 | — | — | — | 3,870,810 | ||||||||||||||||||||||
| Issuance of shares in lieu of 5 year warrants |
298,598 | 299 | — | — | (299 | ) | — | — | — | — | |||||||||||||||||||||
| Issuance of shares on exercise of 1 year warrants |
1,175,963 | 1,176 | — | — | 12,428,744 | — | — | — | 12,429,920 | ||||||||||||||||||||||
| Issuance of common shares in IPO, net of offering costs |
6,000,000 | 6,000 | — | — | 70,855,950 | — | — | — | 70,861,950 | ||||||||||||||||||||||
| Dividends declared |
— | — | — | — | — | — | — | (245,048 | ) | (245,048 | ) | ||||||||||||||||||||
| Stock-based compensation |
— | — | — | — | 252,000 | — | — | — | 252,000 | ||||||||||||||||||||||
| Balance at December 31, 2005 |
9,801,965 | 9,802 | — | — | 114,524,833 | 353,093 | 481,694 | (1,017,092 | ) | 114,352,330 | |||||||||||||||||||||
| Net increase in net assets resulting from operations |
— | — | — | — | — | 2,507,561 | (1,603,692 | ) | 10,479,729 | 11,383,598 | |||||||||||||||||||||
| Issuance of common shares |
456,234 | 456 | — | — | 5,288,457 | — | — | — | 5,288,913 | ||||||||||||||||||||||
| Issuance of common shares in Rights Offering, net of offering costs |
3,411,992 | 3,412 | — | — | 33,825,908 | — | — | — | 33,829,320 | ||||||||||||||||||||||
| Issuance of common shares in Public Offerings, net of offering costs |
8,200,000 | 8,200 | — | — | 104,171,213 | — | — | — | 104,179,413 | ||||||||||||||||||||||
| Issuance of common stock under dividend reinvestment plan |
56,843 | 57 | — | — | 723,218 | — | — | — | 723,275 | ||||||||||||||||||||||
| Dividends declared |
— | — | — | — | (1,719,107 | ) | — | — | (13,242,520 | ) | (14,961,627 | ) | |||||||||||||||||||
| Conversion to RIC and other tax items |
— | — | — | — | (197,393 | ) | — | (850,016 | ) | 1,047,409 | — | ||||||||||||||||||||
| Stock-based compensation |
— | — | — | — | 617,600 | — | — | — | 617,600 | ||||||||||||||||||||||
| Balance at December 31, 2006 |
21,927,034 | $ | 21,927 | — | $ | — | $ | 257,234,729 | $ | 2,860,654 | $ | (1,972,014 | ) | $ | (2,732,474 | ) | $ | 255,412,822 | |||||||||||||
See notes to consolidated financial statements.
F-16
HERCULES TECHNOLOGY GROWTH CAPITAL, INC.
CONSOLIDATED STATEMENTS OF CASH FLOWS
| Year Ended December 31, | Period from February 2, 2004 (commencement of operations) to December 31, 2004 |
|||||||||||
| 2006 | 2005 | |||||||||||
| Cash flows from operating activities: |
||||||||||||
| Net increase in net assets resulting from operations |
$ | 11,383,598 | $ | 2,104,565 | $ | (2,041,822 | ) | |||||
| Adjustments to reconcile net increase in net assets resulting from operations to net cash used in operating activities: |
||||||||||||
| Purchase of investments |
(195,988,389 | ) | (177,834,136 | ) | (16,700,000 | ) | ||||||
| Principal payments received on investments |
87,538,833 | 18,822,828 | — | |||||||||
| Proceeds from sale of investments |
4,587,979 | 531,458 | ||||||||||
| Net unrealized appreciation on investments |
(2,507,561 | ) | (353,093 | ) | — | |||||||
| Net unrealized appreciation on investments due to lender |
34,334 | (342,297 | ) | — | ||||||||
| Net realized depreciation on investments |
1,603,692 | (481,694 | ) | — | ||||||||
| Accretion of loan discounts |
(1,795,079 | ) | (358,611 | ) | — | |||||||
| Accretion of loan exit fees |
(597,192 | ) | (350,944 | ) | — | |||||||
| Depreciation |
65,185 | 23,605 | 7,533 | |||||||||
| Stock-based compensation |
617,600 | 252,000 | 680,000 | |||||||||
| Common stock issued in lieu of Director compensation |
288,913 | — | — | |||||||||
| Amortization of deferred loan origination revenue |
(2,355,734 | ) | (790,169 | ) | — | |||||||
| Change in operating assets and liabilities: |
||||||||||||
| Interest receivable |
(830,264 | ) | (1,047,529 | ) | (80,902 | ) | ||||||
| Prepaid expenses and other current assets |
806,430 | (1,289,652 | ) | (23,442 | ) | |||||||
| Income tax receivable |
(34,184 | ) | — | — | ||||||||
| Deferred tax asset |
1,454,000 | (1,454,000 | ) | — | ||||||||
| Accounts payable |
390,295 | 148,102 | (2,481 | ) | ||||||||
| Income tax payable |
(1,709,000 | ) | 1,709,000 | — | ||||||||
| Accrued liabilities |
2,718,209 | 1,283,908 | 157,020 | |||||||||
| Deferred loan origination revenue |
3,076,723 | 3,277,238 | 285,232 | |||||||||
| Net cash used in operating activities |
(91,251,612 | ) | (156,149,421 | ) | (17,718,862 | ) | ||||||
| Cash flows from investing activities: |
||||||||||||
| Purchases of capital equipment |
(817,006 | ) | (66,047 | ) | (40,264 | ) | ||||||
| Other long-term assets |
(659,996 | ) | (18,046 | ) | (2,500 | ) | ||||||
| Net cash provided by (used in) investing activities |
(1,477,002 | ) | (84,093 | ) | (42,764 | ) | ||||||
| Cash flows from financing activities: |
||||||||||||
| Proceeds from issuance of convertible preferred stock, net |
— | — | 2,575,000 | |||||||||
| Proceeds from issuance of common stock, net |
143,008,733 | 87,162,680 | 23,864,955 | |||||||||
| Dividends paid |
(14,238,352 | ) | (245,048 | ) | — | |||||||
| Borrowings of credit facilities |
50,000,000 | 76,000,000 | — | |||||||||
| Repayments of credit facilities |
(85,000,000 | ) | — | — | ||||||||
| Net cash provided by financing activities |
93,770,381 | 162,917,632 | 26,439,955 | |||||||||
| Net increase in cash |
1,041,767 | (148,707,981 | ) | 8,678,329 | ||||||||
| Cash and cash equivalents at beginning of period |
15,362,447 | 8,678,329 | — | |||||||||
| Cash and cash equivalents at end of period |
$ | 16,404,214 | $ | (140,029,652 | ) | $ | 8,678,329 | |||||
| Supplemental Disclosure: |
||||||||||||
| Interest paid |
$ | 5,660,596 | $ | 1,704,243 | $ | — | ||||||
| Income taxes paid |
$ | 933,071 | $ | — | $ | — | ||||||
| Stock issued in lieu of cash dividends |
$ | 723,275 | $ | — | $ | — | ||||||
See notes to consolidated financial statements.
F-17
HERCULES TECHNOLOGY GROWTH CAPITAL, INC.
NOTES TO CONSOLIDATED FINANCIAL STATEMENTS
1. Description of Business, Basis of Presentation and Summary of Significant Accounting Policies
Hercules Technology Growth Capital, Inc. (the “Company”) is a specialty finance company that provides debt and equity growth capital to technology-related and life-science companies at all stages of development. The Company sources its investments through its principal office located in Silicon Valley, as well as through its additional offices in the Boston, Massachusetts, Boulder, Colorado, Columbus, Ohio and Chicago, Illinois areas. The Company was incorporated under the General Corporation Law of the State of Maryland in December 2003. The Company commenced operations on February 2, 2004 and commenced investment activities in September 2004.
The Company is an internally managed, non-diversified closed-end investment company that has elected to be regulated as a business development company (“BDC”) under the Investment Company Act of 1940, as amended (the “1940 Act”). From incorporation through December 31, 2005, the Company was taxed as a corporation under Subchapter C of the Internal Revenue Code of 1986, (the “Code”). In conjunction with the filing of our December 31, 2006 tax return, we intend to elect to be treated as a regulated investment company, or “RIC”, under Subchapter M of the Code effective as of January 1, 2006. The Company expects to continue to qualify and to elect to be treated for tax purposes as a RIC.
In January 2005, the Company formed Hercules Technology II, L.P. (“HTII”) and Hercules Technology SBIC Management, LLC (HTM). On September 27, 2006, HTII became licensed as a Small Business Investment Company (“SBIC”). HTII is able to borrow funds from the Small Business Administration (the “SBA”) against eligible investments and additional contributions to regulatory capital. HTM is a wholly-owned subsidiary of the Company. The Company is the sole limited partner of HTII and HTM is the general partner.
In July 2005, the Company formed Hercules Funding I LLC and Hercules Funding Trust I, an affiliated statutory trust, and executed a securitized credit facility with Citigroup Global Markets Realty Corp. (see Note 4).
In December 2006, we established Hydra Management LLC and Hydra Management Co. Inc., a general partner and investment management group, respectively, should we determine in the future to pursue a relationship with an externally managed fund.
The consolidated financial statements include the accounts of the Company and its subsidiaries. All inter-company accounts and transactions have been eliminated in consolidation. In accordance with Article 6 of Regulation S-X under the Securities Act of 1933 and the Securities and Exchange Act of 1934, the Company does not consolidate portfolio company investments.
Summary of Significant Accounting Policies
Use of Estimates
The accompanying consolidated financial statements are presented in conformity with accounting principles generally accepted in the United States. This requires management to make estimates and assumptions that affect the amounts and disclosures reported in the financial statements and accompanying notes. Such estimates and assumptions could change in the future as more information becomes known, and actual results could differ from those estimates.
Valuation of Investments
Value is defined in Section 2(a)(41) of the 1940 Act, as (i) the market price for those securities for which a market quotation is readily available and (ii) for all other securities and assets, fair value is as determined in good
faith by the Board of Directors. Because the Company invests primarily in structured mezzanine debt investments
F-18
HERCULES TECHNOLOGY GROWTH CAPITAL, INC.
NOTES TO CONSOLIDATED FINANCIAL STATEMENTS—(Continued)
(“debt”) and equity growth capital (“equity”) of privately-held technology-related and life-science companies backed by leading venture capital and private equity firms, the Company values substantially all of its investments at fair value, as determined in good faith by the Board of Directors in accordance with established valuation policies and consistently applied procedures and the recommendations of the Valuation Committee of the Board of Directors. At December 31, 2006, approximately 94% of the Company’s total assets represented investments in portfolio companies of which greater than 99% are valued at fair value by the Board of Directors.
Estimating fair value requires that judgment be applied to the specific facts and circumstances of each portfolio investment. Fair value is the amount for which an investment could be exchanged in an orderly disposition over a reasonable period of time between willing parties other than in a forced or liquidation sale. Due to the inherent uncertainty in the valuation of debt and equity investments that do not have a readily available market value, the fair value established in good faith by the Board of Directors may differ significantly from the values that would have been used had a ready market for the securities existed, and the differences could be material. In addition, changes in the market environment and other events that may occur over the life of the investments may cause the gains or losses ultimately realized on these investments to be different than the valuations currently assigned.
When originating a debt instrument, the Company expects to receive warrants or other equity-related securities from the borrower. The Company determines the cost basis of the warrants or other equity-related securities received based upon their respective fair values on the date of receipt in proportion to the total fair value of the debt and warrants or other equity-related securities received.
At each reporting date, privately held debt and equity securities are valued based on an analysis of various factors including, but not limited to, the portfolio company’s operating performance and financial condition and general market conditions that could impact the valuation. When an external event occurs, such as a purchase transaction, public offering, or subsequent equity sale, the pricing indicated by that external event is utilized to corroborate the Company’s valuation of the debt and equity securities. An unrealized loss is recorded when an investment has decreased in value, including: where collection of a loan is doubtful, there is an adverse change in the underlying collateral or operational performance, there is a change in the borrower’s ability to pay, or there are other factors that lead to a determination of a lower valuation for the debt or equity security. Conversely, unrealized appreciation is recorded when the investment has appreciated in value. Securities that are traded in the over the counter markets or on a stock exchange will be valued at the prevailing bid price at period end. The Board of Directors estimates the fair value of warrants and other equity-related securities in good faith using a Black-Scholes pricing model and consideration of the issuer’s earnings, sales to third parties of similar securities, the comparison to publicly traded securities, and other factors. Any resulting discount on the loan from recordation of the warrant or other equity instruments is accreted into interest income over the life of the loan.
As required by the 1940 Act, the Company classifies its investments by level of control. “Control Investments” are defined in the 1940 Act as investments in those companies that the Company is deemed to “Control.” Generally, under the 1940 Act, the Company is deemed to “Control” a company in which it has invested if it owns 25% or more of the voting securities of such company or has greater than 50% representation on its board. “Affiliate Investments” are investments in those companies that are “Affiliated Companies” of the Company, as defined in the 1940 Act, which are not Control Investments. The Company is deemed to be an “Affiliate” of a company in which it has invested if it owns 5% or more but less than 25% of the voting securities of such company. “Non-Control/Non-Affiliate Investments” are those investments that are neither Control Investments nor Affiliate Investments. At December 31, 2006 and 2005, all of the Company’s investments were in Non-Control/Non-Affiliate companies.
Security transactions are recorded on the trade-date basis.
F-19
HERCULES TECHNOLOGY GROWTH CAPITAL, INC.
NOTES TO CONSOLIDATED FINANCIAL STATEMENTS—(Continued)
Income Recognition
Interest income is recorded on the accrual basis and is recognized as earned in accordance with the contractual terms of the loan agreement to the extent that such amounts are expected to be collected. Original Issue Discount, “OID,” initially represents the value of detachable equity warrants obtained in conjunction with the acquisition of debt securities and is accreted into interest income over the term of the loan as a yield enhancement. When a loan becomes 90 days or more past due, or if management otherwise does not expect the portfolio company to be able to service its debt and other obligations, the Company will, as a general matter, place the loan on non-accrual status and cease recognizing interest income on that loan until all principal has been paid. However, Hercules may make exceptions to this policy if the investment has sufficient collateral value and is in the process of collection. As of December 31, 2006, the Company had one loan on non-accrual status with a fair value of approximately $3.8 million. No loans were on non-accrual status as of December 31, 2005.
Loan origination and commitment fees received in full at the inception of a loan are deferred and amortized into fee income as an enhancement to the related loan’s yield over the contractual life of the loan. Loan exit fees to be paid at the termination of the loan are accreted into fee income over the contractual life of the loan. These fees are reflected as adjustments to the loan yield in accordance with Statement of Financial Standards No. 91, Accounting for Nonrefundable Fees and Costs Associated with Originating or Acquiring loans and Initial Direct Costs of Leases (“FAS 91”). The Company had approximately $3.5 million and $2.7 million of unamortized fees at December 31, 2006 and 2005, respectively, and approximately $1.0 million and $351,000 in exit fees receivable at December 31, 2006 and 2005, respectively.
In certain investment transactions, the Company may provide advisory services. For services that are separately identifiable and external evidence exists to substantiate fair value, income is recognized as earned, which is generally when the investment transaction closes. The Company had no income from advisory services in 2006, 2005 or 2004.
Financing costs
Debt financing costs are fees and other direct incremental costs incurred in obtaining debt financing and are recognized as prepaid expenses or accrued liabilities in the case of back end fees, and are amortized into the consolidated statement of operations as loan fees over the term of the related debt instrument. At December 31, 2006 and 2005, the Company had prepaid debt financing costs of approximately $187,000 and $537,000, net of accumulated amortization. In addition, at December 31, 2005, the Company had accrued debt financings costs of approximately $387,000. The were no accrued debt financing costs at December 31, 2006.
Cash Equivalents
The Company considers money market funds and other highly liquid short-term investments with a maturity of less than 90 days to be cash equivalents.
Depreciation and Amortization
Furniture and equipment are depreciated on a straight-line basis over an estimated useful life of five years. Software and computer equipment are amortized over two and three years, respectively.
Stock Based Compensation
The Company follows Statement of Financial Accounting Standards No. 123 (revised 2004), Share-Based Payment (“FAS 123R”), to account for stock options granted. Under FAS 123R, compensation expense
F-20
HERCULES TECHNOLOGY GROWTH CAPITAL, INC.
NOTES TO CONSOLIDATED FINANCIAL STATEMENTS—(Continued)
associated with stock based compensation is measured at the grant date based on the fair value of the award and is recognized over the vesting period. Determining the appropriate fair value model and calculating the fair value of stock-based awards at the grant date requires judgment, including estimating stock price volatility, forfeiture rate and expected option life.
Earnings per share
Basic earnings per share is computed by dividing net income applicable to common stockholders by the weighted average number of shares of common stock outstanding for the period. Diluted earnings per share is computed by dividing such net income by the sum of weighted average number of shares outstanding for the period and the dilutive effect of potential shares that could occur upon exercise of warrants and common stock options.
Income Taxes
We operate to qualify to be taxed as a RIC under the Internal Revenue Code. Generally, a RIC is entitled to deduct dividends it pays to its shareholders from its income to determine “taxable income.” We have distributed and currently intend to distribute sufficient dividends to eliminate taxable income. Therefore, no provision has been recorded for Federal income taxes for operations in 2006.
Dividends
Dividends and distributions to common stockholders are approved by the Board of Directors on a quarterly basis and the dividend payable is recorded on the ex-dividend date.
We have adopted a dividend reinvestment plan that provides for reinvestment of our distribution on behalf of our stockholders, unless a stockholder elects to receive cash. As a result, if our Board of Directors authorizes, and we declare a cash dividend, then our stockholders whom have not ‘opted out’ of our dividend reinvestment plan will have their cash dividend automatically reinvested in additional shares of our common stock, rather than receiving the cash dividends. During 2006, the Company issued 56,843 shares of common stock to shareholders in connection with the dividend reinvestment plan.
Segments
The Company lends to and invests in portfolio companies in various sectors of technology-related and life-sciences sectors. The Company separately evaluates the performance of each of its lending and investment relationships. However, because each of these loan and investment relationships has similar business and economic characteristics, they have been aggregated into a single lending and investment segment. All segment disclosures are included in or can be derived from the Company’s consolidated financial statements.
Reclassifications
Certain prior period information has been reclassified to conform to current year presentation.
Recent Accounting Pronouncements
On July 13, 2006, the Financial Accounting Standards Board (“FASB”) released FASB Interpretation No. 48 Accounting for Uncertainty in Income Taxes (“FIN 48”). FIN 48 provides guidance for how uncertain tax
F-21
HERCULES TECHNOLOGY GROWTH CAPITAL, INC.
NOTES TO CONSOLIDATED FINANCIAL STATEMENTS—(Continued)
positions should be recognized, measured, presented and disclosed in the financial statements. FIN 48 requires the evaluation of tax positions taken or expected to be taken in the course of preparing The Company’s tax returns to determine whether the tax positions are “more-likely-than-not” of being sustained by the applicable tax authority. Tax positions not deemed to meet the more-likely-than-not threshold would be recorded as a tax benefit or expense in the current year. Adoption of FIN 48 is required for fiscal years beginning after December 15, 2006 and is to be applied to all open tax years as of the effective date. At this time, management is evaluating the implications of FIN 48 and its impact in the financial statements has not yet been determined.
In September 2006, the FASB issued Statement on Financial Accounting Standards No. 157, Fair Value Measurements (“FAS 157”). This standard clarifies the definition of fair value for financial reporting, establishes a framework for measuring fair value and requires additional disclosures about the use of fair value measurements. FAS 157 is effective for financial statements issued for fiscal years beginning after November 15, 2007 and interim periods within those fiscal years. As of December 31, 2006, the Company does not believe the adoption of FAS 157 will impact the amounts reported in the financial statements, however, additional disclosures will be required about the inputs used to develop the measurements of fair value and the effect of certain of the measurements reported in the statement of operations for a fiscal period.
2. Investments
Investments consist of securities issued by privately- and publicly-held companies consisting of senior debt, subordinated debt, warrants and preferred equity securities. Our investments are identified in the accompanying consolidated schedule of investments. Our debt securities are payable in installments with final maturities generally from 2 to 7 years and are generally collateralized by all assets of the borrower.
A summary of the composition of the Company’s investment portfolio as of December 31, 2005 and 2006 at fair value is shown as follows:
| December 31, 2006 | December 31, 2005 | |||||||||||
| ($ in millions) |
Investments at Fair Value |
Percentage of Total Portfolio |
Investments at Fair Value |
Percentage of Total Portfolio |
||||||||
| Senior debt with warrants |
$ | 273.2 | 96.5 | % | $ | 168.4 | 95.3 | % | ||||
| Subordinated debt |
1.9 | 0.7 | % | 3.4 | 1.9 | % | ||||||
| Preferred stock |
8.1 | 2.8 | % | 3.5 | 2.0 | % | ||||||
| Common stock |
— | 0.0 | % | 1.4 | 0.8 | % | ||||||
| $ | 283.2 | 100.0 | % | $ | 176.7 | 100.0 | % | |||||
A summary of the Company’s investment portfolio, at value, by geographic location is as follows:
| December 31, 2006 | December 31, 2005 | |||||||||||
| ($ in millions) |
Investments at Fair Value |
Percentage of Total Portfolio |
Investments at Fair Value |
Percentage of Total Portfolio |
||||||||
| United States |
$ | 269.0 | 95.0 | % | $ | 155.9 | 88.2 | % | ||||
| Canada |
10.5 | 3.7 | % | 16.8 | 9.5 | % | ||||||
| Israel |
3.7 | 1.3 | % | 4.0 | 2.3 | % | ||||||
| $ | 283.2 | 100.0 | % | $ | 176.7 | 100.0 | % | |||||
F-22
HERCULES TECHNOLOGY GROWTH CAPITAL, INC.
NOTES TO CONSOLIDATED FINANCIAL STATEMENTS—(Continued)
The following table shows the fair value of our portfolio by industry sector as of December 31, 2005 and 2006 (excluding unearned income):
| December 31, 2006 | December 31, 2005 | |||||||||||
| ($ in millions) |
Investments at Fair Value |
Percentage of Total Portfolio |
Investments at Fair Value |
Percentage of Total Portfolio |
||||||||
| Biopharmaceuticals |
$ | 115.4 | 40.7 | % | $ | 43.6 | 24.7 | % | ||||
| Software |
40.5 | 14.3 | % | 29.0 | 16.4 | % | ||||||
| Electronics & computer hardware |
30.6 | 10.8 | % | 17.8 | 10.1 | % | ||||||
| Consumer & business products |
22.0 | 7.8 | % | 19.8 | 11.2 | % | ||||||
| Communications & networking |
19.5 | 6.9 | % | 32.5 | 18.4 | % | ||||||
| Medical devices & equipment |
19.4 | 6.9 | % | 14.8 | 8.4 | % | ||||||
| Semiconductors |
15.9 | 5.6 | % | 10.5 | 5.9 | % | ||||||
| Internet consumer & business services |
11.7 | 4.1 | % | 8.7 | 4.9 | % | ||||||
| Energy |
8.2 | 2.9 | % | — | 0.0 | % | ||||||
| $ | 283.2 | 100.0 | % | $ | 176.7 | 100.0 | % | |||||
During the periods ended December 31, 2006 and 2005, the Company made investments in debt securities totaling $193.0 million and $175.3 million, respectively, and made investments in equity securities of approximately $3.0 million and $2.5 million, respectively. In addition, the Company exercised an equity participation right with one portfolio company and converted $1.0 million of debt to equity in 2006 and exercised an equity participation right with one portfolio company and converted $1.0 million of debt to equity in 2005. No single portfolio investment represents more than 10% of the fair value of the investments as of December 31, 2006 and 2005.
3. Credit Facility
On April 12, 2005, the Company entered into a bridge loan credit facility (the “Bridge Loan Credit Facility” or the “Loan”) with Alcmene Funding, L.L.C. (“Alcmene”), a special purpose vehicle that is an affiliate of Farallon Capital Management, L.L.C., a shareholder of the Company. The Loan was subsequently amended on August 1, 2005 and March 6, 2006. The Loan was originally a $25 million senior secured term loan, allowing for up to an additional $25 million of discretionary supplemental senior secured loans. On August 1, 2005, the Company amended the Loan with an agreement extending the term of the Bridge Loan Credit Facility to April 12, 2006. The amendment eliminated the loan extension fee, revised the interest rate effective August 1, 2005 to LIBOR plus 5.6% through December 31, 2005 and thereafter to 13.5% per annum, and amended certain collateral rights and financial covenants. On March 6, 2006, the Company entered into an agreement to repay $10.0 million of the $25.0 million outstanding under its Bridge Loan Credit Facility. The Company also extended the maturity of the remaining $15.0 million to June 30, 2006 and decreased the interest rate from 13.5% to 10.86% per annum. On May 10, 2006, the Company repaid the $15.0 million outstanding under the Bridge Loan Credit Facility and paid a $500,000 loan fee due on maturity plus all accrued and unpaid interest through the date of repayment. At December 31, 2006, the Bridge Loan Credit Facility is no longer outstanding.
4. Securitization Agreement
On August 1, 2005, the Company, through Hercules Funding Trust I, an affiliated statutory trust, executed a $100 million securitized credit facility (the “Citigroup Facility”) with Citigroup Global Markets Realty Corp. (“Citigroup”). Interest on borrowings under the Citigroup Facility are paid monthly and are charged at one-month
F-23
HERCULES TECHNOLOGY GROWTH CAPITAL, INC.
NOTES TO CONSOLIDATED FINANCIAL STATEMENTS—(Continued)
LIBOR plus a spread of 1.65%. The Company paid a loan origination fee equal to 0.25% of the Citigroup Facility. On March 6, 2006, the Company amended the Citigroup Facility with an agreement that increased the borrowing capacity under the facility to $125.0 million, increased the eligible capacity for loans by geographic region and allows for an interest rate of LIBOR plus 2.5% on amounts borrowed in excess of $100.0 million. The Company paid a restructuring fee of $150,000 that was expensed ratably through initial maturity on July 31, 2006. On December 6, 2006, the Company amended the Citigroup Facility with an agreement that increased the borrowing capacity under the facility to $150.0 million. This additional increase expires March 31, 2007 unless extended to a later date.
The Company’s ability to make draws on the Citigroup Facility was to expire on July 31, 2006, however, it was extended for an additional 364-day period with the lenders’ consent on July 28, 2006. Prior to its July 31, 2007 expiration date, the Citigroup Facility may be extended for an additional 364-day period with the lenders’ consent. If the Citigroup Facility is not extended, any principal amounts then outstanding will be amortized over a six-month period through a termination date in January 2008. The Company paid an extension fee equal to 0.25% of the Citigroup Facility borrowing capacity which will be expensed ratably through maturity.
The Citigroup Facility is collateralized by loans and warrants from the Company’s portfolio companies, and includes an advance rate of approximately 55% of eligible loans. The Citigroup Facility contains covenants that, among other things, require the Company to maintain a minimum net worth and to restrict the loans securing the Citigroup Facility to certain dollar amounts, to concentrations in certain geographic regions and industries, to certain loan grade classifications, to certain security interests, and to certain interest payment terms. Citigroup has an equity participation right through a warrant participation agreement on the pool of loans and warrants collateralized under the Citigroup Facility. Pursuant to the warrant participation agreement, the Company granted to Citigroup a 10% participation in all warrants held as collateral. As a result, Citigroup is entitled to 10% of the realized gains on the warrants until the realized gains paid to Citigroup pursuant to the agreement equals $3,750,000 (the “Maximum Participation Limit”). The obligations under the warrant participation agreement continue even after the Citigroup Facility is terminated until the Maximum Participation Limit has been reached. During the year ended December 31, 2006, the Company reduced its realized gain by approximately $221,000 for Citigroup’s participation in the gain on sale of an equity security and recorded an additional liability and reduced its unrealized gains by a net amount of approximately $35,000 for Citigroup’s participation. The value of their participation right on unrealized gains in the related equity investments since inception of the agreement was approximately $377,000 at December 31, 2006 and is included in accrued liabilities and reduces the unrealized gain recognized by the Company at December 31, 2006. Since inception of the agreement, the Company has paid Citigroup approximately $281,000 under the warrant participation agreement thereby reducing its realized gains.
At December 31, 2006, the Company, through its special purpose entity (SPE), had transferred pools of loans and warrants with a fair value of approximately $164.9 million to Hercules Funding Trust I and had drawn $41.0 million under the Citigroup Facility. Transfers of loans have not met the requirements of FAS 140, Accounting for Transfers and Servicing of Financial Assets and Extinguishments of Liabilities, for sales treatment and are, therefore, treated as secured borrowings, with the transferred loans remaining in investments and the related liability recorded in borrowings. The average debt outstanding under the Citigroup Facility for the years ended 2006 and 2005 was approximately $70.6 and $2.3 million, respectively, and the average interest rates were approximately 6.74% and 6.42%, respectively.
5. Income Taxes
Through December 31, 2005 the Company was taxed under Subchapter C of the Internal Revenue Code (the “Code”). An election will be made to be treated as a regulated investment company (“RIC”) under Subchapter M
F-24
HERCULES TECHNOLOGY GROWTH CAPITAL, INC.
NOTES TO CONSOLIDATED FINANCIAL STATEMENTS—(Continued)
of the Code with the filing of the 2006 federal income tax return. The election will be effective as of January 1, 2006. Provided the Company continues to qualify as a RIC and for RIC tax treatment, its income generally will not be subject to federal income or excise tax to the extent it timely makes the requisite distributions to stockholders.
To qualify for RIC tax treatment, the Company is required to meet certain income and asset diversification tests in addition to distributing at least 90% of its investment company taxable income, as defined by the Code. Because federal income tax regulations differ from accounting principles generally accepted in the United States, distributions in accordance with tax regulations may differ from net investment income and realized gains recognized for financial reporting purposes. Differences may be permanent or temporary in nature. Permanent differences are reclassified among capital accounts in the financial statements to reflect their tax character. Differences in classification may also result from the treatment of short-term gains as ordinary income for tax purposes. During the year ended December 31, 2006, the Company reclassified for book purposes amounts arising from permanent book/tax differences primarily related to return of capital distributions as follows:
| 2006 | ||||
| Distributions in excess of net investment income |
$ | 2,766,516 | ||
| Accumulated realized losses |
$ | (850,016 | ) | |
| Additional paid-in capital |
$ | (1,916,500 | ) | |
For income tax purposes, distributions paid to shareholders are reported as ordinary income, return of capital, long term capital gains or a combination thereof. The tax character of distributions paid for the year ended December 31, 2006 was as follows:
| 2006 | |||
| Ordinary income(a) |
$ | 13,242,520 | |
| Return of capital |
1,719,107 | ||
| Distributions on a Tax Basis |
$ | 14,961,627 | |
| (a) | Ordinary income is reported on form 1099-DIV as non-qualified. |
For federal income tax purposes, the cost of investments owned at December 31, 2006 was approximately $283 million.
At December 31, 2006, the components of distributable earnings on a tax basis detailed below differ from the amounts reflected in the Company’s Statement of Assets and Liabilities by temporary book/tax differences primarily arising from the treatment of loan related yield enhancements.
| 2006 | ||||
| Accumulated Capital Losses |
$ | (89,117 | ) | |
| Other Temporary Difference |
(1,593,341 | ) | ||
| Unrealized Appreciation/(Depreciation) |
(161,376 | ) | ||
| Components of Distributable Earnings at December, 31, 2006 |
$ | (1,843,834 | ) | |
At December 31, 2006, the Company had a capital loss carryover of $89,117, which is available to offset future capital gains through December 31, 2014.
At December 31, 2005, the Company had a deferred tax asset of approximately $1,454,000 which was adjusted through operations during the first quarter of 2006. Upon the determination that Hercules would qualify
F-25
HERCULES TECHNOLOGY GROWTH CAPITAL, INC.
NOTES TO CONSOLIDATED FINANCIAL STATEMENTS—(Continued)
as a regulated investment company, any remaining deferred tax asset was reversed. The Company elected to recognize all of its net built-in gains at the time of the conversion to a RIC and paid tax on the built-in gain with the filing of its 2005 tax return. In making this election, the portfolio was marked to market at the time of the RIC election and the Company paid approximately $294,000 in Federal and state tax on the resulting taxable gain. In addition, upon completion of the 2005 tax returns, the Company recorded an additional tax benefit of approximately $345,000.
For the years prior to January 1, 2006, the benefit from (provision for) taxes on earnings was as follows (in thousands):
| Years Ended December 31, | |||||||
| 2005 | 2004 | ||||||
| Federal: |
|||||||
| Current |
$ | 1,365.0 | $ | — | |||
| Deferred |
(1,266.0 | ) | — | ||||
| 99.0 | — | ||||||
| State: |
|||||||
| Current |
344.0 | — | |||||
| Deferred |
(188.0 | ) | — | ||||
| 156.0 | — | ||||||
| Foreign withholding tax |
— | — | |||||
| Total benefit from (provision for) income taxes |
$ | 255.0 | $ | — | |||
Deferred tax assets at December 31,2005 and 2004 are related to the following (in thousands):
| Years Ended December 31, | |||||||
| 2005 | 2004 | ||||||
| Net operating loss carryforwards |
$ | — | $ | 535.0 | |||
| Capitalized assets |
2.0 | 5.0 | |||||
| Expenses not currently deductible |
1,452.0 | 246.0 | |||||
| Gross deferred tax asset |
1,454.0 | 786.0 | |||||
| Valuation allowance |
— | (786.0 | ) | ||||
| Net deferred tax asset |
$ | 1,454.0 | $ | — | |||
For the years prior to January 1, 2006, a reconciliation of the statutory U.S. federal income tax rate to the Company’s effective rate is as follows:
| Years Ended December 31, | ||||||
| 2005 | 2004 | |||||
| Tax at federal statutory rate |
35.0 | % | 35.0 | % | ||
| State, net of federal benefit |
5.7 | 5.8 | ||||
| Other Items |
3.4 | — | ||||
| Change in valuation allowance |
(33.3 | ) | (40.8 | ) | ||
| Total |
10.8 | % | — | % | ||
As of December 31, 2005, the Company had no net operating loss carryforwards.
F-26
HERCULES TECHNOLOGY GROWTH CAPITAL, INC.
NOTES TO CONSOLIDATED FINANCIAL STATEMENTS—(Continued)
6. Shareholders’ Equity
The Company is authorized to issue 30,000,000 shares of common stock with a par value of $0.001. Each share of common stock entitles the holder to one vote.
In January 2005 the Company notified its shareholders of its intent to elect to be regulated as a BDC. In conjunction with the Company’s decision to elect to be regulated as a BDC, approximately 55% of the 5 Year Warrants were subject to mandatory cancellation under the terms of the Warrant Agreement with the warrant holder receiving one share of common stock for every two warrants cancelled and the exercise price of all warrants was adjusted to the then current net asset value of the common stock, subject to certain adjustments described in the Warrant Agreement. In addition, the 1 Year Warrants became subject to expiration immediately prior to the Company’s election to become a BDC, unless exercised. Concurrent with the announcement of the BDC election, the Company reduced the exercise price of all remaining 1 and 5 Year Warrants from $15.00 to $10.57. On February 22, 2005, the Company cancelled 47% of all outstanding 5 Year Warrants and issued 298,598 shares of common stock to holders of warrants upon exercise. In addition, the majority of shareholders owning 1 Year Warrants exercised them, and purchased 1,175,963 of common shares at $10.57 per share, for total consideration to the Company of $12,429,920. All unexercised 1 Year Warrants were then cancelled. The outstanding 5 Year Warrants will expire in June 2009.
A summary of activity in the 1 Year and 5 Year Warrants initially attached to units issued for each of the three periods ended December 31, 2006 is as follows:
| One-Year Warrants |
Five-Year Warrants |
|||||
| Warrants outstanding at February 2, 2004 |
— | — | ||||
| Warrants issued in June 2004 |
1,029,635 | 1,029,635 | ||||
| Warrants outstanding at December 31, 2004 |
1,029,635 | 1,029,635 | ||||
| Warrants issued in January 2005 |
134,067 | 134,067 | ||||
| Warrants cancelled in February 2005 |
(83,334 | ) | (547,030 | ) | ||
| Warrants exercised in 2005 |
(1,080,368 | ) | — | |||
| Warrants outstanding at December 31, 2005 and 2006 |
— | 616,672 | ||||
On March 7, 2006, the Company issued 432,900 shares of common stock for approximately $5.0 million in a private placement. The shares of common stock are subject to a registration rights agreement between the Company and the purchasers. The shares were registered pursuant to a registration statement that was declared effective on June 7, 2006.
During 2006, the Board of Directors elected to receive approximately $288,000 of their compensation in the form of common stock. The Company issued 23,334 shares to the directors based on the closing prices of the common stock on the specified election dates.
On April 21, 2006, the Company raised approximately $33.8 million, net of issuance costs, from a rights offering of 3,411,992 shares of its common stock. The shares were sold at $10.55 per share which was equivalent to 95% of the volume weighted average price of shares traded during the ten days immediately prior to the expiration date of the offering.
On October 20, 2006, the Company raised approximately $30.0 million, net of estimated issuance costs, in a public offering of 2.5 million shares of its common stock.
F-27
HERCULES TECHNOLOGY GROWTH CAPITAL, INC.
NOTES TO CONSOLIDATED FINANCIAL STATEMENTS—(Continued)
On December 12, 2006, the Company raised approximately $74.1 million, net of estimated issuance costs, in a public offering of 5.7 million shares of its common stock.
Common stock subject to future issuance is as follows:
| 2006 | 2005 | |||
| Stock options and warrants |
1,937,564 | 1,393,987 | ||
| Warrants issued in June 2004 |
616,672 | 616,672 | ||
| Common stock reserved |
2,554,236 | 2,010,659 | ||
7. Equity Incentive Plan
The Company and its stockholders have authorized and adopted an equity incentive plan (the “2004 Plan”) for purposes of attracting and retaining the services of its executive officers and key employees. Under the 2004 Plan, the Company is authorized to issue 7,000,000 shares of common stock. Unless terminated earlier by the Company’s Board of Directors, the 2004 Plan will terminate on June 9, 2014, and no additional awards may be made under the 2004 Plan after that date.
The Company and its stockholders have authorized and adopted the 2006 Non-Employee Director Plan (the “2006 Plan”) for purposes of attracting and retaining the services of its Board of Directors. Under the 2006 Plan, the Company is authorized to issue 1,000,000 shares of common stock. Unless terminated earlier by the Company’s Board of Directors, the 2006 Plan will terminate on May 29, 2016 and no additional awards may be made under the 2006 Plan after that date. The Company filed an exemptive relief request with the Securities and Exchange Commission (“SEC”) to allow options to be issued under the 2006 Plan which was approved on February 15, 2007. No shares were issued under the 2006 Plan as of December 31, 2006.
In 2004, each employee stock option to purchase two shares of common stock was accompanied by a warrant to purchase one share of common stock within one year and a warrant to purchase one share of common stock within five years. Both options and warrants had an exercise price of $15.00 per share on date of grant. On January 14, 2005, the Company notified all shareholders of its intent to elect to be regulated as a BDC and reduced the exercise price of all remaining 1 and 5 Year Warrants from $15.00 to $10.57 but did not reduce the strike price of the options (see Note 6). The unexercised one-year warrants expired and 55% of the five-year warrants were cancelled immediately prior to the Company’s election to become a BDC.
F-28
HERCULES TECHNOLOGY GROWTH CAPITAL, INC.
NOTES TO CONSOLIDATED FINANCIAL STATEMENTS—(Continued)
A summary of common stock options and warrant activity under the Company’s 2004 Plan for each of the three periods ended December 31, 2006 is as follows:
| Common Stock |
One-Year Warrants |
Five-Year Warrants |
|||||||||
| Outstanding at February 2, 2004 (commencement of operations) |
— | — | — | ||||||||
| Granted |
273,436 | 106,718 | 106,718 | ||||||||
| Exercised |
— | — | — | ||||||||
| Cancelled |
— | — | — | ||||||||
| Outstanding at December 31, 2004 |
273,436 | 106,718 | 106,718 | ||||||||
| Granted |
1,270,000 | — | — | ||||||||
| Exercised |
— | (95,595 | ) | — | |||||||
| Cancelled |
(206,000 | ) | (11,123 | ) | (50,167 | ) | |||||
| Outstanding at December 31, 2005 |
1,337,436 | — | 56,551 | ||||||||
| Granted |
663,500 | — | — | ||||||||
| Exercised |
— | — | — | ||||||||
| Cancelled |
(119,923 | ) | — | — | |||||||
| Outstanding at December 31, 2006 |
1,881,013 | — | 56,551 | ||||||||
| Weighted-average exercise price at December 31, 2006 |
$ | 12.86 | — | $ | 10.57 | ||||||
All of the options granted in 2004 are 100% vested on the date of grant, except for options granted to directors to acquire 30,000 shares which were cancelled in 2005 and options to acquire 16,000 shares granted to employees in December 2004. Options generally vest 33% one year after the date of grant and ratably over the succeeding 24 months. All options may be exercised for a period ending seven years after the date of grant. At December 31, 2006 options for approximately 676,000 shares were exercisable at a weighted average exercise price of approximately $13.46 per share with a weighted average exercise term of 4.5 years. The outstanding five year warrants have an expected life of five years.
The Company determined that the fair value of options and warrants granted during the years ended December 31, 2006 and 2005 was approximately $843,000 and $1.4 million, respectively. During the years ended December 31, 2006 and 2005, approximately $618,000 and $252,000 of share-based cost was expensed, respectively. As of December 31, 2006, there was $1.4 million of total unrecognized compensation costs related to stock options. These costs are expected to be recognized over a weighted average period of 2.0 years. The fair value of options granted in 2006 and 2005 was based upon a Black-Scholes option pricing model using the assumptions in the following table for each of the three periods ended December 31, 2006:
| 2006 | 2005 | 2004 | |||||||
| Expected Volatility |
24 | % | 25 | % | 0 | % | |||
| Expected Dividends |
8 | % | 8 | % | 0 | % | |||
| Expected term (in years) |
4.5 | 4.5 | 5 | ||||||
| Risk-free rate |
4.53-5.05 | % | 3.88-4.06 | % | 3.90 | % |
F-29
HERCULES TECHNOLOGY GROWTH CAPITAL, INC.
NOTES TO CONSOLIDATED FINANCIAL STATEMENTS—(Continued)
8. Earnings per Share
Shares used in the computation of the Company’s basic and diluted earnings per share are as follows:
| Year Ended December 31, |
Period from February 2, 2004 (commencement of 2004 |
|||||||||
| 2006 | 2005 | |||||||||
| Net increase (decrease) in net assets resulting from operations |
$ | 11,383,598 | $ | 2,104,565 | $ | (2,041,822 | ) | |||
| Weighted average common shares outstanding |
13,352,000 | 6,939,000 | 1,187,000 | |||||||
| Change net assets per common share—basic |
$ | 0.85 | $ | 0.30 | $ | (1.72 | ) | |||
| Net increase (decrease) in net assets resulting from operations |
$ | 11,383,598 | $ | 2,104,565 | $ | (2,041,822 | ) | |||
| Weighted average common shares outstanding |
13,352,000 | 6,939,000 | 1,187,000 | |||||||
| Dilutive effect of warrants and stock options |
175,000 | 77,000 | 106,000 | |||||||
| Weighted average common shares outstanding, assuming dilution |
13,527,000 | 7,016,000 | 1,293,000 | |||||||
| Change net assets per common share—assuming dilution |
$ | 0.84 | $ | 0.30 | $ | (1.58 | ) | |||
Weighted average common shares outstanding, assuming dilution, includes the incremental effect of shares that would be issued upon the assumed exercise of warrants. The Company has included approximately 1,286,000 outstanding warrants and stock options in the calculation of diluted net income per share that are exercisable at a price lower than HTGC, Inc.’s annual average trading price for the 2006 earnings per share presented. Common share equivalents excluded from this calculation could be dilutive in the future. Options for approximately 1,268,000, 1,337,000 and 273,000 shares of common stock have been excluded for the periods ended December, 2006, 2005 and 2004, respectively.
9. Related-Party Transactions
In January 2005, the CEO, the President, and four employees purchased 40,000, 13,500, and 8,567 units for $1,200,000, $405,000 and $257,010, respectively. On January 26, 2005, JMP Group, LLC also purchased 72,000 units for $2,008,800, which is net of an underwriting discount of $151,200 as compensation. Each unit consisted of two shares of our common stock, a 1 Year Warrant and a 5 Year Warrant.
On June 8, 2005, the Company entered into an Underwriting Agreement with JMP Securities LLC pursuant to which JMP Securities LLC served as the lead underwriter in the Company’s initial public offering completed on June 9, 2005. The Company paid JMP Securities LLC a fee of approximately $3.8 million in connection with their services as the lead underwriter.
In conjunction with the Company’s Rights offering completed on April 21, 2006, the Company agreed to pay JMP Securities LLC a fee of approximately $700,000 as co-manager of the offering.
In conjunction with the Company’s public offering completed on December 7, 2006, the Company agreed to pay JMP Securities LLC a fee of approximately $1.2 million as co-manager of the offering.
10. Commitments and Contingencies
In the normal course of business, the Company is party to financial instruments with off-balance sheet risk. These instruments consist primarily of unused commitments to extend credit, in the form of loans, to the
F-30
HERCULES TECHNOLOGY GROWTH CAPITAL, INC.
NOTES TO CONSOLIDATED FINANCIAL STATEMENTS—(Continued)
Company’s portfolio companies. The balance of unused commitments to extend credit at December 31, 2006 totaled approximately $55.5 million. Since this commitment may expire without being drawn upon, the total commitment amount does not necessarily represent future cash requirements.
Certain premises are leased under agreements which expire at various dates through December 2013. Total rent expense amounted to approximately $380,000, $221,000 and $102,000 during the years ended December 31, 2006, 2005 and 2004, respectively.
Future commitments under the credit facility and operating leases were as follows at December 31, 2006.
| Payments due by period (dollars in thousands) | |||||||||||||||
| Contractual Obligations(1) |
Total | Less than 1 year |
1-3 years | 3-5 years | After 5 years | ||||||||||
| Borrowings(2) |
$ | 41,000 | $ | 41,000 | $ | — | $ | — | $ | — | |||||
| Operating Lease Obligations |
3,268 | 482 | 1,374 | 986 | 426 | ||||||||||
| Total |
$ | 44,268 | $ | 41,482 | $ | 1,374 | $ | 986 | $ | 426 | |||||
| (1) | Excludes commitments to extend credit to our portfolio companies. |
| (2) | Borrowings under our Citigroup Credit Facility are listed based on the contractual maturity of the credit facility. Actual repayments could differ significantly due to prepayments by our existing portfolio companies, modifications of our current agreements with our existing portfolio companies and modification of the credit facility. See Note 4. |
11. Indemnification
The Company and its executives are covered by Directors and Officers Insurance, with the directors and officers being indemnified by the Company to the maximum extent permitted by Maryland law subject to the restrictions in the 1940 Act.
12. Concentrations of Credit Risk
The Company’s customers are primarily small and medium sized companies in the biopharmaceutical, communications and networking, consumer and business products, electronics and computers, medical device, semiconductor and software industry sectors. These sectors are characterized by high margins, high growth rates, consolidation and product and market extension opportunities. Value is often vested in intangible assets and intellectual property.
The largest portfolio companies vary from year to year as new loans are recorded and loans pay off. Loan revenue, consisting of interest, fees, and recognition of gains on equity interests, can fluctuate dramatically when a loan is paid off or a related equity interest is sold. Revenue recognition in any given year can be highly concentrated among several portfolio companies. For the years ended December 31, 2006 and 2005, the Company’s ten largest portfolio companies represented approximately 43.4% and approximately 58.7% of the total fair value of its investments. The Company had four investments that represent 5% or more of the fair value of its investments at December 31, 2006. At December 31, 2006 and 2005, the Company had eleven and seven equity investments, respectively, and each represents 5% or more of the total fair value of equity investments.
F-31
HERCULES TECHNOLOGY GROWTH CAPITAL, INC.
NOTES TO CONSOLIDATED FINANCIAL STATEMENTS—(Continued)
13. Financial Highlights
Following is a schedule of financial highlights for year ended December 31, 2006, 2005 and for the period from February 2, 2004 (commencement of operations) to December 31, 2004:
| Year Ended December 31, 2006 |
Year Ended December 31, 2005 |
Period from February 2, 2004 (commencement of December 31, |
||||||||||
| Per share data: |
||||||||||||
| Net asset value at beginning of period |
$ | 11.67 | $ | 12.18 | $ | 13.19 | (4) | |||||
| Net investment income (loss) |
0.78 | 0.18 | (0.99 | ) | ||||||||
| Net realized gain (loss) on investments |
(0.12 | ) | 0.07 | — | ||||||||
| Net unrealized appreciation on investments |
0.19 | 0.05 | — | |||||||||
| Total from investment operations |
0.85 | 0.30 | (0.99 | ) | ||||||||
| Net increase/(decrease) in net assets from capital share transactions |
0.28 | (0.82 | ) | (0.35 | )(5) | |||||||
| Distributions from ordinary income |
(1.06 | ) | (0.03 | ) | — | |||||||
| Return of capital distributions |
(0.14 | ) | — | — | ||||||||
| Stock-based compensation expense included in investment income(1) |
0.05 | 0.04 | 0.33 | |||||||||
| Net asset value at end of period |
$ | 11.65 | $ | 11.67 | $ | 12.18 | ||||||
| Ratios and supplemental data: |
||||||||||||
| Per share market value at end of period |
$ | 14.25 | 11.99 | $ | — | (6) | ||||||
| Total return |
28.86 | %(2) | -7.58 | %(3) | N/A | |||||||
| Shares outstanding at end of period |
21,927,034 | 9,801,965 | 2,059,270 | |||||||||
| Weighted average number of common shares outstanding |
13,352,000 | 6,939,000 | 1,187,327 | |||||||||
| Net assets at end of period |
$ | 255,412,822 | $ | 114,352,330 | $ | 25,078,133 | ||||||
| Ratio of operating expense to average net assets |
13.11 | % | 11.57 | % | 8.81 | %(7) | ||||||
| Ratio of net investment income (loss) before provision for income tax expense and investment gains and losses |
7.93 | % | 1.93 | % | 7.95 | %(7) | ||||||
| Average debt outstanding |
$ | 77,795,000 | $ | 20,284,932 | $ | — | ||||||
| Weighted average debt per common share |
$ | 5.83 | $ | 2.92 | $ | — | ||||||
| Portfolio turnover |
1.50 | % | 0.60 | % | 0.00 | % | ||||||
| (1) | Stock option expense is a non-cash expense that has no effect on net asset value. Pursuant to FAS 123R, net investment loss includes the expense associated with the granting of stock options which is offset by a corresponding increase in paid-in capital. |
| (2) | The total return for the period ended December 31, 2006 equals the change in the ending market value over the beginning of period price per share plus dividends paid per share during the period, divided by the beginning price. |
| (3) | The total return for the period ended December 31, 2005 is for a shareholder who owned common shares throughout the period, and received one additional common share for every two 5 Year Warrants cancelled. Shareholders who purchased common shares on January 26, 2005, exercised 1 Year Warrants, or purchased common shares in the initial public offering will have a different total return. The Company completed its initial public offering on June 11, 2005; prior to that date shares were issued in private placements. |
F-32
HERCULES TECHNOLOGY GROWTH CAPITAL, INC.
NOTES TO CONSOLIDATED FINANCIAL STATEMENTS—(Continued)
| (4) | On June 29, 2004, the Company completed its sale of common stock in a private placement at $15.00 per share ($13.19 per share net of offering costs). |
| (5) | Immediately after the sale of common stock in June 2004, 600 convertible preferred shares were converted into 125,000 units. |
| (6) | The Company completed the initial public offering of its common stock in June 2005, therefore, no market value data is presented as of December 31, 2004. |
| (7) | Not annualized. |
14. Selected Quarterly Data (Unaudited)
The following tables set forth certain quarterly financial information for each of the eight quarters ended December 31, 2006. This information was derived from our unaudited consolidated financial statements. Results for any quarter are not necessarily indicative of results for the full year or for any further quarter.
| Quarter Ended | ||||||||||||||
| 3/31/06 | 6/30/06 | 9/30/06 | 12/31/06 | |||||||||||
| Total investment income |
$ | 6,487,133 | $ | 6,787,911 | $ | 7,544,032 | $ | 8,689,380 | ||||||
| Net investment income (loss) before provision for income tax expense |
2,045,885 | 2,467,508 | 3,117,155 | 3,492,269 | ||||||||||
| Net investment income (loss) |
2,504,996 | 3,366,372 | 1,572,639 | 3,939,591 | ||||||||||
| Net investment income per common share (basic) |
$ | 0.25 | $ | 0.26 | $ | 0.12 | $ | 0.23 | ||||||
| Quarter Ended | ||||||||||||||
| 3/31/05 | 6/30/05 | 9/30/05 | 12/31/05 | |||||||||||
| Total investment income |
$ | 753,973 | $ | 1,912,824 | $ | 3,659,998 | $ | 4,339,848 | ||||||
| Net investment income (loss) before provision for income tax expense |
32,370 | (333,597 | ) | 884,834 | 941,171 | |||||||||
| Net investment income (loss) |
32,370 | 709,795 | 1,561,924 | (199,524 | ) | |||||||||
| Net investment income per common share (basic) |
$ | 0.01 | $ | 0.14 | $ | 0.16 | $ | (0.02 | ) | |||||
15. Subsequent Events
On January 3, 2007, in connection with the December 12, 2006 common stock issuance, the underwriters exercised their over-allotment option and purchased an additional 840,000 shares of our common stock for additional gross proceeds to the company of approximately $11 million.
On February 7, 2007, the Board of Directors announced a dividend of $0.30 per share to shareholders of record as of February 19, 2007 and payable on March 19, 2007.
During February 2007, Farallon Capital Management, L.L.C. and its related affiliates and Manuel Henriquez, the Company’s CEO, exercised warrants to purchase 132,480 and 75,075 shares of the Company’s common stock. The exercise price of the warrants was $10.57 per share resulting in net proceeds to the company of approximately $2.2 million.
F-33
HERCULES TECHNOLOGY GROWTH CAPITAL, INC.
CONSOLIDATED STATEMENTS OF ASSETS AND LIABILITIES
| March 31, 2007 |
December 31, 2006 |
|||||||
| Assets |
||||||||
| Investments, at value (cost of $338,325,156 and $279,946,465, respectively) |
$ | 342,483,418 | $ | 283,233,751 | ||||
| Deferred loan origination revenue |
(4,312,934 | ) | (3,450,971 | ) | ||||
| Cash and cash equivalents |
41,488,328 | 16,404,214 | ||||||
| Interest receivable |
3,976,516 | 2,906,831 | ||||||
| Other assets |
2,636,706 | 2,048,384 | ||||||
| Total assets |
386,272,034 | 301,142,209 | ||||||
| Liabilities |
||||||||
| Accounts payable |
1,115,721 | 540,376 | ||||||
| Accrued liabilities |
2,545,573 | 4,189,011 | ||||||
| Short-term loans payable |
113,000,000 | 41,000,000 | ||||||
| Total liabilities |
116,661,294 | 45,729,387 | ||||||
| Net assets |
$ | 269,610,740 | $ | 255,412,822 | ||||
| Net assets consist of: |
||||||||
| Par value |
$ | 23,091 | $ | 21,927 | ||||
| Capital in excess of par value |
271,996,278 | 257,234,729 | ||||||
| Unrealized appreciation on investments |
3,676,707 | 2,860,654 | ||||||
| Accumulated realized gains (losses) on investments |
(1,682,312 | ) | (1,972,014 | ) | ||||
| Distributions in excess of investment income |
(4,403,024 | ) | (2,732,474 | ) | ||||
| Total net assets |
$ | 269,610,740 | $ | 255,412,822 | ||||
| Shares of common stock outstanding ($0.001 par value, 60,000,000 authorized) |
23,090,751 | 21,927,034 | ||||||
| Net asset value per share |
$ | 11.68 | $ | 11.65 | ||||
See notes to consolidated financial statements (unaudited).
F-34
HERCULES TECHNOLOGY GROWTH CAPITAL, INC.
CONSOLIDATED SCHEDULE OF INVESTMENTS
March 31, 2007
(unaudited)
| Portfolio Company |
Industry |
Type of Investment(1)(6) |
Principal Amount |
Cost(2) | Value(3) | ||||||||
| Acceleron Pharmaceuticals, Inc. (1.57%)*(4) |
Drug Discovery | Senior Debt | |||||||||||
| Matures June 2009 Interest rate 10.25% |
$ | 3,868,591 | $ | 3,793,731 | $ | 3,793,731 | |||||||
| Preferred Stock Warrants | 69,106 | 413,349 | |||||||||||
| Preferred Stock Warrants | 34,996 | 32,709 | |||||||||||
| Acceleron Pharmaceuticals, Inc. (0.41%) |
Preferred Stock | 1,000,000 | 1,111,112 | ||||||||||
| Total Acceleron Pharmaceuticals, Inc. |
4,897,833 | 5,350,901 | |||||||||||
| Aveo Pharmaceuticals, Inc. (5.57%)(4) |
Drug Discovery | Senior Debt | |||||||||||
| Matures September 2009 Interest rate 10.75% |
$ | 15,000,000 | 14,863,247 | 14,863,247 | |||||||||
| Preferred Stock Warrants | 144,056 | 107,840 | |||||||||||
| Preferred Stock Warrants | 46,288 | 41,439 | |||||||||||
| Total Aveo Pharmaceuticals, Inc. |
15,053,591 | 15,012,526 | |||||||||||
| Elixir Pharmaceuticals, Inc. (3.71%)(4) |
Drug Discovery | Senior Debt | |||||||||||
| Matures June 2010 Interest rate Prime + 2.45% |
$ | 10,000,000 | 9,868,289 | 9,868,289 | |||||||||
| Preferred Stock Warrants | 149,510 | 139,244 | |||||||||||
| Total Elixir Pharmaceuticals, Inc. |
10,017,799 | 10,007,533 | |||||||||||
| EpiCept Corporation (3.75%)(4) |
Drug Discovery | Senior Debt | |||||||||||
| Matures August 2009 Interest rate 11.70% |
$ | 10,000,000 | 9,377,181 | 9,377,181 | |||||||||
| Common Stock Warrants | 794,633 | 740,783 | |||||||||||
| Total EpiCept Corporation |
10,171,814 | 10,117,964 | |||||||||||
| Memory Pharmaceuticals Corp. (2.13%) |
Drug Discovery | Senior Debt | |||||||||||
| Matures February 2011 Interest rate 11.45% |
$ | 6,000,000 | 4,966,633 | 4,966,633 | |||||||||
| Common Stock Warrants | 1,057,399 | 786,899 | |||||||||||
| Total Memory Pharmaceuticals Corp. |
6,024,032 | 5,753,532 | |||||||||||
| Merrimack Pharmaceuticals, Inc. (2.28%)(4) |
Drug Discovery | Convertible Senior Debt | |||||||||||
| Matures October 2008 Interest rate 11.15% |
$ | 5,514,385 | 5,449,928 | 5,736,928 | |||||||||
| Preferred Stock Warrants | 155,456 | 398,921 | |||||||||||
| Total Merrimack Pharmaceuticals, Inc. |
5,605,384 | 6,135,849 | |||||||||||
| Paratek Pharmaceuticals, Inc. (2.12%)(4) |
Drug Discovery | Senior Debt | |||||||||||
| Matures June 2008 Interest rate 11.10% |
$ | 5,675,635 | 5,622,203 | 5,622,203 | |||||||||
| Preferred Stock Warrants | 137,396 | 101,151 | |||||||||||
| Total Paratek Pharmaceuticals, Inc. |
5,759,599 | 5,723,354 | |||||||||||
| Portola Pharmaceuticals, Inc. (5.57%)(4) |
Drug Discovery | Senior Debt | |||||||||||
| Matures September 2010 Interest rate Prime + 1.75% |
$ | 15,000,000 | 14,865,809 | 14,865,809 | |||||||||
| Preferred Stock Warrants | 151,557 | 139,614 | |||||||||||
| Total Portola Pharmaceuticals, Inc. |
15,017,366 | 15,005,423 | |||||||||||
F-35
HERCULES TECHNOLOGY GROWTH CAPITAL, INC.
CONSOLIDATED SCHEDULE OF INVESTMENTS
March 31, 2007
(Continued)
| Portfolio Company |
Industry |
Type of Investment(1)(6) |
Principal Amount |
Cost(2) | Value(3) | ||||||||
| Sirtris Pharmaceuticals, Inc. (3.80%)(4) |
Drug Discovery | Senior Debt | |||||||||||
| Matures April 2011 Interest rate 10.60% |
$ | 10,000,000 | $ | 9,928,937 | $ | 9,928,937 | |||||||
| Preferred Stock Warrants | 88,829 | 316,536 | |||||||||||
| Sirtris Pharmaceuticals, Inc. (0.19%) |
Preferred Stock | 500,000 | 500,000 | ||||||||||
| Total Sirtris Pharmaceuticals, Inc. |
10,517,766 | 10,745,473 | |||||||||||
| Total Drug Discovery (31.10%) |
83,065,184 | 83,852,555 | |||||||||||
| IKANO Communications, Inc. (8.38%)(4) |
Communications & | Senior Debt | |||||||||||
| Networking | Matures March 2011 Interest rate 11.00% |
$ | 22,500,000 | 22,500,000 | 22,500,000 | ||||||||
| Preferred Stock Warrants | 45,460 | 30,260 | |||||||||||
| Preferred Stock Warrants | 72,344 | 50,900 | |||||||||||
| Total IKANO Communications, Inc. |
22,617,804 | 22,581,160 | |||||||||||
| Interwise, Inc. (0.72%)(4) |
Communications & | Senior Debt | |||||||||||
| Networking | Matures August 2008 Interest rate 17.50% |
$ | 1,894,705 | 1,701,456 | 1,701,456 | ||||||||
| Preferred Stock Warrants | 268,401 | 237,599 | |||||||||||
| Total Interwise, Inc. |
1,969,857 | 1,939,055 | |||||||||||
| Pathfire, Inc. (1.74%)(4) |
Communications & | Senior Debt | |||||||||||
| Networking | Matures December 2008 Interest rate Prime + 3.65% |
$ | 4,713,221 | 4,678,068 | 4,678,068 | ||||||||
| Preferred Stock Warrants | 63,276 | 13,390 | |||||||||||
| Total Pathfire, Inc. |
4,741,344 | 4,691,458 | |||||||||||
| Ping Identity Corporation (0.92%)(4) |
Communications & | Senior Debt | |||||||||||
| Networking | Matures June 2009 Interest rate 11.50% |
$ | 2,343,556 | 2,309,476 | 2,309,476 | ||||||||
| Preferred Stock Warrants | 51,801 | 157,848 | |||||||||||
| Total Ping Identity Corporation |
2,361,277 | 2,467,324 | |||||||||||
| Rivulet Communications, Inc. (1.30%)(4) |
Communications & | Senior Debt | |||||||||||
| Networking | Matures September 2009 Interest rate 10.60% |
$ | 3,500,000 | 3,463,969 | 3,463,969 | ||||||||
| Preferred Stock Warrants | 50,710 | 37,876 | |||||||||||
| Rivulet Communications, Inc. (0.09%) |
Preferred Stock | 250,000 | 250,000 | ||||||||||
| Total Rivulet Communications, Inc. |
3,764,679 | 3,751,845 | |||||||||||
| Simpler Networks Corp. (1.98%)(4) |
Communications & | Senior Debt | |||||||||||
| Networking | Matures July 2009 Interest rate 11.75% |
$ | 4,707,907 | 4,606,291 | 4,606,291 | ||||||||
| Preferred Stock Warrants | 160,241 | 733,919 | |||||||||||
| Simpler Networks Corp. (0.19%) |
Preferred Stock | 500,000 | 500,000 | ||||||||||
| Total Simpler Networks Corp. |
5,266,532 | 5,840,210 | |||||||||||
F-36
HERCULES TECHNOLOGY GROWTH CAPITAL, INC.
CONSOLIDATED SCHEDULE OF INVESTMENTS
March 31, 2007
(Continued)
| Portfolio Company |
Industry |
Type of Investment(1)(6) |
Principal Amount |
Cost(2) | Value(3) | ||||||||
| Wireless Channels, Inc. (4.63%) |
Communications & | Senior Debt | |||||||||||
| Networking | Matures April 2010 Interest rate 9.25% |
$ | 2,500,000 | $ | 2,348,971 | $ | 2,348,971 | ||||||
| Subordinated Debt | |||||||||||||
| Matures April 2010 Interest rate Prime + 4.25% |
$ | 10,000,000 | 10,000,000 | 10,000,000 | |||||||||
| Preferred Stock Warrants | 155,139 | 158,872 | |||||||||||
| Total Wireless Channels, Inc. |
12,504,110 | 12,507,843 | |||||||||||
| Total Communications & Networking (19.95%) |
53,225,603 | 53,778,895 | |||||||||||
| Atrenta, Inc. (1.82%)(4) |
Software | Senior Debt | |||||||||||
| Matures June 2009 Interest rate 11.50% |
$ | 4,707,075 | 4,643,687 | 4,643,687 | |||||||||
| Preferred Stock Warrants | 102,396 | 194,647 | |||||||||||
| Preferred Stock Warrants | 33,760 | 63,869 | |||||||||||
| Atrenta, Inc. (0.09%) |
Preferred Stock | 250,000 | 250,000 | ||||||||||
| Total Atrenta, Inc. |
5,029,843 | 5,152,203 | |||||||||||
| Blurb, Inc. (0.09%) |
Software | Senior Debt | |||||||||||
| Matures December 2009 Interest rate 9.55% |
$ | 250,000 | 238,530 | 238,530 | |||||||||
| Preferred Stock Warrants | 12,904 | 12,034 | |||||||||||
| Total Blurb, Inc. |
251,434 | 250,564 | |||||||||||
| Compete, Inc. (1.31%)(4) |
Software | Senior Debt | |||||||||||
| Matures March 2009 Interest rate Prime + 3.50% |
$ | 3,530,663 | 3,490,402 | 3,490,402 | |||||||||
| Preferred Stock Warrants | 62,067 | 46,064 | |||||||||||
| Total Compete, Inc. |
3,552,469 | 3,536,466 | |||||||||||
| Forescout Technologies, Inc. (1.11%)(4) |
Software | Senior Debt | |||||||||||
| Matures August 2009 Interest rate 11.15% |
$ | 2,500,000 | 2,455,217 | 2,455,217 | |||||||||
| Revolving Line of Credit | |||||||||||||
| Matures August 2007 Interest rate Prime + 1.49% |
$ | 500,000 | 500,000 | 500,000 | |||||||||
| Preferred Stock Warrants | 55,593 | 48,020 | |||||||||||
| Total Forescout Technologies, Inc. |
3,010,810 | 3,003,237 | |||||||||||
| GameLogic, Inc. (1.11%)(4) |
Software | Senior Debt | |||||||||||
| Matures December 2009 Interest rate Prime + 4.125% |
$ | 3,000,000 | 2,961,173 | 2,961,173 | |||||||||
| Preferred Stock Warrants | 52,604 | 39,291 | |||||||||||
| Total GameLogic, Inc. |
3,013,777 | 3,000,464 | |||||||||||
| Gomez, Inc. (0.35%)(4) |
Software | Senior Debt | |||||||||||
| Matures December 2007 Interest rate 12.25% |
$ | 946,303 | 938,525 | 938,525 | |||||||||
| Preferred Stock Warrants | 35,000 | 14,466 | |||||||||||
| Total Gomez, Inc. |
973,525 | 952,991 | |||||||||||
| HighRoads, Inc. (0.65%)(4) |
Software | Senior Debt | |||||||||||
| Matures February 2009 Interest rate 11.65% |
$ | 1,751,086 | 1,723,912 | 1,723,912 | |||||||||
| Preferred Stock Warrants | 44,466 | 33,159 | |||||||||||
| Total HighRoads, Inc. |
1,768,378 | 1,757,071 | |||||||||||
F-37
HERCULES TECHNOLOGY GROWTH CAPITAL, INC.
CONSOLIDATED SCHEDULE OF INVESTMENTS
March 31, 2007
(Continued)
| Portfolio Company |
Industry |
Type of Investment(1)(6) |
Principal Amount |
Cost(2) | Value(3) | ||||||||
| Intelliden, Inc. (1.11%) |
Software | Senior Debt | |||||||||||
| Matures February 2010 Interest rate 13.20% |
$ | 3,000,000 | $ | 2,985,453 | $ | 2,985,453 | |||||||
| Preferred Stock Warrants | 17,542 | 15,796 | |||||||||||
| Total Intelliden, Inc. |
3,002,995 | 3,001,249 | |||||||||||
| Inxight Software, Inc. (1.39%)(4) |
Software | Senior Debt | |||||||||||
| Matures February 2008 Interest rate 10.00% |
$ | 3,747,308 | 3,729,819 | 3,729,819 | |||||||||
| Preferred Stock Warrants | 55,963 | 24,430 | |||||||||||
| Total Inxight Software, Inc. |
3,785,782 | 3,754,249 | |||||||||||
| Oatsystems, Inc. (2.17%)(4) |
Software | Senior Debt | |||||||||||
| Matures September 2009 Interest rate 11.00% |
$ | 5,826,735 | 5,771,694 | 5,771,694 | |||||||||
| Preferred Stock Warrants | 67,484 | 50,437 | |||||||||||
| Total Oatsystems, Inc. |
5,839,178 | 5,822,131 | |||||||||||
| Proficiency, Inc. (1.51%)(5) |
Software | Senior Debt | |||||||||||
| Matures July 2008 Interest rate 12.00% |
$ | 4,000,000 | 3,960,318 | 3,960,318 | |||||||||
| Preferred Stock Warrants | 96,370 | 106,725 | |||||||||||
| Total Proficiency, Inc. |
4,056,688 | 4,067,043 | |||||||||||
| PSS Systems, Inc. (0.13%) |
Software | Senior Debt | |||||||||||
| Matures March 2010 Interest rate 10.74% |
$ | 350,000 | 300,217 | 300,217 | |||||||||
| Preferred Stock Warrants | 51,205 | 53,257 | |||||||||||
| Total PSS Systems, Inc. |
351,422 | 353,474 | |||||||||||
| Savvion, Inc. (1.84%)(4) |
Software | Senior Debt | |||||||||||
| Matures March 2009 Interest rate Prime + 3.45% |
$ | 1,899,414 | 1,899,414 | 1,899,414 | |||||||||
| Revolving Line of Credit | |||||||||||||
| Matures March 2007 Interest rate Prime + 2.00% |
$ | 3,000,000 | 3,000,000 | 3,000,000 | |||||||||
| Preferred Stock Warrants | 52,135 | 39,070 | |||||||||||
| Total Savvion, Inc. |
4,951,549 | 4,938,484 | |||||||||||
| Sportvision, Inc. (0.01%) |
Software | Preferred Stock Warrants | 39,339 | 26,992 | |||||||||
| Total Sportvision, Inc. |
39,339 | 26,992 | |||||||||||
| Talisma Corp. (0.55%)(4) |
Software | Subordinated Debt | |||||||||||
| Matures December 2007 Interest rate 11.25% |
$ | 1,461,961 | 1,451,072 | 1,451,072 | |||||||||
| Preferred Stock Warrants | 49,000 | 19,430 | |||||||||||
| Total Talisma Corp. |
1,500,072 | 1,470,502 | |||||||||||
| Total Software (15.24%) |
41,127,261 | 41,087,120 | |||||||||||
| Agami Systems, Inc. (2.60%)(4) |
Electronics & | Senior Debt | |||||||||||
| Computer Hardware | Matures August 2009 Interest rate 11.00% |
$ | 7,000,000 | 6,931,616 | 6,931,616 | ||||||||
| Preferred Stock Warrants | 85,601 | 74,782 | |||||||||||
| Total Agami Systems, Inc. |
7,017,217 | 7,006,398 | |||||||||||
F-38
HERCULES TECHNOLOGY GROWTH CAPITAL, INC.
CONSOLIDATED SCHEDULE OF INVESTMENTS
March 31, 2007
(Continued)
| Portfolio Company |
Industry |
Type of Investment(1)(6) |
Principal Amount |
Cost(2) | Value(3) | ||||||||
| Cornice, Inc. (0.99%)(4) |
Electronics & | Senior Debt | |||||||||||
| Computer Hardware | Matures November 2008 Interest rate Prime + 4.50% |
$ | 2,736,819 | $ | 2,680,376 | $ | 2,680,376 | ||||||
| Preferred Stock Warrants | 101,597 | — | |||||||||||
| Preferred Stock Warrants | 35,353 | — | |||||||||||
| Preferred Stock Warrants | 135,403 | — | |||||||||||
| Total Cornice, Inc. |
2,952,729 | 2,680,376 | |||||||||||
| Luminus Devices, Inc. (5.41%)(4) |
Electronics & | Senior Debt | |||||||||||
| Computer Hardware | Matures August 2009 Interest rate 12.50% |
$ | 14,558,264 | 14,346,470 | 14,346,470 | ||||||||
| Preferred Stock Warrants | 183,290 | 141,418 | |||||||||||
| Preferred Stock Warrants | 83,529 | 79,349 | |||||||||||
| Total Luminus Devices, Inc. |
14,613,289 | 14,567,237 | |||||||||||
| NeoScale Systems, Inc. (1.11%) |
Electronics & | Senior Debt | |||||||||||
| Computer Hardware | Matures October 2009 Interest rate 10.75% |
$ | 3,000,000 | 2,980,339 | 2,980,339 | ||||||||
| Preferred Stock Warrants | 23,593 | 21,329 | |||||||||||
| Total NeoScale Systems, Inc. |
3,003,932 | 3,001,668 | |||||||||||
| Sling Media, Inc. (0.53%) |
Electronics & | Preferred Stock Warrants | 38,968 | 933,910 | |||||||||
| Computer Hardware | Preferred Stock | 500,000 | 500,000 | ||||||||||
| Total Sling Media, Inc. |
538,968 | 1,433,910 | |||||||||||
| ViDeOnline Communications, Inc. (0.11%)(4) |
Electronics & Computer Hardware | Preferred Stock Warrants | — | 296,474 | |||||||||
| Total ViDeOnline Communications, Inc. |
— | 296,474 | |||||||||||
| Total Electronics & Computer Hardware (10.75%) |
28,126,135 | 28,986,063 | |||||||||||
| Quatrx Pharmaceuticals Company (6.55%)(4) |
Specialty | Senior Debt | |||||||||||
| Pharmaceuticals | Matures January 2010 Interest rate Prime + 3.00% |
$ | 17,635,698 | 17,484,205 | 17,484,205 | ||||||||
| Preferred Stock Warrants | 220,354 | 167,782 | |||||||||||
| Total Quatrx Pharmaceuticals Company |
17,704,559 | 17,651,987 | |||||||||||
| Aegerion Pharmaceuticals, Inc. (3.71%) |
Specialty | Senior Debt | |||||||||||
| Pharmaceuticals | Matures August 2010 Interest rate Prime + 2.50% |
$ | 10,000,000 | 9,931,806 | 9,931,806 | ||||||||
| Preferred Stock Warrants | 69,207 | 70,795 | |||||||||||
| Total Aegerion Pharmaceuticals, Inc. |
10,001,013 | 10,002,601 | |||||||||||
| Total Specialty Pharmaceuticals (10.26%) |
27,705,572 | 27,654,588 | |||||||||||
| BabyUniverse, Inc. (1.88%)(4) |
Consumer & Business | Senior Debt | |||||||||||
| Products | Matures July 2009 Interest rate Prime + 2.35% |
$ | 5,000,000 | 4,756,082 | 4,756,082 | ||||||||
| Common Stock Warrants | 325,224 | 308,431 | |||||||||||
| Total BabyUniverse, Inc. |
5,081,306 | 5,064,513 | |||||||||||
| Market Force Information, Inc. (0.66%)(4) |
Consumer & Business | Senior Debt | |||||||||||
| Products | Matures May 2009 Interest rate 10.45% |
$ | 1,660,375 | 1,644,701 | 1,644,701 | ||||||||
| Preferred Stock Warrants | 23,823 | 143,058 | |||||||||||
| Market Force Information, Inc. (0.19%) |
Preferred Stock | 500,000 | 500,000 | ||||||||||
| Total Market Force Information, Inc. |
2,168,524 | 2,287,759 | |||||||||||
F-39
HERCULES TECHNOLOGY GROWTH CAPITAL, INC.
CONSOLIDATED SCHEDULE OF INVESTMENTS
March 31, 2007
(Continued)
| Portfolio Company |
Industry |
Type of Investment(1)(6) |
Principal Amount |
Cost(2) | Value(3) | ||||||||
| Wageworks, Inc. (5.13%)(4) |
Consumer & Business Products | Senior Debt | |||||||||||
| Matures November 2008 Interest rate Prime + 4.00% |
$ | 12,811,228 | $ | 12,697,244 | $ | 12,697,244 | |||||||
| Preferred Stock Warrants | 251,964 | 1,123,874 | |||||||||||
| Wageworks, Inc. (0.09%) |
Preferred Stock | 249,995 | 249,995 | ||||||||||
| Total Wageworks, Inc. |
13,199,203 | 14,071,113 | |||||||||||
| Total Consumer & Business Products (7.95%) |
20,449,033 | 21,423,385 | |||||||||||
| Ageia Technologies, Inc. (2.44%)(4) |
Semiconductors | Senior Debt | |||||||||||
| Matures August 2008 Interest rate 10.25% |
$ | 6,519,688 | 6,475,603 | 6,475,603 | |||||||||
| Convertible Debt | 43,316 | 43,316 | |||||||||||
| Preferred Stock Warrants | 99,190 | 67,663 | |||||||||||
| Ageia Technologies, Inc. (0.19%) |
Preferred Stock | 500,000 | 500,000 | ||||||||||
| Total Ageia Technologies |
7,118,109 | 7,086,582 | |||||||||||
| Cradle Technologies (0.02%) |
Semiconductors | Preferred Stock Warrants | 79,150 | 59,303 | |||||||||
| Total Cradle Technologies |
79,150 | 59,303 | |||||||||||
| iWatt Inc. (1.50%)(4) |
Semiconductors | Senior Debt | |||||||||||
| Matures September 2009 Interest rate Prime + 2.75% |
$ | 2,000,000 | 1,963,453 | 1,963,453 | |||||||||
| Revolving Line of Credit | |||||||||||||
| Matures September 2007 Interest rate Prime + 1.75% |
$ | 2,035,000 | 2,035,000 | 2,035,000 | |||||||||
| Preferred Stock Warrants | 45,684 | 39,180 | |||||||||||
| Total iWatt Inc. |
4,044,137 | 4,037,633 | |||||||||||
| NEXX Systems, Inc. (2.60%)(4) |
Semiconductors | Senior Debt | |||||||||||
| Matures February 2010 Interest rate Prime + 2.75% |
$ | 5,000,000 | 4,925,409 | 4,925,409 | |||||||||
| Revolving Line of Credit | |||||||||||||
| Matures December 2009 Interest rate Prime + 1.75% |
$ | 2,000,000 | 2,000,000 | 2,000,000 | |||||||||
| Preferred Stock Warrants | 83,116 | 79,800 | |||||||||||
| Total NEXX Systems, Inc. |
7,008,525 | 7,005,209 | |||||||||||
| Total Semiconductors (6.75%) |
18,249,921 | 18,188,727 | |||||||||||
| Labopharm USA, Inc. (2.09%)(4)(5) |
Drug Delivery | Senior Debt | |||||||||||
| Matures July 2008 Interest rate 11.95% |
$ | 5,701,506 | 5,638,468 | 5,638,468 | |||||||||
| Total Labopharm USA, Inc. |
5,638,468 | 5,638,468 | |||||||||||
| TransOral Pharmaceuticals, Inc. (3.60%)(4) |
Drug Delivery | Senior Debt | |||||||||||
| Matures October 2009 Interest rate 10.69% |
$ | 9,470,464 | 9,399,755 | 9,399,755 | |||||||||
| Preferred Stock Warrants | 35,630 | 122,134 | |||||||||||
| Preferred Stock Warrants | 51,067 | 191,549 | |||||||||||
| TransOral Pharmaceuticals, Inc. (0.19%) |
Preferred Stock | 500,000 | 500,000 | ||||||||||
| Total TransOral Pharmaceuticals, Inc. |
9,986,452 | 10,213,438 | |||||||||||
| Total Drug Delivery (5.88%) |
15,624,920 | 15,851,906 | |||||||||||
F-40
HERCULES TECHNOLOGY GROWTH CAPITAL, INC.
CONSOLIDATED SCHEDULE OF INVESTMENTS
March 31, 2007
(Continued)
| Portfolio Company |
Industry |
Type of Investment(1)(6) |
Principal Amount |
Cost(2) | Value(3) | ||||||||
| BARRX Medical, Inc. (0.56%) |
Therapeutic | ||||||||||||
| Preferred Stock | $ | 1,500,000 | $ | 1,500,000 | |||||||||
| Total BARRX Medical, Inc. |
1,500,000 | 1,500,000 | |||||||||||
| Gynesonics, Inc. (0.76%)(4) |
Therapeutic | Senior Debt | |||||||||||
| Matures October 2009 Interest rate 9.50% |
$ | 2,000,000 | 1,987,462 | 1,987,462 | |||||||||
| Preferred Stock Warrants | 17,552 | 53,842 | |||||||||||
| Gynesonics, Inc. (0.09%) |
Preferred Stock | 250,000 | 250,000 | ||||||||||
| Total Gynesonics, Inc. |
2,255,014 | 2,291,304 | |||||||||||
| Novasys Medical, Inc. (2.96%)(4) |
Therapeutic | Senior Debt | |||||||||||
| Matures January 2010 Interest rate 9.70% |
$ | 8,000,000 | 8,000,000 | 8,000,000 | |||||||||
| Total Novasys Medical, Inc. |
8,000,000 | 8,000,000 | |||||||||||
| Power Medical Interventions, Inc. (0.01%) |
Therapeutic | ||||||||||||
| Common Stock Warrants | 20,687 | 28,786 | |||||||||||
| Total Power Medical Interventions, Inc. |
20,687 | 28,786 | |||||||||||
| Total Therapeutic (4.38%) |
11,775,701 | 11,820,090 | |||||||||||
| Hedgestreet, Inc. (1.41%)(4) |
Internet Consumer & | Senior Debt | |||||||||||
| Business Services | Matures March 2009 Interest rate 11.30% |
$ | 3,802,555 | 3,769,878 | 3,769,878 | ||||||||
| Preferred Stock Warrants | 54,956 | 41,866 | |||||||||||
| Total Hedgestreet, Inc. |
3,824,834 | 3,811,744 | |||||||||||
| Invoke Solutions, Inc. (0.82%)(4) |
Internet Consumer & | Senior Debt | |||||||||||
| Business Services | Matures December 2008 Interest rate 11.25% |
$ | 2,187,234 | 2,162,886 | 2,162,886 | ||||||||
| Preferred Stock Warrants | 43,826 | 33,322 | |||||||||||
| Total Invoke Solutions, Inc. |
2,206,712 | 2,196,208 | |||||||||||
| RazorGator Interactive Group, Inc. (1.11%)(4) |
Internet Consumer & | Senior Debt | |||||||||||
| Business Services | Matures January 2008 Interest rate 9.95% |
$ | 2,396,133 | 2,392,871 | 2,392,871 | ||||||||
| Preferred Stock Warrants | 13,050 | 561,742 | |||||||||||
| Preferred Stock Warrants | 28,478 | 26,161 | |||||||||||
| RazorGator Interactive Group, Inc. (0.63%) |
Preferred Stock | 1,000,000 | 1,708,178 | ||||||||||
| Total RazorGator Interactive Group, Inc. |
3,434,399 | 4,688,952 | |||||||||||
| Total Internet Consumer & Business Services (3.97%) |
9,465,945 | 10,696,904 | |||||||||||
| Lilliputian Systems, Inc. (3.15%)(4) |
Energy | Senior Debt | $ | 8,500,000 | |||||||||
| Matures March 2010 Interest rate 9.75% |
8,466,078 | 8,466,078 | |||||||||||
| Preferred Stock Warrants | 48,460 | 36,946 | |||||||||||
| Total Lilliputian Systems, Inc. |
8,514,538 | 8,503,024 | |||||||||||
| Total Energy (3.15%) |
8,514,538 | 8,503,024 | |||||||||||
F-41
HERCULES TECHNOLOGY GROWTH CAPITAL, INC.
CONSOLIDATED SCHEDULE OF INVESTMENTS
March 31, 2007
(Continued)
| Portfolio Company |
Industry |
Type of Investment(1)(6) |
Principal Amount |
Cost(2) | Value(3) | ||||||||
| Active Response Group, Inc. (2.41%) |
Information Services | Senior Debt | $ | 6,500,000 | |||||||||
| Matures March 2012 Interest rate Libor + 6.55% |
$ | 6,454,684 | $ | 6,454,684 | |||||||||
| Common Stock Warrants | 46,084 | 47,178 | |||||||||||
| Total Active Response Group, Inc. |
6,500,768 | 6,501,862 | |||||||||||
| Buzznet, Inc. (0.09%) |
Information Services | Senior Debt | |||||||||||
| Matures March 2010 Interest rate 10.25% |
$ | 250,000 | 241,626 | 241,626 | |||||||||
| Preferred Stock Warrants | 8,613 | 8,843 | |||||||||||
| Total Buzznet, Inc. |
250,239 | 250,469 | |||||||||||
| Solutionary, Inc. (0.04%) |
Information Services | Preferred Stock Warrants | 93,827 | 96,055 | |||||||||
| Total Solutionary, Inc. |
93,827 | 96,055 | |||||||||||
| Wallop Technologies, Inc. (0.09%) |
Information Services | Senior Debt | |||||||||||
| Matures March 2010 Interest rate 10.00% |
$ | 237,207 | 229,942 | 229,942 | |||||||||
| Preferred Stock Warrants | 7,473 | 7,650 | |||||||||||
| Total Wallop Technologies, Inc. |
237,415 | 237,592 | |||||||||||
| Total Information Services (2.63%) |
7,082,249 | 7,085,978 | |||||||||||
| Optiscan Biomedical, Corp. (0.31%)(4) |
Diagnostic | Senior Debt | |||||||||||
| Matures March 2008 Interest rate 15.00% |
$ | 815,291 | 784,135 | 784,135 | |||||||||
| Preferred Stock Warrants | 80,486 | 59,548 | |||||||||||
| Optiscan Biomedical, Corp. (0.37%) |
Preferred Stock | 1,000,000 | 1,000,000 | ||||||||||
| Total Optiscan Biomedical, Corp. |
1,864,621 | 1,843,683 | |||||||||||
| Xillix Technologies Corp. (1.41%)(4)(5) |
Diagnostic | Senior Debt | |||||||||||
| Matures December 2008 Interest rate 12.40% |
$ | 3,975,834 | 3,801,585 | 3,801,585 | |||||||||
| Common Stock Warrants | 313,108 | - | |||||||||||
| Total Xillix Technologies Corp. |
4,114,693 | 3,801,585 | |||||||||||
| Total Diagnostic (2.09%) |
5,979,314 | 5,645,268 | |||||||||||
| Guava Technologies, Inc. (1.80%)(4) |
Biotechnology Tools | Senior Debt | |||||||||||
| Matures July 2009 Interest rate Prime + 3.25% |
$ | 4,847,134 | 4,781,887 | 4,781,887 | |||||||||
| Preferred Stock Warrants | 105,399 | 78,193 | |||||||||||
| Total Guava Technologies, Inc. |
4,887,286 | 4,860,080 | |||||||||||
| NuGEN Technologies, Inc. (0.02%) |
Biotechnology Tools | Preferred Stock Warrants | 44,837 | 45,902 | |||||||||
| Total NuGEN Technologies, Inc. |
44,837 | 45,902 | |||||||||||
| Total Biotechnology Tools (1.82%) |
4,932,123 | 4,905,982 | |||||||||||
| Waterfront Media Inc. (1.11%) |
Media/Content/ Info | Senior Debt | |||||||||||
| Matures December 2010 Interest rate Prime + 3.00% |
$ | 1,000,000 | 941,994 | 941,994 | |||||||||
| Revolving Line of Credit | |||||||||||||
| Matures March 2008 Interest rate Prime + 1.25% |
$ | 2,000,000 | 2,000,000 | 2,000,000 | |||||||||
| Preferred Stock Warrants | 59,663 | 60,939 | |||||||||||
| Total Waterfront Media Inc. |
3,001,657 | 3,002,933 | |||||||||||
| Total Media/Content/Info (1.11%) |
3,001,657 | 3,002,933 | |||||||||||
| Total Investments (127.03%) |
$ | 338,325,156 | $ | 342,483,418 | |||||||||
F-42
| * | Value as a percent of net assets |
| (1) | Preferred and common stock, warrants, and equity interests are generally non-income producing. |
| (2) | Gross unrealized appreciation, gross unrealized depreciation, and net appreciation totaled $5,745,612, $1,587,350 and $4,158,262, respectively. |
| (3) | Except for warrants in four publicly traded companies, all investments are restricted at March 31, 2007 and were valued at fair value as determined in good faith by the Board of Directors. No unrestricted securities of the same issuer are outstanding. The Company uses the Standard Industrial Code for classifying the industry grouping of its portfolio companies. |
| (4) | Debt and warrant investments of this portfolio company have been pledged as collateral under the Citigroup Facility. Citigroup has an equity participation right on loans collateralized under the Citigroup Facility. The value of their participation right on unrealized gains in the related equity investments was approximately $432,000 at March 31, 2007 and is included in accrued liabilities and reduces the unrealized gain recognized by the Company at March 31, 2007. |
| (5) | Non-U.S. company or the company’s principal place of business is outside the United States. |
| (6) | All investments are less than 5% owned. |
See notes to consolidated financial statements (unaudited).
F-43
HERCULES TECHNOLOGY GROWTH CAPITAL, INC.
CONSOLIDATED SCHEDULE OF INVESTMENTS
December 31, 2006
| Portfolio Company |
Industry |
Type of Investment(1)(7) |
Principal Amount |
Cost(2) | Value(3) | ||||||||
| Acceleron Pharmaceuticals, Inc. (1.74%)*(4) |
Biopharmaceuticals |
Senior Debt |
$ | 4,069,607 | $ | 3,987,624 | $ | 3,987,624 | |||||
| Preferred Stock Warrants |
69,106 | 417,115 | |||||||||||
| Preferred Stock Warrants |
34,996 | 34,393 | |||||||||||
| Acceleron Pharmaceuticals, Inc. (0.44%) |
Preferred Stock |
1,000,000 | 1,111,112 | ||||||||||
| Total Acceleron Pharmaceuticals, Inc. |
5,091,726 | 5,550,244 | |||||||||||
| Aveo Pharmaceuticals, Inc. (5.88%)(4) |
Biopharmaceuticals |
Senior Debt |
$ | 15,000,000 | 14,849,099 | 14,849,099 | |||||||
| Preferred Stock Warrants |
144,056 | 115,212 | |||||||||||
| Preferred Stock Warrants |
46,288 | 43,771 | |||||||||||
| Total Aveo Pharmaceuticals, Inc. |
15,039,443 | 15,008,082 | |||||||||||
| Elixir Pharmaceuticals, Inc. (3.92%) |
Biopharmaceuticals |
Senior Debt |
$ | 10,000,000 | 9,857,610 | 9,857,610 | |||||||
| Preferred Stock Warrants |
74,755 | 73,334 | |||||||||||
| Preferred Stock Warrants |
74,755 | 73,334 | |||||||||||
| Total Elixir Pharmaceuticals, Inc. |
10,007,120 | 10,004,278 | |||||||||||
| EpiCept Corporation (3.84%) |
Biopharmaceuticals |
Senior Debt |
$ | 10,000,000 | 9,312,750 | 9,312,750 | |||||||
| Common Stock Warrants |
794,633 | 507,592 | |||||||||||
| Total EpiCept Corporation |
10,107,383 | 9,820,342 | |||||||||||
| Guava Technologies, Inc. (2.26%)(4) |
Biopharmaceuticals |
Senior Debt |
$ | 5,266,485 | 5,193,710 | 5,193,710 | |||||||
| Revolving Line of Credit |
$ | 500,000 | 500,000 | 500,000 | |||||||||
| Preferred Stock Warrants |
105,399 | 83,940 | |||||||||||
| Total Guava Technologies, Inc. |
5,799,109 | 5,777,650 | |||||||||||
| Labopharm USA, Inc. (2.58%)(4)(5) |
Biopharmaceuticals |
Senior Debt |
$ | 6,675,417 | 6,598,870 | 6,598,870 | |||||||
| Total Labopharm USA, Inc. |
6,598,870 | 6,598,870 | |||||||||||
| Merrimack Pharmaceuticals, Inc. (2.61%)(4) |
Biopharmaceuticals |
Convertible Senior Debt |
$ | 6,043,382 | 5,967,550 | 6,254,550 | |||||||
| Preferred Stock Warrants |
155,456 | 409,159 | |||||||||||
| Total Merrimack Pharmaceuticals, Inc. |
6,123,006 | 6,663,709 | |||||||||||
| Paratek Pharmaceuticals, Inc. (2.62%)(4) |
Biopharmaceuticals |
Senior Debt |
$ | 6,651,586 | 6,586,705 | 6,586,705 | |||||||
| Preferred Stock Warrants |
137,396 | 110,553 | |||||||||||
| Total Paratek Pharmaceuticals, Inc. |
6,724,101 | 6,697,258 | |||||||||||
F-44
HERCULES TECHNOLOGY GROWTH CAPITAL, INC.
CONSOLIDATED SCHEDULE OF INVESTMENTS
December 31, 2006
(Continued)
| Portfolio Company |
Industry |
Type of Investment(1)(7) |
Principal Amount |
Cost(2) | Value(3) | ||||||||
| Portola Pharmaceuticals, Inc. (4.41%) |
Biopharmaceuticals |
Senior Debt |
$ | 11,250,000 | $ | 11,145,804 | $ | 11,145,804 | |||||
| Preferred Stock Warrants |
113,668 | 107,489 | |||||||||||
| Total Portola Pharmaceuticals, Inc |
11,259,472 | 11,253,293 | |||||||||||
| Quatrx Pharmaceuticals Company (7.05%)(4) |
Biopharmaceuticals |
Senior Debt |
$ | 18,000,000 | 17,834,735 | 17,834,735 | |||||||
| Preferred Stock Warrants |
220,354 | 179,708 | |||||||||||
| Total Quatrx Pharmaceuticals Company |
18,055,089 | 18,014,443 | |||||||||||
| Sirtris Pharmaceuticals, Inc. (3.91%)(4) |
Biopharmaceuticals |
Senior Debt |
$ | 10,000,000 | 9,924,495 | 9,924,495 | |||||||
| Preferred Stock Warrants |
88,829 | 70,986 | |||||||||||
| Total Sirtris Pharmaceuticals, Inc. |
10,013,324 | 9,995,481 | |||||||||||
| TransOral Pharmaceuticals, Inc. (3.92%)(4) |
Biopharmaceuticals |
Senior Debt |
$ | 10,000,000 | 9,921,976 | 9,921,976 | |||||||
| Preferred Stock Warrants Preferred Stock Warrants |
|
35,630 51,067 |
|
28,265 50,548 | |||||||||
| Total TransOral Pharmaceuticals, Inc. |
10,008,673 | 10,000,789 | |||||||||||
| Total Biopharmaceuticals (45.18%) |
114,827,316 | 115,384,439 | |||||||||||
| Atrenta, Inc. (2.03%)(4) |
Software |
Senior Debt |
$ | 5,000,000 | 4,929,298 | 4,929,298 | |||||||
|
Atrenta, Inc. (0.10%) |
Preferred Stock Warrants Preferred Stock Warrants Preferred Stock |
|
102,396 33,760 250,000 |
|
200,285 65,719 250,000 | ||||||||
| Total Atrenta, Inc. |
5,315,454 | 5,445,302 | |||||||||||
| Blurb, Inc. (0.10%) |
Software |
Senior Debt |
$ | 250,000 | 237,454 | 237,454 | |||||||
| Preferred Stock Warrants |
12,904 | 12,653 | |||||||||||
| Total Blurb, Inc. |
250,358 | 250,107 | |||||||||||
| Compete, Inc. (1.52%)(4) |
Software |
Senior Debt |
$ | 3,884,338 | 3,839,045 | 3,839,045 | |||||||
| Preferred Stock Warrants |
62,067 | 49,247 | |||||||||||
| Total Compete, Inc. |
3,901,112 | 3,888,292 | |||||||||||
| Forescout Technologies, Inc. (0.78%) |
Software |
Senior Debt |
$ | 2,000,000 | 1,950,584 | 1,950,584 | |||||||
| Preferred Stock Warrants |
55,593 | 50,800 | |||||||||||
| Total Forescout Technologies, Inc. |
2,006,177 | 2,001,384 | |||||||||||
F-45
HERCULES TECHNOLOGY GROWTH CAPITAL, INC.
CONSOLIDATED SCHEDULE OF INVESTMENTS
December 31, 2006
(Continued)
| Portfolio Company |
Industry |
Type of Investment(1)(7) |
Principal Amount |
Cost(2) | Value(3) | ||||||||
| GameLogic, Inc. (1.17%)(4) |
Software |
Senior Debt |
$ | 3,000,000 | $ | 2,957,416 | $ | 2,957,416 | |||||
| Preferred Stock Warrants |
52,604 | 41,860 | |||||||||||
| Total GameLogic, Inc. |
3,010,020 | 2,999,276 | |||||||||||
| Gomez, Inc. (0.48%)(4) |
Software |
Senior Debt |
$ | 1,212,506 | 1,201,811 | 1,201,811 | |||||||
| Preferred Stock Warrants |
35,000 | 18,832 | |||||||||||
| Total Gomez, Inc. |
1,236,811 | 1,220,643 | |||||||||||
| HighRoads, Inc. (0.77%)(4) |
Software |
Senior Debt |
$ | 1,954,723 | 1,923,844 | 1,923,844 | |||||||
| Preferred Stock Warrants |
44,466 | 35,484 | |||||||||||
| Total HighRoads, Inc. |
1,968,310 | 1,959,328 | |||||||||||
| Intelliden, Inc. (1.17%) |
Software |
Senior Debt |
$ | 3,000,000 | 2,984,169 | 2,984,169 | |||||||
| Preferred Stock Warrants |
17,542 | 16,688 | |||||||||||
| Total Intelliden, Inc. |
3,001,711 | 3,000,857 | |||||||||||
| Inxight Software, Inc. (1.60%)(4) |
Software |
Senior Debt |
$ | 4,073,794 | 4,051,059 | 4,051,059 | |||||||
| Preferred Stock Warrants |
55,963 | 29,800 | |||||||||||
| Total Inxight Software, Inc. |
4,107,022 | 4,080,859 | |||||||||||
| Oatsystems, Inc. (2.36%)(4) |
Software |
Senior Debt |
$ | 6,000,000 | 5,973,007 | 5,973,007 | |||||||
| Preferred Stock Warrants |
33,742 | 26,881 | |||||||||||
| Total Oatsystems, Inc. |
6,006,749 | 5,999,888 | |||||||||||
| Proficiency, Inc. (1.43%)(5) |
Software |
Senior Debt |
$ | 4,000,000 | 3,951,815 | 3,548,185 | |||||||
| Preferred Stock Warrants |
96,370 | 115,977 | |||||||||||
| Total Proficiency, Inc. |
4,048,185 | 3,664,162 | |||||||||||
| Savvion, Inc. (1.58%)(4) |
Software |
Senior Debt |
$ | 1,000,000 | 1,000,000 | 1,000,000 | |||||||
| Revolving Line of Credit |
$ | 3,000,000 | 2,991,311 | 2,991,311 | |||||||||
| Preferred Stock Warrants |
52,135 | 41,743 | |||||||||||
| Total Savvion, Inc. |
4,043,446 | 4,033,054 | |||||||||||
| Sportvision, Inc. (0.01%) |
Software |
Preferred Stock Warrants |
39,339 | 29,667 | |||||||||
| Total Sportvision, Inc. |
39,339 | 29,667 | |||||||||||
F-46
HERCULES TECHNOLOGY GROWTH CAPITAL, INC.
CONSOLIDATED SCHEDULE OF INVESTMENTS
December 31, 2006
(Continued)
| Portfolio Company |
Industry |
Type of Investment(1)(7) |
Principal Amount |
Cost(2) | Value(3) | ||||||||
| Talisma Corp. (0.74%)(4) |
Software |
Subordinated Debt |
$ | 1,873,774 | $ | 1,858,802 | $ | 1,858,802 | |||||
| Preferred Stock Warrants |
49,000 | 25,259 | |||||||||||
| Total Talisma Corp. |
1,907,802 | 1,884,061 | |||||||||||
| Total Software (15.84%) |
40,842,496 | 40,456,880 | |||||||||||
| BabyUniverse, Inc. (1.90%)(4) |
Consumer & Business Products |
Senior Debt |
$ | 5,000,000 | 4,728,980 | 4,728,980 | |||||||
| Common Stock Warrants |
325,224 | 146,299 | |||||||||||
| Total BabyUniverse, Inc. |
5,054,204 | 4,875,279 | |||||||||||
| Market Force Information, Inc. (0.70%)(4) |
Consumer & Business Products |
Senior Debt |
$ | 1,777,064 | 1,759,510 | 1,759,510 | |||||||
| Preferred Stock Warrants |
23,823 | 19,197 | |||||||||||
| Total Market Force Information, Inc. |
1,783,333 | 1,778,707 | |||||||||||
| Wageworks, Inc. (5.89%)(4) |
Consumer & Business Products |
Senior Debt |
$ | 14,036,422 | 13,904,441 | 13,904,441 | |||||||
| Preferred Stock Warrants |
251,964 | 1,140,998 | |||||||||||
| Wageworks, Inc. (0.10%) |
Preferred Stock |
249,995 | 249,995 | ||||||||||
| Total Wageworks, Inc. |
14,406,400 | 15,295,434 | |||||||||||
| Total Consumer & Business Products (8.59%) |
21,243,937 | 21,949,420 | |||||||||||
| IKANO Communications, Inc. (0.03%) |
Communications |
Preferred Stock Warrants |
45,460 | 33,391 | |||||||||
| & Networking |
Preferred Stock Warrants |
72,344 | 55,530 | ||||||||||
| Total IKANO Communications, Inc. |
117,804 | 88,921 | |||||||||||
| Interwise, Inc. (0.83%)(4) |
Communications & Networking |
Senior Debt |
$ | 2,094,999 | 1,869,542 | 1,869,542 | |||||||
| Preferred Stock Warrants |
268,401 | 244,653 | |||||||||||
| Total Interwise, Inc. |
2,137,943 | 2,114,195 | |||||||||||
| Pathfire, Inc. (1.84%)(4) |
Communications & Networking |
Senior Debt |
$ | 4,713,221 | 4,672,795 | 4,672,795 | |||||||
| Preferred Stock Warrants |
63,276 | 16,918 | |||||||||||
| Total Pathfire, Inc. |
4,736,071 | 4,689,713 | |||||||||||
| Ping Identity Corporation (1.05%)(4) |
Communications & Networking |
Senior Debt |
$ | 2,569,123 | 2,530,953 | 2,530,953 | |||||||
| Preferred Stock Warrants |
51,801 | 160,500 | |||||||||||
| Total Ping Identity Corporation |
2,582,754 | 2,691,453 | |||||||||||
F-47
HERCULES TECHNOLOGY GROWTH CAPITAL, INC.
CONSOLIDATED SCHEDULE OF INVESTMENTS
December 31, 2006
(Continued)
| Portfolio Company |
Industry |
Type of Investment(1)(7) |
Principal Amount |
Cost(2) | Value(3) | ||||||||
| Rivulet Communications, Inc. (1.37%)(4) |
Communications & Networking |
Senior Debt |
$ | 3,500,000 | $ | 3,459,966 | $ | 3,459,966 | |||||
| Preferred Stock Warrants |
50,710 | 40,352 | |||||||||||
| Rivulet Communications, Inc. (0.10%) |
Preferred Stock |
250,000 | 250,000 | ||||||||||
| Total Rivulet Communications, Inc. |
3,760,676 | 3,750,318 | |||||||||||
| Simpler Networks Corp. (2.20%)(4) |
Communications & Networking |
Senior Debt |
$ | 5,000,000 | 4,886,659 | 4,886,659 | |||||||
| Preferred Stock Warrants |
160,241 | 742,688 | |||||||||||
| Simpler Networks Corp. (0.20%) |
Preferred Stock |
500,000 | 500,000 | ||||||||||
| Total Simpler Networks Corp. |
5,546,900 | 6,129,347 | |||||||||||
| Total Communications & Networking (7.62%) |
18,882,148 | 19,463,947 | |||||||||||
| Adiana, Inc. (0.53%)(4) |
Medical Devices & Equipment |
Senior Debt |
$ | 1,346,551 | 1,312,938 | 1,312,938 | |||||||
| Preferred Stock Warrants |
67,225 | 52,427 | |||||||||||
| Adiana, Inc. (0.20%) |
Preferred Stock |
500,000 | 500,000 | ||||||||||
| Total Adiana, Inc. |
1,880,163 | 1,865,365 | |||||||||||
| BARRX Medical, Inc. (0.59%) |
Medical Devices & Equipment |
Preferred Stock |
1,500,000 | 1,500,000 | |||||||||
| Total BARRX Medical, Inc. |
1,500,000 | 1,500,000 | |||||||||||
| Gynesonics, Inc. (0.80%) |
Medical Devices & Equipment |
Senior Debt |
$ | 2,000,000 | 1,986,209 | 1,986,209 | |||||||
| Preferred Stock Warrants |
17,552 | 54,735 | |||||||||||
| Total Gynesonics, Inc. |
2,003,761 | 2,040,944 | |||||||||||
| Novasys Medical, Inc. (3.13%)(4) |
Medical Devices & Equipment |
Senior Debt |
$ | 8,000,000 | 8,000,000 | 8,000,000 | |||||||
| Total Novasys Medical, Inc. |
8,000,000 | 8,000,000 | |||||||||||
| Optiscan Biomedical, Corp. (0.40%)(4) |
Medical Devices & Equipment |
Senior Debt |
$ | 1,006,259 | 967,314 | 967,314 | |||||||
| Preferred Stock Warrants |
80,486 | 64,478 | |||||||||||
| Optiscan Biomedical, Corp. (0.39%) |
Preferred Stock |
1,000,000 | 1,000,000 | ||||||||||
| Total Optiscan Biomedical, Corp. |
2,047,800 | 2,031,792 | |||||||||||
| Power Medical Interventions, Inc. (0.01%) |
Medical Devices & Equipment |
Common Stock Warrants |
20,687 | 30,200 | |||||||||
| Total Power Medical Interventions, Inc. |
20,687 | 30,200 | |||||||||||
F-48
HERCULES TECHNOLOGY GROWTH CAPITAL, INC.
CONSOLIDATED SCHEDULE OF INVESTMENTS
December 31, 2006
(Continued)
| Portfolio Company |
Industry |
Type of Investment(1)(7) |
Principal Amount |
Cost(2) | Value(3) | ||||||||
| Xillix Technologies Corp. (1.53%)(4)(5)(6) |
Medical Devices & Equipment | Senior Debt |
$ | 3,975,834 | $ | 3,775,493 | $ | 3,775,493 | |||||
| Common Stock Warrants |
313,108 | 122,206 | |||||||||||
| Total Xillix Technologies Corp. |
4,088,601 | 3,897,699 | |||||||||||
| Total Medical Devices & Equipment (7.58%) |
19,541,012 | 19,366,000 | |||||||||||
| Hedgestreet, Inc. (1.67%)(4) |
Internet Consumer & Business | Senior Debt |
$ | 4,263,806 | 4,226,674 | 4,226,674 | |||||||
| Services |
Preferred Stock Warrants |
54,956 | 44,836 | ||||||||||
| Total Hedgestreet, Inc. |
4,281,630 | 4,271,510 | |||||||||||
| Invoke Solutions, Inc. (0.97%)(4) |
Internet Consumer & Business | Senior Debt |
$ | 2,466,574 | 2,438,574 | 2,438,574 | |||||||
| Services |
Preferred Stock Warrants |
43,826 | 35,741 | ||||||||||
| Total Invoke Solutions, Inc. |
2,482,400 | 2,474,315 | |||||||||||
| RazorGator Interactive Group, Inc. (1.25%)(4) |
Internet Consumer & Business | Senior Debt |
$ | 2,637,626 | 2,633,276 | 2,633,276 | |||||||
| Services |
Preferred Stock Warrants |
13,050 | 570,026 | ||||||||||
| RazorGator Interactive Group, Inc. (0.67%) |
Preferred Stock |
1,000,000 | 1,708,178 | ||||||||||
| Total RazorGator Interactive Group, Inc. |
3,646,326 | 4,911,480 | |||||||||||
| Total Internet Consumer & Business Services (4.56%) |
10,410,356 | 11,657,305 | |||||||||||
| Agami Systems, Inc. (2.75%)(4) |
Electronics & Computer Hardware | Senior Debt |
$ | 7,000,000 | 6,924,288 | 6,924,288 | |||||||
| Preferred Stock Warrants |
85,601 | 79,040 | |||||||||||
| Total Agami Systems, Inc. |
7,009,889 | 7,003,328 | |||||||||||
| Cornice, Inc. (1.44%)(4) |
Electronics & Computer Hardware | Senior Debt |
$ | 3,524,664 | 3,459,755 | 3,459,755 | |||||||
| Preferred Stock Warrants |
101,597 | 80,181 | |||||||||||
| Preferred Stock Warrants |
35,353 | 27,571 | |||||||||||
| Preferred Stock Warrants |
135,403 | 106,862 | |||||||||||
| Total Cornice, Inc. |
3,732,108 | 3,674,369 | |||||||||||
F-49
HERCULES TECHNOLOGY GROWTH CAPITAL, INC.
CONSOLIDATED SCHEDULE OF INVESTMENTS
December 31, 2006
(Continued)
| Portfolio Company |
Industry |
Type of Investment(1)(7) |
Principal Amount |
Cost(2) | Value(3) | ||||||||
| Luminus Devices, Inc. (5.88%)(4) |
Electronics & Computer Hardware | Senior Debt |
$ | 15,000,000 | $ | 14,765,514 | $ | 14,765,514 | |||||
| Preferred Stock Warrants |
183,290 | 161,106 | |||||||||||
| Preferred Stock Warrants |
83,529 | 83,466 | |||||||||||
| Total Luminus Devices, Inc. |
15,032,333 | 15,010,086 | |||||||||||
| NeoScale Systems, Inc. (1.17%)(4) |
Electronics & Computer Hardware | Senior Debt |
$ | 3,000,000 | 2,978,373 | 2,978,373 | |||||||
| Preferred Stock Warrants |
23,593 | 22,525 | |||||||||||
| Total NeoScale Systems, Inc. |
3,001,966 | 3,000,898 | |||||||||||
| Sling Media, Inc. (0.56%) |
Electronics & Computer | Preferred Stock Warrants |
38,968 | 936,565 | |||||||||
| Hardware | Preferred Stock |
500,000 | 500,000 | ||||||||||
| Total Sling Media, Inc. |
538,968 | 1,436,565 | |||||||||||
| ViDeOnline Communications, Inc. (0.18%)(4) |
Electronics & Computer Hardware | Senior Debt |
$ | 461,158 | 461,158 | 461,158 | |||||||
| Preferred Stock Warrants |
— | — | |||||||||||
| Total ViDeOnline Communications, Inc. |
461,158 | 461,158 | |||||||||||
| Total Electronics & Computer Hardware (11.98%) |
29,776,422 | 30,586,404 | |||||||||||
| Ageia Technologies, Inc. (2.76%)(4) |
Semiconductors |
Senior Debt |
$ | 7,027,806 | 6,975,456 | 6,975,456 | |||||||
| Preferred Stock Warrants |
99,190 | 73,604 | |||||||||||
| Ageia Technologies, Inc. (0.20%) |
Preferred Stock |
500,000 | 500,000 | ||||||||||
| Total Ageia Technologies |
7,574,646 | 7,549,060 | |||||||||||
| Cradle Technologies (0.02%) |
Semiconductors |
Preferred Stock Warrants |
79,150 | 63,647 | |||||||||
| Total Cradle Technologies |
79,150 | 63,647 | |||||||||||
| iWatt Inc. (1.27%)(4) |
Semiconductors |
Senior Debt |
$ | 2,000,000 | 1,959,537 | 1,959,537 | |||||||
| Revolving Line of Credit |
$ | 1,250,000 | 1,250,000 | 1,250,000 | |||||||||
| Preferred Stock Warrants |
45,684 | 41,417 | |||||||||||
| Total iWatt Inc. |
3,255,221 | 3,250,954 | |||||||||||
F-50
HERCULES TECHNOLOGY GROWTH CAPITAL, INC.
CONSOLIDATED SCHEDULE OF INVESTMENTS
December 31, 2006
(Continued)
| Portfolio Company |
Industry |
Type of Investment(1)(7) |
Principal Amount |
Cost(2) | Value(3) | ||||||||
| NEXX Systems, Inc. (1.96%)(4) |
Semiconductors |
Senior Debt |
$ | 4,000,000 | 3,919,015 | 3,919,015 | |||||||
| Revolving Line of Credit |
$ | 1,000,000 | 1,000,000 | 1,000,000 | |||||||||
| Preferred Stock Warrants |
83,116 | 83,938 | |||||||||||
| Total NEXX Systems, Inc. |
5,002,131 | 5,002,953 | |||||||||||
| Total Semiconductors (6.21%) |
15,911,148 | 15,866,614 | |||||||||||
| Lilliputian Systems, Inc. (3.33%)(4) |
Energy |
Senior Debt |
$ | 8,500,000 | $ | 8,463,170 | $ | 8,463,170 | |||||
| Preferred Stock Warrants |
48,460 | 39,572 | |||||||||||
| Total Lilliputian Systems, Inc. |
8,511,630 | 8,502,742 | |||||||||||
| Total Energy (3.33%) |
8,511,630 | 8,502,742 | |||||||||||
| Total Investments (110.89%) |
$ | 279,946,465 | $ | 283,233,751 | |||||||||
| * | Value as a percent of net assets. |
| (1) | Preferred and common stock, warrants, and equity interests are generally non-income producing. |
| (2) | Gross unrealized appreciation, gross unrealized depreciation, and net appreciation totaled $4,919,518, $1,632,232 and $3,287,286, respectively. |
| (3) | Except for warrants in three publicly traded companies, all investments are restricted at December 31, 2006 and were valued at fair value as determined in good faith by the Board of Directors. No unrestricted securities of the same issuer are outstanding. The Company uses the Standard Industrial Code for classifying the industry grouping of its portfolio companies. |
| (4) | Debt and warrant investments of this portfolio company have been pledged as collateral under the Citigroup Facility. Citigroup has an equity participation right on loans collateralized under the Citigroup Facility. The value of their participation right on unrealized gains in the related equity investments was approximately $377,000 at December 31, 2006 and is included in accrued liabilities and reduces the unrealized gain recognized by the Company at December 31, 2006. |
| (5) | Non-U.S. company or the company’s principal place of business is outside the United States. |
| (6) | Debt is on non-accrual status at December 31, 2006, and is therefore considered non-income producing. |
| (7) | All investments are less than 5% owned. |
See notes to consolidated financial statements (unaudited).
F-51
HERCULES TECHNOLOGY GROWTH CAPITAL, INC.
CONSOLIDATED STATEMENTS OF OPERATIONS
(unaudited)
| Three Months Ended March 31, | |||||||
| 2007 | 2006 | ||||||
| Investment income: |
|||||||
| Interest |
$ | 9,035,989 | $ | 5,634,539 | |||
| Fees |
642,957 | 852,594 | |||||
| Total investment income |
9,678,946 | 6,487,133 | |||||
| Operating expenses: |
|||||||
| Interest |
685,965 | 1,676,982 | |||||
| Loan fees |
266,108 | 250,793 | |||||
| Compensation and benefits |
1,939,561 | 1,205,081 | |||||
| General and administrative |
1,308,235 | 1,185,392 | |||||
| Stock-based compensation |
253,750 | 123,000 | |||||
| Total operating expenses |
4,453,619 | 4,441,248 | |||||
| Net investment income before provision for income taxes and investment gains and losses |
5,225,327 | 2,045,885 | |||||
| Provision for income taxes |
— | 1,760,000 | |||||
| Net investment income |
5,225,327 | 285,885 | |||||
| Net realized gain (loss) on investments |
289,702 | (1,740,370 | ) | ||||
| Net increase in unrealized appreciation on investments |
816,053 | 3,959,481 | |||||
| Net realized and unrealized gain |
1,105,755 | 2,219,111 | |||||
| Net increase in net assets resulting from operations |
$ | 6,331,082 | $ | 2,504,996 | |||
| Net investment income before provision for income taxes and investment gains and losses per common share: |
|||||||
| Basic |
$ | 0.23 | $ | 0.21 | |||
| Diluted |
$ | 0.23 | $ | 0.21 | |||
| Change in net assets per common share: |
|||||||
| Basic |
$ | 0.28 | $ | 0.25 | |||
| Diluted |
$ | 0.27 | $ | 0.25 | |||
| Weighted average shares outstanding |
|||||||
| Basic |
22,871,000 | 9,912,595 | |||||
| Diluted |
23,120,000 | 9,958,861 | |||||
See notes to consolidated financial statements (unaudited).
F-52
HERCULES TECHNOLOGY GROWTH CAPITAL, INC.
CONSOLIDATED STATEMENTS OF CHANGES IN NET ASSETS
(unaudited)
| Capital in of par value |
Unrealized Appreciation Investments |
Accumulated Realized on |
Distributions in Excess of Investment |
Net Assets |
|||||||||||||||||||
| Common Stock | |||||||||||||||||||||||
| Shares | Par Value | ||||||||||||||||||||||
| Balance at December 31, 2005 |
9,801,965 | $ | 9,802 | $ | 114,524,833 | $ | — | $ | — | $ | (182,305 | ) | 114,352,330 | ||||||||||
| Net increase in net assets resulting from operations |
— | — | — | 674,089 | 1,545,022 | 285,885 | 2,504,996 | ||||||||||||||||
| Issuance of common stock |
432,900 | 433 | 4,999,567 | — | — | — | 5,000,000 | ||||||||||||||||
| Dividends declared |
— | — | — | — | — | (2,940,591 | ) | (2,940,591 | ) | ||||||||||||||
| Stock-based compensation |
— | — | 123,000 | — | — | — | 123,000 | ||||||||||||||||
| Balance at March 31, 2006 |
10,234,865 | $ | 10,235 | $ | 119,647,400 | $ | 674,089 | $ | 1,545,022 | $ | (2,837,011 | ) | $ | 119,039,735 | |||||||||
| Balance at December 31, 2006 |
21,927,034 | $ | 21,927 | $ | 257,234,729 | $ | 2,860,654 | $ | (1,972,014 | ) | $ | (2,732,474 | ) | $ | 255,412,822 | ||||||||
| — | |||||||||||||||||||||||
| Net increase net assets resulting from operations |
— | — | — | 816,053 | 289,702 | 5,225,327 | 6,331,082 | ||||||||||||||||
| Issuance of common stock |
11,667 | 12 | 166,243 | — | — | — | 166,255 | ||||||||||||||||
| Issuance of common stock in public offering overallotment exercise |
840,000 | 840 | 10,851,687 | 10,852,527 | |||||||||||||||||||
| Issuance of common stock from warrant exercises |
256,128 | 256 | 2,707,017 | 2,707,273 | |||||||||||||||||||
| Issuance of common stock under dividend reinvestment plan |
55,922 | 56 | 782,852 | — | — | — | 782,908 | ||||||||||||||||
| Dividends declared |
— | — | — | — | — | (6,895,877 | ) | (6,895,877 | ) | ||||||||||||||
| Stock-based compensation |
— | — | 253,750 | — | — | — | 253,750 | ||||||||||||||||
| Balance at March 31, 2007 |
23,090,751 | 23,091 | 271,996,278 | 3,676,707 | (1,682,312 | ) | (4,403,024 | ) | 269,610,740 | ||||||||||||||
See notes to consolidated financial statements (unaudited).
F-53
HERCULES TECHNOLOGY GROWTH CAPITAL, INC.
CONSOLIDATED STATEMENTS OF CASH FLOWS
(unaudited)
| Three Months Ended March 31, | ||||||||
| 2007 | 2006 | |||||||
| Cash flows from operating activities: |
||||||||
| Net increase in net assets resulting from operations |
$ | 6,331,082 | $ | 2,504,996 | ||||
| Adjustments to reconcile net increase in net assets resulting from operations to net cash used in operating activities: |
||||||||
| Purchase of investments |
(80,230,522 | ) | (33,000,000 | ) | ||||
| Principal payments received on investments |
21,897,727 | 33,921,115 | ||||||
| Proceeds from sale of investments |
873,002 | 1,691,638 | ||||||
| Net unrealized appreciation on investments |
(870,977 | ) | (4,118,896 | ) | ||||
| Net unrealized appreciation on investments due to lender |
54,924 | 159,415 | ||||||
| Net realized appreciation on investments |
(289,702 | ) | 1,740,370 | |||||
| Warrant values for loans not funded |
(138,664 | ) | — | |||||
| Accretion of loan discounts |
(474,455 | ) | (425,074 | ) | ||||
| Accretion of loan exit fees |
(283,482 | ) | (163,819 | ) | ||||
| Depreciation |
47,400 | 9,598 | ||||||
| Stock-based compensation |
253,750 | 123,000 | ||||||
| Common stock issued in lieu of Director compensation |
166,255 | — | ||||||
| Amortization of deferred loan origination revenue |
(661,699 | ) | (608,172 | ) | ||||
| Change in operating assets and liabilities: |
||||||||
| Interest receivable |
(786,203 | ) | (115,507 | ) | ||||
| Prepaid expenses and other current assets |
(751,012 | ) | 145,107 | |||||
| Income tax receivable |
29,294 | — | ||||||
| Deferred tax asset |
— | 1,273,000 | ||||||
| Accounts payable |
575,345 | 432,022 | ||||||
| Income tax payable |
— | (1,288,000 | ) | |||||
| Accrued liabilities |
(1,714,437 | ) | 1,000,926 | |||||
| Deferred loan origination revenue |
1,523,662 | 853,850 | ||||||
| Net cash provided by (used in) operating activities |
(54,448,712 | ) | 4,135,569 | |||||
| Cash flows from investing activities: |
||||||||
| Purchases of capital equipment |
(87,481 | ) | (2,944 | ) | ||||
| Other long-term assets |
173,476 | — | ||||||
| Net cash provided by (used in) investing activities |
85,995 | (2,944 | ) | |||||
| Cash flows from financing activities: |
||||||||
| Proceeds from issuance of common stock, net |
13,559,800 | 5,000,000 | ||||||
| Dividends paid |
(6,112,969 | ) | (2,940,591 | ) | ||||
| Borrowings of credit facilities |
87,000,000 | 10,000,000 | ||||||
| Repayments of credit facilities |
(15,000,000 | ) | — | |||||
| Net cash provided by financing activities |
79,446,831 | 12,059,409 | ||||||
| Net increase in cash |
25,084,114 | 16,192,034 | ||||||
| Cash and cash equivalents at beginning of period |
16,404,214 | 15,362,447 | ||||||
| Cash and cash equivalents at end of period |
$ | 41,488,328 | $ | 31,554,481 | ||||
| Supplemental Disclosure: |
||||||||
| Interest paid |
$ | 387,031 | $ | 1,410,121 | ||||
| Income taxes paid |
$ | — | $ | 1,775,000 | ||||
| Stock issued in lieu of cash dividends |
$ | 782,908 | $ | — | ||||
See notes to consolidated financial statements (unaudited).
F-54
HERCULES TECHNOLOGY GROWTH CAPITAL, INC.
NOTES TO CONSOLIDATED FINANCIAL STATEMENTS
(unaudited)
1. Description of Business and Unaudited Interim Consolidated Financial Statements Basis of Presentation
Hercules Technology Growth Capital, Inc. (the “Company”) is a specialty finance company that provides debt and equity growth capital to technology-related and life-science companies at all stages of development. The Company sources its investments through its principal office located in Silicon Valley, as well as through its additional offices in the Boston, Massachusetts, Boulder, Colorado, Chicago, Illinois and Columbus, Ohio areas. The Company was incorporated under the General Corporation Law of the State of Maryland in December 2003. The Company commenced operations on February 2, 2004 and commenced investment activities in September 2004.
The Company is an internally managed, non-diversified closed-end investment company that has elected to be regulated as a business development company (“BDC”) under the Investment Company Act of 1940, as amended (the “1940 Act”). From incorporation through December 31, 2005, the Company was taxed as a corporation under Subchapter C of the Internal Revenue Code of 1986, (the “Code”). Effective January 1, 2006, the Company has elected to be treated for tax purposes as a regulated investment company, or RIC, under the Code (see Note 5).
In January 2005, the Company formed Hercules Technology II, L.P. (“HT II”) and Hercules Technology SBIC Management, LLC (HTM). On September 27, 2006, HTII became licensed as a Small Business Investment Company (“SBIC”). HTII is able to borrow funds from the Small Business Administration (the “SBA”) against eligible investments and additional contributions to regulatory capital. HTM is a wholly-owned subsidiary of the Company. The Company is the sole limited partner of HTII and HTM is the general partner.
In July 2005, the Company formed Hercules Funding I LLC and Hercules Funding Trust I, an affiliated statutory trust, and executed a securitized credit facility with Citigroup Global Markets Realty Corp. (see Note 4).
In December 2006, The Company established Hydra Management LLC and Hydra Management Co. Inc., a general partner and investment management group, respectively, should it determine in the future to pursue a relationship with an externally managed fund.
The consolidated financial statements include the accounts of the Company and its subsidiaries. All inter-company accounts and transactions have been eliminated in consolidation. The accompanying consolidated interim financial statements are presented in conformity with U.S. generally accepted accounting principles (“U.S. GAAP”) for interim financial information, and pursuant to the requirements for reporting on Form 10-Q and Article 10 of Regulation S-X. Accordingly, certain disclosures accompanying annual consolidated financial statements prepared in accordance with U.S. GAAP are omitted. In the opinion of management, all adjustments, apart from the reclassification described in Note 2, consisting solely of normal recurring accruals considered necessary for the fair presentation of consolidated financial statements for the interim period, have been included. The current period’s results of operations are not necessarily indicative of results that ultimately may be achieved for the year. Therefore, the interim unaudited consolidated financial statements and notes should be read in conjunction with the audited consolidated financial statements and notes thereto for the period ended December 31, 2006. Financial statements prepared on a U.S. GAAP basis require management to make estimates and assumptions that affect the amounts and disclosures reported in the consolidated financial statements and accompanying notes. Such estimates and assumptions could change in the future as more information becomes known, which could impact the amounts reported and disclosed herein.
F-55
2. Reclassification
Certain prior period information has been reclassified to conform to current year presentation. When the Company exits an investment and realizes a gain or loss, the Company makes an accounting entry to reverse any unrealized appreciation or depreciation, respectively, that the Company previously recorded to reflect the appreciated or depreciated value of the investment. The Company recorded a reversal of $3.3 million from unrealized depreciation and recorded a realized loss of $3.3 million for the nine months ended September 30, 2006. During the fourth quarter of 2005, the Company recorded an unrealized depreciation of approximately $3.3 million in one portfolio company. As disclosed in Footnote 16 — Subsequent Events to the financial statements filed on Form 10-K for the year ended December 31, 2005, the assets of the portfolio company were sold in January 2006, and a realized loss was incurred. The difference between the unrealized depreciation as recorded in 2005 and the actual realized loss was not material. The Company did not reverse the loss from an unrealized depreciation to a realized loss in the first quarter of 2006, instead only recording the reversal in the third quarter of 2006. The accompanying comparative consolidated financial statements for the first quarter reflect the reversal with the previously recorded net unrealized appreciation of approximately $674,000 resulting in an unrealized appreciation of $3.3 million and the previously realized gain of $1.5 million resulting in a net realized loss of $1.7 million. This reversal does not affect the reported Net Investment Income, Net Income, Earnings per Share, Net Asset Value or Net Asset Value per Share for the first quarter of 2006.
3. Valuation of Investments
Value is defined in Section 2(a)(41) of the 1940 Act, as (i) the market price for those securities for which a market quotation is readily available and (ii) for all other securities and assets, fair value is as determined in good faith by the Board of Directors. Because the Company invests primarily in structured mezzanine debt investments (“debt”) and equity growth capital (“equity”) of privately-held technology-related and life-science companies backed by leading venture capital and private equity firms, the Company values substantially all of its investments at fair value, as determined in good faith by the Board of Directors in accordance with established valuation policies and consistently applied procedures and the recommendations of the Valuation Committee of the Board of Directors. At March 31, 2007, approximately 89% of the Company’s total assets represented investments in portfolio companies of which greater than 99% are valued at fair value by the Board of Directors.
Estimating fair value requires that judgment be applied to the specific facts and circumstances of each portfolio investment. Fair value is the amount for which an investment could be exchanged in an orderly disposition over a reasonable period of time between willing parties other than in a forced or liquidation sale. Due to the inherent uncertainty in the valuation of debt and equity investments that do not have a readily available market value, the fair value established in good faith by the Board of Directors may differ significantly from the values that would have been used had a ready market for the securities existed, and the differences could be material. In addition, changes in the market environment and other events that may occur over the life of the investments may cause the gains or losses ultimately realized on these investments to be different than the valuations currently assigned.
When originating a debt instrument, the Company expects to receive warrants or other equity-related securities from the borrower. The Company determines the cost basis of the warrants or other equity-related securities received based upon their respective fair values on the date of receipt in proportion to the total fair value of the debt and warrants or other equity-related securities received.
At each reporting date, privately held debt and equity securities are valued based on an analysis of various factors including, but not limited to, the portfolio company’s operating performance and financial condition and general market conditions that could impact the valuation. When an external event occurs, such as a purchase transaction, public offering, or subsequent equity sale, the pricing indicated by that external event is utilized to corroborate the Company’s valuation of the debt and equity securities. An unrealized loss is recorded when an investment has decreased in value, including: where collection of a loan is doubtful, there is an adverse change in
F-56
the underlying collateral or operational performance, there is a change in the borrower’s ability to pay, or there are other factors that lead to a determination of a lower valuation for the debt or equity security. Conversely, an unrealized appreciation is recorded when the investment has appreciated in value. Securities that are traded in the over the counter markets or on a stock exchange will be valued at the prevailing bid price at period end. The Board of Directors estimated the fair value of warrants and other equity-related securities in good faith using a Black-Scholes pricing model and consideration of the issuer’s earnings, sales to third parties of similar securities, the comparison to publicly traded securities, and other factors. Any resulting discount on the loan from recordation of the warrant or other equity instruments is accreted into interest income over the life of the loan.
As required by the 1940 Act, the Company classifies its investments by level of control. “Control Investments” are defined in the 1940 Act as investments in those companies that the Company is deemed to “Control”. Generally, under 1940 Act, the Company is deemed to “Control” a company in which it has invested if it owns 25% or more of the voting securities of such company or has greater than 50% representation on its board. “Affiliate Investments” are investments in those companies that are “Affiliated Companies” of the Company, as defined in the 1940 Act, which are not Control Investments. The Company is deemed to be an “Affiliate” of a company in which it has invested if it owns 5% or more but less than 25% of the voting securities of such company. “Non-Control/Non-Affiliate Investments” are those investments that are neither Control Investments nor Affiliate Investments. At March 31, 2007 and December 31, 2006, all of the Company’s investments were in Non-Control/Non-Affiliate companies.
Security transactions are recorded on the trade-date basis.
A summary of the composition of the Company’s investment portfolio as of March 31, 2007 and December 31, 2006 at fair value is shown as follows:
| March 31, 2007 | December 31, 2006 | |||||||||||
| ($ in millions) | Investments at Fair Value |
Percentage of Total Portfolio |
Investments at Fair Value |
Percentage of Total Portfolio |
||||||||
| Senior debt with warrants |
$ | 321.8 | 94.0 | % | $ | 273.2 | 96.5 | % | ||||
| Subordinated debt |
11.4 | 3.3 | % | 1.9 | 0.7 | % | ||||||
| Preferred stock |
9.3 | 2.7 | % | 8.1 | 2.8 | % | ||||||
| $ | 342.5 | 100.0 | % | $ | 283.2 | 100.0 | % | |||||
A Summary of the Company’s investment portfolio, at value, by geographic location is as follows:
| March 31, 2007 | December 31, 2006 | |||||||||||
| ($ in millions) | Investments at Fair Value |
Percentage of Total Portfolio |
Investments at Fair Value |
Percentage of Total Portfolio |
||||||||
| United States |
$ | 329.0 | 96.1 | % | $ | 269.0 | 95.0 | % | ||||
| Canada |
9.4 | 2.7 | % | 10.5 | 3.7 | % | ||||||
| Israel |
4.1 | 1.2 | % | 3.7 | 1.3 | % | ||||||
| $ | 342.5 | 100.0 | % | $ | 283.2 | 100.0 | % | |||||
F-57
The following table shows the fair value of our portfolio by industry sector at March 31, 2007 and December 31, 2006 (excluding unearned income):
| March 31, 2007 | December 31, 2006 | |||||||||||
| ($ in millions) | Investments at Fair Value |
Percentage of Total Portfolio |
Investments at Fair Value |
Percentage of Total Portfolio |
||||||||
| Drug discovery |
$ | 83.9 | 24.5 | % | $ | 75.0 | 26.5 | % | ||||
| Communications & networking |
53.8 | 15.7 | % | 19.5 | 6.9 | % | ||||||
| Software |
41.1 | 12.0 | % | 40.4 | 14.3 | % | ||||||
| Electronics & computer hardware |
29.0 | 8.5 | % | 30.6 | 10.8 | % | ||||||
| Specialty pharmaceuticals |
27.6 | 8.1 | % | 18.0 | 6.4 | % | ||||||
| Consumer & business products |
21.4 | 6.3 | % | 21.9 | 7.7 | % | ||||||
| Semiconductors |
18.2 | 5.3 | % | 15.9 | 5.6 | % | ||||||
| Drug delivery |
15.9 | 4.6 | % | 16.6 | 5.9 | % | ||||||
| Therapeutic |
11.8 | 3.4 | % | 13.4 | 4.7 | % | ||||||
| Internet consumer & business services |
10.7 | 3.1 | % | 11.7 | 4.1 | % | ||||||
| Energy |
8.5 | 2.5 | % | 8.5 | 3.0 | % | ||||||
| Information services |
7.1 | 2.1 | % | — | 0.0 | % | ||||||
| Diagnostic |
5.6 | 1.6 | % | 5.9 | 2.1 | % | ||||||
| Biotechnology tools |
4.9 | 1.4 | % | 5.8 | 2.0 | % | ||||||
| Media/content/info |
3.0 | 0.9 | % | — | 0.0 | % | ||||||
| $ | 342.5 | 100.0 | % | $ | 283.2 | 100.0 | % | |||||
During the three-month period ended March 31, 2007, the Company made investments in debt securities totaling $78.4 million and made investments in equity securities of approximately $1.8 million.
Loan origination and commitment fees received in full at the inception of a loan are deferred and amortized into fee income as an enhancement to the related loan’s yield over the contractual life of the loan. Loan exit fees to be paid at the termination of the loan are accreted into fee income over the contractual life of the loan. Original discount fees are reflected as adjustment to the loan yield. The Company had approximately $4.3 million and $3.5 million of unamortized fees at March 31, 2007 and December 31, 2006, respectively, and approximately $1.3 million and $1.0 million in exit fees receivable at March 31, 2007 and December 31, 2006, respectively.
4. Securitization Agreement
On August 1, 2005, the Company, through Hercules Funding Trust I, an affiliated statutory trust, executed a $100 million securitized credit facility (the “Citigroup Facility”) with Citigroup Global Markets Realty Corp. (“Citigroup”). Interest on borrowings under the Citigroup Facility are paid monthly and were charged at one-month LIBOR plus a spread of 1.65%. The Company paid a loan origination fee equal to 0.25% of the Citigroup Facility. On March 6, 2006, the Company amended the Citigroup facility with an agreement that increased the borrowing capacity under the facility to $125.0 million, increased the eligible loans and increased the eligible capacity for loans by geographic region and allowed for an interest rate of LIBOR plus 2.5% on amounts borrowed in excess of $100.0 million. The company paid a reconstructing fee of $150,000 that was expensed ratably through initial maturity on July 31, 2006. On December 6, 2006, the Company amended the Citigroup Facility with an agreement that increased the borrowing capacity under the facility to $150.0 million. On March 30, 2007, this increase was extended to the Facility expiration date, July 31, 2007, and the interest on all borrowings was reduced to LIBOR plus a spread of 1.20%. See Note 13 — Subsequent Events.
The Company’s ability to make draws on the Citigroup Facility was to expire on July 31, 2006, however, it was extended for an additional 364-day period with the lender’s consent on July 28, 2006. Prior to its July 31,
F-58
2007 expiration date, the Citigroup Facility may be extended for an additional 364-day period with the lenders’ consent. If the Citigroup Facility is not extended, any principal amounts then outstanding will be amortized over a six-month period through a termination date in January 2008. The Company paid an extension fee equal to 0.25% of the Citigroup Facility borrowing capacity which will be expensed ratably through maturity.
The Citigroup Facility is collateralized by loans from the Company’s portfolio companies, and includes an advance rate of approximately 55% of eligible loans. The Citigroup Facility contains covenants that, among other things, require the Company to maintain a minimum net worth and to restrict the loans securing the Citigroup Facility to certain dollar amounts, to concentrations in certain geographic regions and industries, to certain loan grade classifications, to certain security interests, and to certain interest payment terms. Citigroup has an equity participation right through a warrant participation agreement on the pool of loans and warrants collateralized under the Citigroup facility. Pursuant to the warrant participation agreement, the Company granted to Citigroup a 10% participation in all warrants held as collateral. As a result, Citigroup is entitled to 10% of the realized gains on the warrants until the realized gains paid to Citigroup pursuant to the agreement equals $3,750,000 (the “Maximum Participation Limit”). The Obligations under the warrant participation agreement continue even after the Citigroup facility is terminated until the Maximum Participation Limit has been reached. During the three months ended March 31, 2007, the Company reduced its realized gain by approximately $16,000 for Citigroup’s participation in the gain on sale of an equity security and recorded an additional liability and reduced its unrealized gains by approximately $55,000 for Citigroup’s participation in unrealized gains in the warrant portfolio. The value of their participation right on unrealized gains in the related equity investments since inception of the agreement was approximately $432,000 at March 31, 2007 and is included in accrued liabilities and reduces the unrealized gain recognized by the Company at March 31, 2007. Since inception of the agreement, the Company has paid Citigroup approximately $292,000 under the warrant participation agreement thereby reducing its realized gains.
At March 31, 2007, the Company, through its special purpose entity (SPE), had transferred pools of loans and warrants with a fair value of approximately $244.3 million to Hercules Funding Trust I and had drawn $113.0 million under the Citigroup Facility. Transfers of loans have not met the requirements of Statement of Financial Accounting Standards (“SFAS”) No. 140, Accounting for Transfers and Servicing of Financial Assets and Extinguishments of Liabilities, for sales treatment and are, therefore, treated as secured borrowings, with the transferred loans remaining in investment and the related liability recorded in borrowings. The average debt outstanding under the Citigroup Facility for the quarter ended March 31, 2007 and the year ended 2006 was approximately $38.2 and $70.6 million, respectively, and the average interest rates were approximately 6.96% and 6.74% respectively.
At March 31, 2007 and December 31, 2006, the Company had the following debt:
| March 31, 2007 | December 31, 2006 | |||||||||||
| ($ in thousands) | Facility Amount |
Amount Outstanding |
Facility Amount |
Amount Outstanding | ||||||||
| Citigroup Facility |
$ | 150,000 | $ | 113,000 | $ | 150,000 | $ | 41,000 | ||||
| Total |
$ | 150,000 | $ | 113,000 | $ | 150,000 | $ | 41,000 | ||||
5. Income taxes
The Company intends to continue to operate so as to qualify to be taxed as a RIC under the Code and, as such, the Company would not be subject to federal income tax on the portion of its taxable income and gains distributed to stockholders. To qualify as a RIC, the Company is required, among other requirements, to distribute at least 90% of its annual investment company taxable income, as defined by the Code. The amount to be paid out as a dividend is determined by the Board of Directors each quarter and is based upon the annual earnings estimated by the management of the Company. To the extent that the Company’s earnings fall below the amount of dividends declared, however, a portion of the total amount of the Company’s dividends for the fiscal
F-59
year may be deemed a return of capital for tax purposes to the Company’s stockholders. On March 19, 2007, the Company paid a dividend of $0.30 per share.
For the fiscal year ended December 31, 2006 a portion of the distributions to the Company’s shareholders was deemed a return of capital. For the quarter ended March 31, 2007, the Company declared a distribution of $0.30 per share. The determination of the tax attributes of the Company’s distributions is made annually as of the end of the Company’s fiscal year based upon its taxable income for the full year and distributions paid for the full year, therefore a determination made on a quarterly basis may not be representative of the actual tax attributes of its distributions for a full year. If the Company determined the tax attributes of its distributions year-to-date as of March 31, 2007, 80.1% would be from ordinary income and 19.9% would be a return of capital for stockholders, however there can be no certainty to shareholders that this determination is representative of what the tax attributes of its 2007 distributions to shareholders will actually be.
As of March 31, 2006, as a C corporation, the Company accrued income tax expense on a quarterly basis. Income tax expense recorded during the first quarter of 2006 was approximately $1.8 million.
In June 2006, the Financial Accounting Standards Board (“FASB”) issued FASB Interpretation No. 48 (“FIN 48”), “Accounting for Uncertainty in Income Taxes—an interpretation of FASB Statement No. 109”, which clarifies the accounting for uncertainty in income taxes recognized in an enterprise’s financial statements in accordance with FASB Statement No. 109, Accounting for Income Taxes. FIN 48 prescribes a recognition threshold and measurement attribute for the financial statement recognition and measurement of a tax position taken or expected to be taken in a tax return. FIN 48 also provides guidance on derecognition, classification, interest and penalties, accounting in interim periods, disclosure, and transition. As required, we have adopted FIN 48 as of January 1, 2007. We conducted a review of all open tax year’s income recognition and expense deduction filing positions and income tax returns filed (federal and state) for determination of any uncertain tax positions that may require recognition of a tax liability. This review encompassed an analysis of all book/tax difference adjustments as well as the timing of income and expense recognition for all tax years still open under the statute of limitations. As a result, we determined that it is more likely than not that each tax position taken on a previously filed return or to be taken on current tax returns will be sustained on examination based on the technical merits of the positions and therefore, no recognition of a tax liability on an uncertain tax position for FIN 48 purposes is anticipated.
6. Stockholders’ Equity
The Company is authorized to issue 60,000,000 shares of common stock with a par value of $0.001. Each share of common stock entitles the holder to one vote.
In January 2005 the Company notified its shareholders of its intent to elect to be regulated as a BDC. In conjunction with the Company’s decision to elect to be regulated as a BDC, approximately 55% of the 5 Year Warrants were subject to mandatory cancellation under the terms of the Warrant Agreement with the warrant holder receiving one share of common stock for every two warrants cancelled and the exercise price of all warrants was adjusted to the then current net asset value of the common stock, subject to certain adjustments described in the Warrant Agreement. In addition, the 1 Year Warrants became subject to expiration immediately prior to the Company’s election to become a BDC, unless exercised. Concurrent with the announcement of the BDC election, the Company reduced the exercise price of all remaining 1 and 5 Year Warrants from $15.00 to $10.57. On February 22, 2005, the Company cancelled 47% of all outstanding 5 Year Warrants and issued 298,598 shares of common stock to holders of warrants upon exercise. In addition, the majority of shareholders owning 1 Year Warrants exercised them, and purchased 1,175,963 of common shares at $10.57 per share, for total consideration to the Company of $12,429,920. All unexercised 1 Year Warrants were then cancelled. The outstanding 5 Year Warrants will expire in June 2009.
F-60
A summary of activity in the 5 Year Warrants initially attached to units issued for the three months ended March 31, 2007 is as follows:
| Five-Year Warrants |
|||
| Warrants outstanding at December 31, 2006 |
616,672 | ||
| Warrants issued |
— | ||
| Warrants cancelled |
— | ||
| Warrants exercised |
(223,008 | ) | |
| Warrants outstanding at March 31, 2007 |
393,664 | ||
The Company received net proceeds of approximately $2.7 million from the exercise of the 5-Year Warrants in the period ended March 31, 2007.
On March 7, 2006, the Company issued 432,900 shares of common stock for approximately $5.0 million in private placement. The shares of common stock are subject to a registration rights agreement between the Company and the purchasers. The shares were registered pursuant to a registration statement that was declared effective on June 7, 2006.
On April 21, 2006, the Company raised approximately $33.8 million, net of issuance costs, from a rights offering of 3,411,992 shares of its common stock. The shares were sold at $10.55 per share which was equivalent to 95% of the volume weighted average prices of shares traded during the ten days immediately prior to the expiration date of the offering.
On October 20, 2006, the Company raised approximately $30.0 million, net of estimated issuance costs, in a public offering of 2.5 million shares of its common stock.
On December 12, 2006, the Company raised approximately $74.1 million, net of estimated issuance costs, in a public offering of 5.7 million shares of its common stock.
On January 3, 2007, in connection with the December 12, 2006 common stock issuance, the underwriters exercised their over-allotment option and purchased an additional 840,000 shares of common stock for additional net proceeds of approximately $10.9 million.
7. Earnings per Share
Shares used in the computation of the Company’s basic and diluted earnings (loss) per share are as follows:
| Three months ended March 31, | ||||||
| 2007 | 2006 | |||||
| Net increase (decrease) in net assets resulting from operations |
$ | 6,331,082 | $ | 2,504,996 | ||
| Weighted average common shares outstanding |
22,871,000 | 9,912,595 | ||||
| Change net assets per common share - basic |
$ | 0.28 | $ | 0.25 | ||
| Net increase (decrease) in net assets resulting from operations |
$ | 6,331,082 | $ | 2,504,996 | ||
| Weighted average common shares outstanding |
22,871,000 | 9,912,595 | ||||
| Dilutive effect of warrants and stock options |
249,000 | 46,266 | ||||
| Weighted average common shares outstanding, assuming dilution |
23,120,000 | 9,958,861 | ||||
| Change net assets per common share - assuming dilution |
$ | 0.27 | $ | 0.25 | ||
Weighted average common shares outstanding, assuming dilution, includes the incremental effect of shares that would be issued upon the assumed exercise of options and warrants. The Company has included approximately 2,173,000 and 673,223 outstanding warrants and stock options in the calculation of diluted net income per share that are exercisable at a price lower than the Company’s quarterly average trading price for the earnings per share
F-61
presented for the three months ended March 31, 2007 and 2006, respectively. Common share equivalents excluded from this calculation could be dilutive in the future. Options for approximately 988,000 and 1,341,000 shares of common stock have been excluded for the three months ended March 31, 2007 and 2006, respectively.
8. Related-Party Transactions
In conjunction with the Company’s rights offering completed on April 21, 2006, the Company agreed to pay JMP Securities LLC a fee of approximately $700,000 as co-manager of the offering.
In conjunction with the Company’s public offering completed on December 7, 2006, the Company agreed to pay JMP Securities LLC a fee of approximately $1.2 million as co-manager of the offering.
During February 2007, Farallon Capital Management, L.L.C and its related affiliates and Manuel Henriquez, the Company’s CEO, exercised warrants to purchase 132,480 and 75,075 shares of the Company’s common stock, respectively. The exercise price of the warrants was $10.57 per share resulting in net proceeds to the company of approximately $2.2 million.
9. Equity Incentive Plan
The Company and its stockholders have authorized and adopted an equity incentive plan (the “2004 Plan”) for purposes of attracting and retaining the services of its executive officers and key employees. Under the 2004 Plan, the Company is authorized to issue 7,000,000 shares of common stock. Unless terminated earlier by the Company’s Board of Directors, the 2004 Plan will terminate on June 9, 2014, and no additional awards may be made under the 2004 Plan after that date.
The Company and its stockholders have authorized and adopted the 2006 Non-Employee Director Plan (the “2006 Plan”) for purposes of attracting and retaining the services of its Board of Directors. Under the 2006 Plan, the Company is authorized to issue 1,000,000 shares of common stock. Unless terminated earlier by the Company’s Board of Directors, the 2006 Plan will terminate on May 29, 2016 and no additional awards may be made under the 2006 Plan after that date. The Company filed an exemptive relief request with the Securities and Exchange Commission (“SEC”) to allow options to be issued under the 2006 Plan which was approved on February 15, 2007. No shares were issued under the 2006 Plan as of March 31, 2007.
In 2004, each employee stock option to purchase two shares of common stock was accompanied by a warrant to purchase one share of common stock within one year and a warrant to purchase one share of common stock within five years. Both options and warrants had an exercise price of $15.00 per share on date of grant. On January 14, 2005, the Company notified all shareholders of its intent to elect to be regulated as a BDC and reduced the exercise price of all remaining 1 and 5 Year Warrants from $15.00 to $10.57 but did not reduce the strike price of the options (see Note 7). The unexercised one-year warrants expired and 55% of the five-year warrants were cancelled immediately prior to the Company’s election to become a BDC.
A summary of common stock options and warrant activity under the Company’s 2004 Plan for the three months ended March 31 is as follows:
| Common Stock Options |
Five- Year |
||||||
| Outstanding at December 31, 2006 |
1,881,013 | 56,551 | |||||
| Granted |
863,000 | — | |||||
| Exercised |
— | (33,120 | ) | ||||
| Cancelled |
— | — | |||||
| Outstanding at March 31, 2007 |
2,744,013 | 23,431 | |||||
| Weighted-average exercise price at March 31, 2007 |
$ | 13.23 | $ | 10.57 | |||
F-62
All of the options granted in 2004 are 100% vested on the date of grant, except for options granted to directors to acquire 30,000 shares which were cancelled in 2005 and options to acquire 16,000 shares granted to employees in December 2004. Options generally vest 33% one year after the date of grant and ratably over the succeeding 24 months. All options may be exercised for a period ending seven years after the date of grant. At March 31, 2007 options for approximately 841,000 shares were exercisable at a weighted average exercise price of approximately $13.50 per share with a weighted average exercise term of 4.5 years. The outstanding five year warrants have an expected life of five years.
The Company determined that the fair value of options granted during the three month periods ended March 31, 2007 and 2006 was approximately $1.3 million and approximately $4,000, respectively. During the three month periods ended March 31, 2007 and 2006, approximately $254,000 and $123,000 of share-based cost was expensed, respectively. As of March 31, 2007, there was $2.4 million of total unrecognized compensation costs related to stock options. These costs are expected to be recognized over a weighted average period of 2.0 years. The fair value of options granted in 2007 and 2006 was based upon a Black-Scholes option pricing model using the assumptions in the following table for each of the three month periods ended March 31, 2007:
| 2007 | 2006 | |||||
| Expected Volatility |
24 | % | 24 | % | ||
| Expected Dividends |
8 | % | 8 | % | ||
| Expected term (in years) |
4.5 | 4.5 | ||||
| Risk-free rate |
4.47 - 4.88 | % | 4.80 | % |
10. Financial Highlights
Following is a schedule of financial highlights for the three months ended March 31, 2007 and 2006:
| Three Months Ended March 31, | ||||||||
| 2007 | 2006 | |||||||
| Per share data: |
||||||||
| Net asset value at beginning of period |
$ | 11.65 | $ | 11.67 | ||||
| Net investment income |
0.23 | 0.03 | ||||||
| Net realized gain on investments |
0.01 | 0.15 | ||||||
| Net unrealized appreciation on investments |
0.04 | 0.07 | ||||||
| Total from investment operations |
0.28 | 0.25 | ||||||
| Net increase/(decrease) in net assets from capital share transactions |
0.04 | — | ||||||
| Distributions from ordinary income |
(0.30 | ) | (0.30 | ) | ||||
| Stock-based compensation expense included in investment income(1) |
0.01 | 0.01 | ||||||
| Net asset value at end of period |
$ | 11.68 | $ | 11.63 | ||||
| Ratios and supplemental data: |
||||||||
| Per share market value at end of period |
$ | 13.70 | 11.35 | |||||
| Total return(2) |
-1.74 | % | -2.84 | % | ||||
| Shares outstanding at end of period |
23,090,751 | 10,234,865 | ||||||
| Weighted average number of common shares outstanding |
22,871,000 | 9,912,595 | ||||||
| Net assets at end of period |
$ | 269,610,740 | $ | 119,039,735 | ||||
| Ratio of operating expense to average net assets (annualized) |
6.70 | % | 15.39 | % | ||||
| Ratio of net investment income before provision for income tax expense and investment gains and losses to average net assets (annualized) |
7.87 | % | 7.09 | % | ||||
| Average debt outstanding |
$ | 38,211,000 | $ | 82,666,667 | ||||
| Weighted average debt per common share |
$ | 1.67 | $ | 8.34 | ||||
| Portfolio turnover |
0.29 | % | 0.66 | % | ||||
| (1) | Stock option expense is a non-cash expense that has no effect on net asset value. Pursuant to Financial Accounting Standards No. 123R, net investment loss includes the expense associated with the granting of stock options which is offset by a corresponding increase in paid-in capital. |
F-63
| (2) | The total return equals the change in the ending market value over the beginning of period price per share plus dividends paid per share during the period, divided by the beginning price. |
11. Commitments and Contingencies
In the normal course of business, the Company is party to financial instruments with off-balance sheet risk. These instruments consist primarily of unused commitments to extend credit, in the form of loans, to the Company’s portfolio companies. The balance of unused commitments to extend credit at March 31, 2007 totaled approximately $74.7 million. Since this commitment may expire without being drawn upon, the total commitment amount does not necessarily represent future cash requirements.
Certain premises are leased under agreements which expire at various date through December 2013. Total rent expense amounted to approximately $151,000 and $60,000 during the three-month periods ended March 31, 2007 and 2006, respectively.
The following table shows our contractual obligations as of March 31, 2007:
| Payments due by period (dollars in thousands) | |||||||||||||||
| Contractual Obligations(1) |
Total | Less than 1 year |
1-3 years | 3-5 years | After 5 years | ||||||||||
| Borrowings(2)(3) |
$ | 113,000 | $ | 113,000 | $ | — | $ | — | $ | — | |||||
| Operating Lease Obligations |
3,132 | 457 | 1,384 | 993 | 298 | ||||||||||
| Total |
$ | 116,132 | $ | 113,457 | $ | 1,384 | $ | 993 | $ | 298 | |||||
| (1) | Excludes commitments to extend credit to our portfolio companies. |
| (2) | Borrowings under our Citigroup Credit Facility are listed based on the contractual maturity of the credit facility. Actual repayments could differ significantly due to prepayments by our existing portfolio companies, modifications of our current agreements with our existing portfolio companies and modification of the credit facility. |
| (3) | We also have a warrant participation agreement with Citigroup. See Note 4. |
The Company and its executives and directors are covered by Directors and Officers Insurance, with the directors and officers being indemnified by the Company to the maximum extent permitted by Maryland law subject to the restrictions in the 1940 Act.
12. Recent Accounting Pronouncements
In September 2006, the FASB issued SFAS No. 157 (“FAS 157”), “Fair Value Measurements.” Among other requirements, FAS 157 defines fair value and establishes a framework for measuring fair value and also expands disclosure about the use of fair value to measure assets and liabilities. FAS 157 is effective for the first fiscal year that begins after November 15, 2007. The Company is currently evaluating the impact of FAS 157 on its financial position and results of operations. As of March 31, 2007, the Company does not believe the adoption of FAS 157 will impact the amounts reported in the financial statements, however, additional disclosures will be required about the inputs used to develop the measurements of fair value and the effect of certain of the measurements reported in the statement of operations for a fiscal period.
13. Subsequent Events
On April 5, 2007, Hercules and its subsidiary, Hercules Technology II, L.P., received an exemptive order from the Securities and Exchange Commission allowing Hercules to exclude debt securities issued by its subsidiary, Hercules Technology II, L.P. from the asset coverage requirements applicable to Hercules. Hercules Technology Growth Capital, Inc. is the sole limited partner of Hercules Technology II, L.P.
F-64
Through its subsidiary, Hercules Technology II, L.P., Hercules Technology Growth Capital, Inc. intends to seek up to $124.0 million in leverage in various tranches over the next two years if it satisfies certain regulatory requirements, which is the maximum amount currently available under regulations of the SBA. Hercules Technology II, L.P. is currently approved to draw up to $50.0 million and on April 26, 2007, it borrowed $12.0 million under the SBA program.
On May 1, 2007 the Board of Directors declared a dividend of $0.30 per share for the first quarter, payable on June 18, 2007 to shareholders of record as of May 16, 2007.
On May 2, 2007, the Company amended the Citigroup Facility to extend the expiration date to May 1, 2008, increased the borrowing capacity under the facility to $250 million and included Deutsche Bank Securities Inc. as a participant along with Citigroup Markets Realty Corp. The credit facility is a one year facility and is renewable on May 1, 2008 with an interest rate of LIBOR plus a spread of 1.20%.
On May 3, 2007, Novadaq Pharmaceuticals, a publicly traded Canadian corporation, acquired certain assets of Xillix Technologies for cash and common stock. Of the purchase price, Hercules will receive approximately CDN $810,000 and approximately 225,000 shares of Novadaq Pharmaceuticals’ common stock.
F-65