UNITED STATES
SECURITIES AND EXCHANGE COMMISSION
Washington, D.C. 20549
FORM 10-K
(Mark One)
|
☒ |
ANNUAL REPORT PURSUANT TO SECTION 13 OR 15 (d) OF THE SECURITIES EXCHANGE ACT OF 1934 |
For the fiscal year ended December 31, 2018
OR
|
☐ |
TRANSITION REPORT PURSUANT TO SECTION 13 OR 15 (d) OF THE SECURITIES EXCHANGE ACT OF 1934 |
For the transition period from to
Commission File No. 814-00702
Hercules Capital, Inc.
(Exact name of Registrant as specified in its charter)
|
Maryland |
|
74-3113410 |
|
(State or other jurisdiction of incorporation or organization) |
|
(I.R.S. Employer Identification Number) |
400 Hamilton Avenue, Suite 310
Palo Alto, California 94301
(Address of principal executive offices)
(650) 289-3060
(Registrant’s telephone number, including area code)
Securities registered pursuant to Section 12(b) of the Act:
|
Title of each class |
|
Name of each exchange on which registered |
|
Common Shares, par value $0.001 per share 6.25% Notes due 2024 5.25% Notes due 2025 6.25% Notes due 2033 |
|
New York Stock Exchange New York Stock Exchange New York Stock Exchange New York Stock Exchange |
Securities registered pursuant to Section 12(g) of the Act: None
Indicate by check mark if the registrant is a well-known seasoned issuer, as defined in Rule 405 of the Securities Act. Yes ☐ No ☒
Indicate by check mark if the registrant is not required to file reports pursuant to Section 13 or 15(d) of the Act. Yes ☐ No ☒
Indicate by check mark whether the registrant (1) has filed all reports required to be filed by Section 13 or 15(d) of the Securities Exchange Act of 1934 during the preceding 12 months (or for such shorter period that the registrant was required to file such reports), and (2) has been subject to such filing requirements for the past 90 days: Yes ☒ No ☐
Indicate by check mark whether the registrant has submitted electronically every Interactive Data File required to be submitted pursuant to Rule 405 of Regulation S-T (§ 232.405 of this chapter) during the preceding 12 months (or for such shorter period that the registrant was required to submit such files). Yes ☐ No ☐
Indicate by check mark if disclosure of delinquent filers pursuant to Item 405 of Regulation S-K is not contained herein, and will not be contained, to the best of registrant’s knowledge, in definitive proxy or information statements incorporated by reference in Part III of this Form 10-K or any amendment to this Form 10-K. ☒
Indicate by check mark whether the registrant is a large accelerated filer, an accelerated filer, a non-accelerated filer, a smaller reporting company, or an emerging growth company. See the definitions of “large accelerated filer”, “accelerated filer”, “smaller reporting company”, and “emerging growth company” in Rule 12b-2 of the Exchange Act.
Large accelerated filer ☒ Accelerated filer ☐ Non-accelerated filer ☐ Smaller reporting company ☐ Emerging growth company ☐
|
If an emerging growth company, indicate by check mark if the registrant has elected not to use the extended transition period for complying with a new or revised financial accounting standards provided pursuant to Section 13(a) of the Exchange Act. ☐ |
|
|
Indicate by check mark whether the registrant is a shell company (as defined in Rule 12b-2 of the Act). Yes ☐ No ☒
The aggregate market value of the voting and non-voting common stock held by non-affiliates of the registrant as of the last business day of the registrant’s most recently completed second fiscal quarter was approximately $1.2 billion based upon a closing price of $12.65 reported for such date on the New York Stock Exchange. Common shares held by each executive officer and director and by each person who owns 5% or more of the outstanding common shares have been excluded in that such persons may be deemed to be affiliates. This determination of affiliate status is not intended and shall not be deemed to be an admission that, such persons are affiliates of the Registrant.
On February 15, 2019, there were 96,445,700 shares outstanding of the registrant’s common stock, $0.001 par value.
DOCUMENTS INCORPORATED BY REFERENCE
Documents incorporated by reference: Portions of the registrant’s Proxy Statement for its 2019 Annual Meeting of Shareholders to be filed within 120 days after the close of the registrant’s year end are incorporated by reference into Part III of this Annual Report on Form 10-K.
FORM 10-K
ANNUAL REPORT
|
|
|
Page |
|
|
|
|
|
Item 1. |
3 |
|
|
Item 1A. |
26 |
|
|
Item 1B. |
66 |
|
|
Item 2. |
66 |
|
|
Item 3. |
66 |
|
|
Item 4. |
66 |
|
|
|
|
|
|
Item 5. |
|
67 |
|
Item 6. |
70 |
|
|
Item 7. |
Management’s Discussion and Analysis of Financial Condition and Results of Operations |
71 |
|
Item 7A. |
94 |
|
|
Item 8. |
95 |
|
|
Item 9. |
Changes in and Disagreements with Accountants on Accounting and Financial Disclosure |
175 |
|
Item 9A. |
175 |
|
|
Item 9B. |
175 |
|
|
|
|
|
|
Item 10. |
|
176 |
|
Item 11. |
176 |
|
|
Item 12. |
Security Ownership of Certain Beneficial Owners and Management and Related Stockholder Matters |
176 |
|
Item 13. |
Certain Relationships and Related Transactions and Director Independence |
176 |
|
Item 14. |
176 |
|
|
|
|
|
|
Item 15. |
|
177 |
|
Item 16. |
177 |
|
|
188 |
||
Hercules Capital, Inc., our logo and other trademarks of Hercules Capital, Inc. are the property of Hercules Capital, Inc. All other trademarks or trade names referred to in this Annual Report on Form 10-K are the property of their respective owners.
2
In this Annual Report on Form 10-K, or Annual Report, the “Company,” “Hercules,” “HTGC,” “we,” “us” and “our” refer to Hercules Capital, Inc. and its wholly owned subsidiaries and its affiliated securitization trusts on or after February 25, 2016 and “Hercules Technology Growth Capital, Inc.” and its wholly owned subsidiaries and its affiliated securitization trusts prior to February 25, 2016 unless the context otherwise requires.
GENERAL
We are a specialty finance company focused on providing senior secured loans to high-growth, innovative venture capital-backed companies in a variety of technology, life sciences and sustainable and renewable technology industries. We source our investments through our principal office located in Palo Alto, CA, as well as through our additional offices in Boston, MA, New York, NY, Washington, DC, Hartford, CT, Westport, CT, Chicago, IL, and San Diego, CA.
Our goal is to be the leading structured debt financing provider for venture capital-backed companies in technology-related industries requiring sophisticated and customized financing solutions. Our strategy is to evaluate and invest in a broad range of technology-related industries including technology, drug discovery and development, biotechnology, life sciences, healthcare, and sustainable and renewable technology and to offer a full suite of growth capital products. We focus our investments in companies active in the technology industry sub-sectors characterized by products or services that require advanced technologies, including, but not limited to, computer software and hardware, networking systems, semiconductors, semiconductor capital equipment, information technology infrastructure or services, internet consumer and business services, telecommunications, telecommunications equipment, renewable or alternative energy, media and life sciences. Within the life sciences sub-sector, we generally focus on medical devices, bio-pharmaceutical, drug discovery, drug delivery, health care services and information systems companies. Within the sustainable and renewable technology sub-sector, we focus on sustainable and renewable energy technologies and energy efficiency and monitoring technologies. We refer to all of these companies as “technology-related” companies and intend, under normal circumstances, to invest at least 80% of the value of our total assets in such businesses.
We invest primarily in structured debt with warrants and, to a lesser extent, in senior debt and equity investments. We invest primarily in private companies but also have investments in public companies. We use the term “structured debt with warrants” to refer to any debt investment, such as a senior or subordinated secured loan, that is coupled with an equity component, including warrants, options or other rights to purchase common or preferred stock. Our structured debt with warrants investments typically are secured by some or all of the assets of the portfolio company. We also provide “unitranche” loans, which are loans that combine both senior and mezzanine debt, generally in a first lien position.
Our investment objective is to maximize our portfolio total return by generating current income from our debt investments and capital appreciation from our warrant and equity-related investments. Our primary business objectives are to increase our net income, net operating income and net asset value, or NAV, by investing in structured debt with warrants and equity of venture capital-backed companies in technology-related industries with attractive current yields and the potential for equity appreciation and realized gains. Our equity ownership in our portfolio companies may exceed 25% of the voting securities of such companies, which represents a controlling interest under the Investment Company Act of 1940, as amended, or the 1940 Act. In some cases, we receive the right to make additional equity investments in our portfolio companies in connection with future equity financing rounds. Capital that we provide directly to venture capital-backed companies in technology-related industries is generally used for growth and general working capital purposes as well as in select cases for acquisitions or recapitalizations.
We also make investments in qualifying small businesses through Hercules Technology III L.P., or HT III, which is our wholly-owned small business investment company, or SBIC. HT III holds approximately $307.5 million in assets which accounted for approximately 14.3% of our total assets, prior to consolidation at December 31, 2018. At December 31, 2018, we have issued $149.0 million in Small Business Administration, or SBA, guaranteed debentures in our SBIC subsidiary. See “— Regulation—Small Business Administration Regulations” for additional information regarding our SBIC subsidiary.
3
We regularly engage in discussions with third parties with respect to various potential transactions to explore all alternatives. We may acquire an investment or a portfolio of investments or an entire company or sell portions of our portfolio on an opportunistic basis. We, our subsidiaries or our affiliates, may also agree to manage certain other funds that invest in debt, equity or provide other financing or services to companies in a variety of industries for which we may earn management or other fees for our services. We may also invest in the equity of these funds, along with other third parties, from which we would seek to earn a return and/or future incentive allocations. Some of these transactions could be material to our business. Consummation of any such transaction will be subject to completion of due diligence, finalization of key business and financial terms (including price) and negotiation of final definitive documentation as well as a number of other factors and conditions including, without limitation, the approval of our Board of Directors and required regulatory or third-party consents and, in certain cases, the approval of our stockholders. Accordingly, there can be no assurance that any such transaction would be consummated. Any of these transactions or funds may require significant management resources either during the transaction phase or on an ongoing basis depending on the terms of the transaction.
CORPORATE HISTORY AND OFFICES
We are a Maryland corporation formed in December 2003 that began investment operations in September 2004. On February 25, 2016, we changed our name from “Hercules Technology Growth Capital, Inc.” to “Hercules Capital, Inc.” We are an internally managed, non-diversified closed-end investment company that has elected to be regulated as a business development company under the 1940 Act. As a business development company, we are required to comply with certain regulatory requirements. For instance, we generally have to invest at least 70% of our total assets in “qualifying assets,” including securities of private U.S. companies, cash, cash equivalents, U.S. government securities and high-quality debt investments that mature in one year or less. As a business development company, we must also meet a coverage ratio of total net assets to total senior securities, which include all of our borrowings (including accrued interest payable) except for debentures issued by the SBA and any preferred stock we may issue in the future, of at least 150% subsequent to each borrowing or issuance of senior securities. See “Regulation.”
Our portfolio is comprised of, and we anticipate that our portfolio will continue to be comprised of, investments primarily in technology-related companies at various stages of their development. Consistent with regulatory requirements, we invest primarily in United States based companies and, to a lesser extent, in foreign companies.
We are internally managed under the supervision of our Board of Directors. We do not pay management or advisory fees, but instead incur costs customary for an operating company. Some of those costs include recruiting and marketing expenses as well as the costs associated with employing management, investment and portfolio management professionals, and technology, secretarial and other support personnel. In connection with our recruiting, branding and marketing efforts, we may, among other things, make charitable contributions in amounts we believe to be immaterial and that do not exceed $500,000 in the aggregate in any year. We believe that many of these contributions help us raise our profile in the communities and benefit us in attracting and retaining talent and investment opportunities.
Effective January 1, 2006, we elected to be treated for tax purposes as a regulated investment company, or RIC, under the Internal Revenue Code of 1986, as amended, or the Code. Pursuant to this election, we generally will not have to pay corporate-level taxes on any income that we distribute to our stockholders. However, our qualification and election to be treated as a RIC requires that we comply with provisions contained in the Code. For example, as a RIC we must receive 90% or more of our income from qualified earnings, typically referred to as “good income,” as well as satisfy asset diversification and income distribution requirements. As an investment company, we follow accounting and reporting guidance as set forth in Topic 946, Financial Services – Investment Companies, of the Financial Accounting Standards Board’s, or FASB’s, Accounting Standards Codification, as amended, or ASC.
Our principal executive offices are located at 400 Hamilton Avenue, Suite 310, Palo Alto, California 94301, and our telephone number is (650) 289-3060. We also have offices in Boston, MA, New York, NY, Washington, DC, Hartford, CT, Westport, CT, Chicago, IL, and San Diego, CA. We maintain a website on the Internet at www.htgc.com. We make available, free of charge, on our website our proxy statement, annual report on Form 10-K, quarterly reports on Form 10-Q, current reports on Form 8-K and amendments to those reports as soon as reasonably practicable after we electronically file such material with, or furnish it to, the Securities and Exchange Commission, or SEC. Information contained on our website is not incorporated by reference into this Annual Report, and you should not consider that information to be part of this Annual Report.
We file annual, quarterly and current periodic reports, proxy statements and other information with the SEC, under the Securities Exchange Act of 1934, as amended, or the Exchange Act. In addition, the SEC maintains an Internet website, at www.sec.gov, that contains reports, proxy and information statements, and other information regarding issuers, including us, who file documents electronically with the SEC.
4
We believe that technology-related companies compete in one of the largest and most rapidly growing sectors of the U.S. economy and that continued growth is supported by ongoing innovation and performance improvements in technology products as well as the adoption of technology across virtually all industries in response to competitive pressures. We believe that an attractive market opportunity exists for a specialty finance company focused primarily on investments in structured debt with warrants in technology-related companies for the following reasons:
|
|
• |
technology-related companies have generally been underserved by traditional lending sources; |
|
|
• |
unfulfilled demand exists for structured debt financing to technology-related companies due to the complexity of evaluating risk in these investments; and |
|
|
• |
structured debt with warrants products are less dilutive and complement equity financing from venture capital and private equity funds. |
Technology-Related Companies are Underserved by Traditional Lenders. We believe many viable technology-related companies backed by financial sponsors have been unable to obtain sufficient growth financing from traditional lenders, including financial services companies such as commercial banks and finance companies because traditional lenders have continued to consolidate and have adopted a more risk-averse approach to lending. More importantly, we believe traditional lenders are typically unable to underwrite the risk associated with these companies effectively.
The unique cash flow characteristics of many technology-related companies typically include significant research and development expenditures and high projected revenue growth thus often making such companies difficult to evaluate from a credit perspective. In addition, the balance sheets of these companies often include a disproportionately large amount of intellectual property assets, which can be difficult to value. Finally, the speed of innovation in technology and rapid shifts in consumer demand and market share add to the difficulty in evaluating technology-related companies.
Due to the difficulties described above, we believe traditional lenders generally refrain from entering the structured debt financing marketplace, instead preferring the risk-reward profile of asset-based lending. Traditional lenders generally do not have flexible product offerings that meet the needs of technology-related companies. The financing products offered by traditional lenders typically impose on borrowers many restrictive covenants and conditions, including limiting cash outflows and requiring a significant depository relationship to facilitate rapid liquidation.
Unfulfilled Demand for Structured Debt Financing to Technology-Related Companies. Private debt capital in the form of structured debt financing from specialty finance companies continues to be an important source of funding for technology-related companies. We believe that the level of demand for structured debt financing is a function of the level of annual venture equity investment activity.
We believe that demand for structured debt financing is currently underserved. The venture capital market for the technology-related companies in which we invest has been active. Therefore, to the extent we have capital available, we believe this is an opportune time to be active in the structured lending market for technology-related companies.
Structured Debt with Warrants Products Complement Equity Financing From Venture Capital and Private Equity Funds. We believe that technology-related companies and their financial sponsors will continue to view structured debt securities as an attractive source of capital because it augments the capital provided by venture capital and private equity funds. We believe that our structured debt with warrants products provide access to growth capital that otherwise may only be available through incremental investments by existing equity investors. As such, we provide portfolio companies and their financial sponsors with an opportunity to diversify their capital sources. Generally, we believe many technology-related companies at all stages of development target a portion of their capital to be debt in an attempt to achieve a higher valuation through internal growth. In addition, because financial sponsor-backed companies have reached a more mature stage prior to reaching a liquidity event, we believe our investments could provide the debt capital needed to grow or recapitalize during the extended period sometimes required prior to liquidity events.
5
Our strategy to achieve our investment objective includes the following key elements:
Leverage the Experience and Industry Relationships of Our Management Team and Investment Professionals. We have assembled a team of experienced investment professionals with extensive experience as venture capitalists, commercial lenders, and originators of structured debt and equity investments in technology-related companies. Our investment professionals have, on average, more than 10 years of experience as equity investors in, and/or lenders to, technology-related companies. In addition, our team members have originated structured debt, debt with warrants and equity investments in over 450 technology-related companies, representing almost $8.5 billion in commitments from inception to December 31, 2018, and have developed a network of industry contacts with investors and other participants within the venture capital and private equity communities. In addition, members of our management team also have operational, research and development and finance experience with technology-related companies. We have established contacts with leading venture capital and private equity fund sponsors, public and private companies, research institutions and other industry participants, which we believe will enable us to identify and attract well-positioned prospective portfolio companies.
We focus our investing activities generally in industries in which our investment professionals have investment experience. We believe that our focus on financing technology-related companies will enable us to leverage our expertise in structuring prospective investments, to assess the value of both tangible and intangible assets, to evaluate the business prospects and operating characteristics of technology-related companies and to identify and originate potentially attractive investments with these types of companies.
Mitigate Risk of Principal Loss and Build a Portfolio of Equity-Related Securities. We expect that our investments have the potential to produce attractive risk-adjusted returns through current income, in the form of interest and fee income, as well as capital appreciation from warrant and equity-related securities. We believe that we can mitigate the risk of loss on our debt investments through the combination of loan principal amortization, cash interest payments, relatively short maturities (typically between 24-48 months), security interests in the assets of our portfolio companies, and on select investment covenants requiring prospective portfolio companies to have certain amounts of available cash at the time of our investment and the continued support from a venture capital or private equity firm at the time we make our investment. Although we do not currently engage in hedging transactions, we may engage in hedging transactions in the future utilizing instruments such as forward contracts, currency options and interest rate swaps, caps, collars, and floors.
Historically our structured debt investments to technology-related companies typically include warrants or other equity interests, giving us the potential to realize equity-like returns on a portion of our investment. In addition, in some cases, we receive the right to make additional equity investments in our portfolio companies, including the right to convert some portion of our debt into equity, in connection with future equity financing rounds. We believe these equity interests will create the potential for meaningful long-term capital gains in connection with the future liquidity events of these technology-related companies.
Provide Customized Financing Complementary to Financial Sponsors’ Capital. We offer a broad range of investment structures and possess expertise and experience to effectively structure and price investments in technology-related companies. Unlike many of our competitors that only invest in companies that fit a specific set of investment parameters, we have the flexibility to structure our investments to suit the particular needs of our portfolio companies. We offer customized financing solutions ranging from senior debt, including below-investment grade debt instruments, also known as “junk bonds”, to equity capital, with a focus on structured debt with warrants.
We use our relationships in the financial sponsor community to originate investment opportunities. Because venture capital and private equity funds typically invest solely in the equity securities of their portfolio companies, we believe that our debt investments will be viewed as an attractive and complimentary source of capital, both by the portfolio company and by the portfolio company’s financial sponsor. In addition, we believe that many venture capital and private equity fund sponsors encourage their portfolio companies to use debt financing for a portion of their capital needs as a means of potentially enhancing equity returns, minimizing equity dilution and increasing valuations prior to a subsequent equity financing round or a liquidity event.
Invest at Various Stages of Development. We provide growth capital to technology-related companies at all stages of development, including select publicly listed companies and select special opportunity lower middle market companies that require additional capital to fund acquisitions, recapitalizations and refinancings and established-stage companies. We believe that this provides us with a broader range of potential investment opportunities than those available to many of our competitors, who generally focus their investments on a particular stage in a company’s development. Because of the flexible structure of our investments and the extensive experience of our investment professionals, we believe we are well positioned to take advantage of these investment opportunities at all stages of prospective portfolio companies’ development.
6
Benefit from Our Efficient Organizational Structure. We believe that the perpetual nature of our corporate structure enables us to be a long-term partner for our portfolio companies in contrast to traditional investment funds, which typically have a limited life. In addition, because of our access to the equity markets, we believe that we may benefit from a lower cost of capital than that available to private investment funds. We are not subject to requirements to return invested capital to investors nor do we have a finite investment horizon. Capital providers that are subject to such limitations are often required to seek a liquidity event more quickly than they otherwise might, which can result in a lower overall return on an investment.
Deal Sourcing Through Our Proprietary Database. We have developed a proprietary and comprehensive structured query language-based, or SQL, database system to track various aspects of our investment process including sourcing, originations, transaction monitoring and post-investment performance. As of December 31, 2018, our proprietary SQL-based database system included approximately 50,788 technology-related companies and approximately 11,767 venture capital firms, private equity sponsors/investors, as well as various other industry contacts. This proprietary SQL system allows us to maintain, cultivate and grow our industry relationships while providing us with comprehensive details on companies in the technology-related industries and their financial sponsors.
OUR INVESTMENTS AND OPERATIONS
We principally invest in debt securities and, to a lesser extent, equity securities, with a particular emphasis on structured debt with warrants.
We generally seek to invest in companies that have been operating for at least six to 12 months prior to the date of our investment. We anticipate that such entities may, at the time of investment, be generating revenues or will have a business plan that anticipates generation of revenues within 24 to 48 months. Further, we anticipate that on the date of our investment we will generally obtain a lien on available assets, which may or may not include intellectual property, and these companies will have sufficient cash on their balance sheet to operate as well as potentially amortize their debt for at least three to nine months following our investment. We generally require that a prospective portfolio company, in addition to having sufficient capital to support leverage, demonstrate an operating plan capable of generating cash flows or raising the additional capital necessary to cover its operating expenses and service its debt, for an additional six to 12 months subject to market conditions.
We expect that our investments will generally range from $12.0 million to $40.0 million, although we may make investments in amounts above or below this range. We typically structure our debt securities to provide for amortization of principal over the life of the loan, but may include a period of interest-only payments. Our loans will typically be collateralized by a security interest in the borrower’s assets, although we may not have the first claim on these assets and the assets may not include intellectual property. Our debt investments carry fixed or variable contractual interest rates which generally ranged from approximately 5.5% to 15.7% as of December 31, 2018. As of December 31, 2018, approximately 97.3% of our loans were at floating rates or floating rates with a floor and 2.7% of the loans were at fixed rates.
In addition to the cash yields received on our loans, our loans generally include one or more of the following: exit fees, balloon payment fees, commitment fees, success fees or prepayment fees. In some cases, our loans also include contractual payment-in-kind, or PIK, interest arrangements. The increases in loan balances as a result of contractual PIK arrangements are included in income for the period in which such PIK interest was accrued, which is often in advance of receiving cash payment, and are separately identified on our statements of cash flows. We also may be required to include in income for tax purposes certain other amounts prior to receiving the related cash.
In addition, the majority of our investments in the structured debt of venture capital-backed companies generally have equity enhancement features, typically in the form of warrants or other equity-related securities that are considered original issue discounts, or OID, to our loans and are designed to provide us with an opportunity for potential capital appreciation. The warrants typically will be immediately exercisable upon issuance and generally will remain exercisable for the lesser of five to ten years or three to five years after completion of an initial public offering, or IPO. The exercise prices for the warrants varies from nominal exercise prices to exercise prices that are at or above the current fair market value of the equity for which we receive warrants. We may structure warrants to provide minority rights provisions or on a very select basis put rights upon the occurrence of certain events. We generally target a total annualized return (including interest, fees and value of warrants) of 12% to 25% for our debt investments.
7
Typically, our structured debt and equity investments take one of the following forms:
|
|
• |
Structured Debt with Warrants. We seek to invest a majority of our assets in structured debt with warrants of prospective portfolio companies. Our investments in structured debt with warrants may be the only debt capital on the balance sheet of our portfolio companies, and in many cases we have a first priority security interest in all of our portfolio company’s assets, or in certain investments we may have a negative pledge on intellectual property. Our structured debt with warrants typically has a maturity of between two and seven years, and they may provide for full amortization after an interest only period. Our structured debt with warrants generally carries a contractual interest rate up to 15.7% and may include an additional exit fee payment or contractual PIK interest arrangements. We may structure our structured debt with warrants with restrictive affirmative and negative covenants, default penalties, prepayment penalties, lien protection, equity calls, change-in-control provisions or board observation rights. |
|
|
• |
Senior Debt. We seek to invest a limited portion of our assets in senior debt. Senior debt may be collateralized by accounts receivable and/or inventory financing of prospective portfolio companies. Senior debt has a senior position with respect to a borrower’s scheduled interest and principal payments and holds a first priority security interest in the assets pledged as collateral. Senior debt also may impose covenants on a borrower with regard to cash flows and changes in capital structure, among other items. We generally collateralize our investments by obtaining security interests in our portfolio companies’ assets, which may include their intellectual property. In other cases we may obtain a negative pledge covering a company’s intellectual property. Our senior loans, in certain instances, may be tied to the financing of specific assets. In connection with a senior debt investment, we may also provide the borrower with a working capital line-of-credit that will carry an interest rate ranging from Prime or LIBOR plus a spread with a floor, generally maturing in one to three years, and typically secured by accounts receivable and/or inventory. We also provide “unitranche” loans, which are loans that combine both senior and mezzanine debt, generally in a first lien position with security interest in all the assets of the portfolio company. The loans can either be “first out” or “last out”, whereby the “last-out” loans will be subordinated to the “first-out” portion of the unitranche loan in a liquidation, sale or other disposition. |
|
|
• |
Equipment Loans. We intend to invest a limited portion of our assets in equipment-based loans to early-stage prospective portfolio companies. Equipment-based loans are secured by a first priority security interest in only the specific assets financed. These loans are generally for amounts of $1.0 million to $3.0 million but may be up to $15.0 million, carry a contractual interest rate between Prime and Prime plus 9.0%, and have an average term between three and four years. Equipment loans may also include exit fee payments. |
|
|
• |
Equity-Related Securities. The equity-related securities we hold consist primarily of warrants or other equity interests generally obtained in connection with our structured debt investments. In addition to the warrants received as a part of a structured debt financing, we typically receive the right to make equity investments in a portfolio company in connection with that company’s next round of equity financing. We may also hold certain debt investments that have the right to convert a portion of the debt investment into equity. These rights will provide us with the opportunity to further enhance our returns over time through opportunistic equity investments in our portfolio companies. These equity-related investments are typically in the form of preferred or common equity and may be structured with a dividend yield, providing us with a current return, and with customary anti-dilution protection and preemptive rights. We may achieve liquidity through a merger or acquisition of a portfolio company, a public offering of a portfolio company’s stock or by exercising our right, if any, to require a portfolio company to buy back the equity-related securities we hold. We may also make stand-alone direct equity investments into portfolio companies in which we may not have any debt investment in the company. As of December 31, 2018, we held warrant and equity-related securities in 158 portfolio companies. |
8
A comparison of the typical features of our various investment alternatives is set forth in the chart below.
|
Structured Debt with Warrants |
Senior Debt |
Equipment Loans |
Equity-Related Securities |
|
|
Typical Structure |
Term debt with warrants |
Term or revolving debt |
Term debt with warrants |
Preferred stock or common stock |
|
Investment Horizon |
Long-term, ranging from 2 to 7 years, with an average of 3 years |
Usually under 3 years |
Ranging from 3 to 4 years |
Ranging from 3 to 7 years |
|
Ranking/Security |
Senior secured, either first out or last out, or second lien |
Senior / First lien |
Secured only by underlying equipment |
None/unsecured |
|
Covenants |
Less restrictive; mostly financial |
Generally borrowing base and financial |
None |
None |
|
Risk Tolerance |
Medium / High |
Low |
High |
High |
|
Coupon/Dividend |
Cash pay - fixed and floating rate; PIK in limited cases |
Cash pay - fixed or floating rate |
Cash pay - fixed or floating rate and may include PIK |
Generally none |
|
Customization or Flexibility |
More flexible |
Little to none |
Little to none |
Flexible |
|
Equity Dilution |
Low to medium |
None to low |
Low |
High |
Investment Criteria
We have identified several criteria, among others, that we believe are important in achieving our investment objective with respect to prospective portfolio companies. These criteria, while not inclusive, provide general guidelines for our investment decisions.
Portfolio Composition. While we generally focus our investments in venture capital-backed companies in technology-related industries, we seek to invest across various financial sponsors as well as across various stages of companies’ development and various technology industry sub-sectors and geographies. As of December 31, 2018, approximately 87.8% of the fair value of our portfolio was composed of investments in five industries: 29.2% was composed of investments in the software industry, 28.7% was composed of investments in the drug discovery and development industry, 17.5% was composed of investments in the internet consumer and business services industry, 6.5% was composed of investments in the medical devices & equipment industry and 5.9% was composed of investments in the sustainable and renewable technology industry.
Continuing Support from One or More Financial Sponsors. We generally invest in companies in which one or more established financial sponsors have previously invested and continue to make a contribution to the management of the business. We believe that having established financial sponsors with meaningful commitments to the business is a key characteristic of a prospective portfolio company. In addition, we look for representatives of one or more financial sponsors to maintain seats on the Board of Directors of a prospective portfolio company as an indication of such commitment.
Company Stage of Development. While we invest in companies at various stages of development, we generally require that prospective portfolio companies be beyond the seed stage of development and generally have received or anticipate having commitments for their first institutional round of equity financing for early stage companies. We expect a prospective portfolio company to demonstrate progress in its product development or demonstrate a path towards revenue generation or increase its revenues and operating cash flow over time. The anticipated growth rate of a prospective portfolio company is a key factor in determining the value that we ascribe to any warrants or other equity securities that we may acquire in connection with an investment in debt securities.
Operating Plan. We generally require that a prospective portfolio company, in addition to having potential access to capital to support leverage, demonstrate an operating plan capable of generating cash flows or the ability to potentially raise the additional capital necessary to cover its operating expenses and service its debt for a specific period. Specifically, we require that a prospective portfolio company demonstrate at the time of our proposed investment that in addition to having sufficient capital to support leverage, it has an operating plan capable of generating cash flows or raising the additional capital necessary to cover its operating expenses and service its debt for an additional six to 12 months subject to market conditions.
Security Interest. In many instances we seek a first priority security interest in all of the portfolio companies’ tangible and intangible assets as collateral for our debt investment, subject in some cases to permitted exceptions. In other cases we may obtain a negative pledge prohibiting a company from pledging or otherwise encumbering their intellectual property. Although we do not intend to operate as an asset-based lender, the estimated liquidation value of the assets, if any, collateralizing the debt securities that we hold is an important factor in our credit analysis and subject to assumptions that may change over the life of the investment especially when attempting to estimate the value of intellectual property. We generally evaluate both tangible assets, such as accounts receivable, inventory and equipment, and intangible assets, such as intellectual property, customer lists, networks and databases.
9
Covenants. Our investments may include one or more of the following covenants: cross-default; material adverse change provisions; requirements that the portfolio company provide periodic financial reports and operating metrics; and limitations on the portfolio company’s ability to incur additional debt, sell assets, dividend recapture, engage in transactions with affiliates and consummate an extraordinary transaction, such as a merger or recapitalization without our consent. In addition, we may require other performance or financial based covenants, as we deem appropriate.
Exit Strategy. Prior to making a debt investment that is accompanied by an equity-related security in a prospective portfolio company, we analyze the potential for that company to increase the liquidity of its equity through a future event that would enable us to realize appreciation in the value of our equity interest. Liquidity events may include an IPO, a private sale of our equity interest to a third party, a merger or an acquisition of the company or a purchase of our equity position by the company or one of its stockholders.
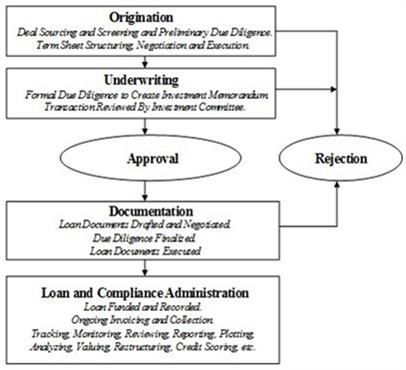
Investment Process
We have organized our management team around the four key elements of our investment process:
|
|
• |
Origination; |
|
|
• |
Underwriting; |
|
|
• |
Documentation; and |
|
|
• |
Loan and Compliance Administration. |
Our investment process is summarized in the following chart:
Origination
The origination process for our investments includes sourcing, screening, preliminary due diligence and deal structuring and negotiation, all leading to an executed non-binding term sheet. As of December 31, 2018, our investment origination team, which consists of approximately 36 investment professionals, is headed by our Chief Investment Officer and our Chief Executive Officer. The origination team is responsible for sourcing potential investment opportunities and members of the investment origination team use their extensive relationships with various leading financial sponsors, management contacts within technology-related companies, trade sources, technology conferences and various publications to source prospective portfolio companies. Our investment origination team is divided into life sciences, technology, sustainable and renewable technology, and special situation sub-teams to better source potential portfolio companies.
10
In addition, we have developed a proprietary and comprehensive SQL-based database system to track various aspects of our investment process including sourcing, originations, transaction monitoring and post-investment performance. This proprietary SQL system allows our origination team to maintain, cultivate and grow our industry relationships while providing our origination team with comprehensive details on companies in the technology-related industries and their financial sponsors.
If a prospective portfolio company generally meets certain underwriting criteria, we perform preliminary due diligence, which may include high level company and technology assessments, evaluation of its financial sponsors’ support, market analysis, competitive analysis, identifying key management, risk analysis and transaction size, pricing, return analysis and structure analysis. If the preliminary due diligence is satisfactory, and the origination team recommends moving forward, we then structure, negotiate and execute a non-binding term sheet with the potential portfolio company. Upon execution of a term sheet, the investment opportunity moves to the underwriting process to complete formal due diligence review and approval.
Underwriting
The underwriting review includes formal due diligence and approval of the proposed investment in the portfolio company.
Due Diligence. Our due diligence on a prospective investment is typically completed by two or more investment professionals whom we define as the underwriting team. The underwriting team for a proposed investment consists of the deal sponsor who typically possesses general industry knowledge and is responsible for originating and managing the transaction, other investment professional(s) who perform due diligence, credit and corporate financial analyses and, as needed, our legal professionals. To ensure consistent underwriting, we generally use our standardized due diligence methodologies, which include due diligence on financial performance and credit risk as well as an analysis of the operations and the legal and applicable regulatory framework of a prospective portfolio company. The members of the underwriting team work together to conduct due diligence and understand the relationships among the prospective portfolio company’s business plan, operations and financial performance.
As part of our evaluation of a proposed investment, the underwriting team prepares an investment memorandum for presentation to the investment committee. In preparing the investment memorandum, the underwriting team typically interviews select key management of the company and select financial sponsors and assembles information necessary to the investment decision. If and when appropriate, the investment professionals may also contact industry experts and customers, vendors or, in some cases, competitors of the company.
Approval Process. The sponsoring managing director or principal presents the investment memorandum to our investment committee for consideration. The approval of a majority of our investment committee and an affirmative vote by our Chief Executive Officer is required before we proceed with any investment. The investment committee members include our Chief Executive Officer, Chief Financial Officer, Chief Investment Officer, and two senior Credit Officers. The investment committee meets on an as-needed basis.
Documentation
Our legal department administers the documentation process for our investments. This department is responsible for documenting the transactions approved by our investment committee with a prospective portfolio company. This department negotiates loan documentation and, subject to appropriate approvals, final documents are prepared for execution by all parties. The legal department generally uses the services of external law firms to complete the necessary documentation.
Loan and Compliance Administration
Our investment committee, supported by our investment team, credit team, and finance department, administers loans and track covenant compliance, if applicable, of our investments and oversees periodic reviews of our critical functions to ensure adherence with our internal policies and procedures. After funding of a loan in accordance with the investment committee’s approval, the loan is recorded in our loan administration software and our SQL-based database system. The investment team, credit team, and finance department are responsible for ensuring timely interest and principal payments and collateral management as well as advising the investment committee on the financial performance and trends of each portfolio company, including any covenant violations that occur, to aid us in assessing the appropriate course of action for each portfolio company and evaluating overall portfolio quality. In addition, the investment team and credit team advise the investment committee and the Audit Committee of our Board of Directors, accordingly, regarding the credit and investment grading for each portfolio company as well as changes in the value of collateral that may occur.
11
The investment team and credit team monitor our portfolio companies in order to determine whether the companies are meeting our financing criteria and their respective business plans and also monitors the financial trends of each portfolio company from its monthly or quarterly financial statements to assess the appropriate course of action for each company and to evaluate overall portfolio quality. In addition, our management team closely monitors the status and performance of each individual company through our SQL-based database system and periodic contact with our portfolio companies’ management teams and their respective financial sponsors.
Credit and Investment Grading System. Our investment team and credit team use an investment grading system to characterize and monitor our outstanding loans. Our investment team and credit team monitors and, when appropriate, recommends changes to investment grading. Our investment committee reviews the recommendations and/or changes to the investment grading, which are submitted on a quarterly basis to the Audit Committee and our Board of Directors for approval.
From time to time, we will identify investments that require closer monitoring or become workout assets. We develop a workout strategy for workout assets and our investment committee monitors the progress against the strategy. We may incur losses from our investing activities, however, we work with our troubled portfolio companies in order to recover as much of our investments as is practicable, including possibly taking control of the portfolio company. There can be no assurance that principal will be recovered.
We use the following investment grading system approved by our Board of Directors:
|
|
Grade 1. |
Loans involve the least amount of risk in our portfolio. The borrower is performing above expectations, and the trends and risk profile is generally favorable. |
|
|
Grade 2. |
The borrower is performing as expected and the risk profile is neutral to favorable. All new loans are initially |
graded 2.
|
|
Grade 3. |
The borrower may be performing below expectations, and the loan’s risk has increased materially since origination. We increase procedures to monitor a borrower that may have limited amounts of cash remaining on the balance sheet, is approaching its next equity capital raise within the next three to six months, or if the estimated fair value of the enterprise may be lower than when the loan was originated. We will generally lower the loan grade to a grade 3 even if the company is performing in accordance to plan as it approaches the need to raise additional cash to fund its operations. Once the borrower closes its new equity capital raise, we may increase the loan grade back to grade 2 or maintain it at a grade 3 as the company continues to pursue its business plan. |
|
|
Grade 4. |
The borrower is performing materially below expectations, and the loan risk has substantially increased since origination. Loans graded 4 may experience some partial loss or full return of principal but are expected to realize some loss of interest which is not anticipated to be repaid in full, which, to the extent not already reflected, may require the fair value of the loan to be reduced to the amount we anticipate will be recovered. Grade 4 investments are closely monitored. |
|
|
Grade 5. |
The borrower is in workout, materially performing below expectations and a significant risk of principal loss is probable. Loans graded 5 will experience some partial principal loss or full loss of remaining principal outstanding is expected. Grade 5 loans will require the fair value of the loans be reduced to the amount, if any, we anticipate will be recovered. |
At December 31, 2018, our investments had a weighted average investment grading of 2.18.
Managerial Assistance
As a business development company, we are required to offer, and provide upon request, managerial assistance to our portfolio companies. This assistance could involve, among other things, monitoring the operations of our portfolio companies, participating in board and management meetings, consulting with and advising officers of portfolio companies and providing other organizational and financial guidance. We may, from time to time, receive fees for these services. In the event that such fees are received, they are incorporated into our operating income and are passed through to our stockholders, given the nature of our structure as an internally managed business development company. See “—Regulation—Significant Managerial Assistance” for additional information.
12
Our primary competitors provide financing to prospective portfolio companies and include non-bank financial institutions, federally or state chartered banks, venture debt funds, financial institutions, venture capital funds, private equity funds, investment funds and investment banks. Many of these entities have greater financial and managerial resources than we have, and the 1940 Act imposes certain regulatory restrictions on us as a business development company to which many of our competitors are not subject. However, we believe that few of our competitors possess the expertise to properly structure and price debt investments to venture capital-backed companies in technology-related industries. We believe that our specialization in financing technology-related companies will enable us to determine a range of potential values of intellectual property assets, evaluate the business prospects and operating characteristics of prospective portfolio companies and, as a result, identify investment opportunities that produce attractive risk-adjusted returns. For additional information concerning the competitive risks we face, see “Item 1A. Risk Factors—Risks Related to our Business Structure—We operate in a highly competitive market for investment opportunities, and we may not be able to compete effectively.”
BROKERAGE ALLOCATIONS AND OTHER PRACTICES
Because we generally acquire and dispose of our investments in privately negotiated transactions, we typically do not use brokers in the normal course of business. However, from time to time, we may work with brokers to sell positions we have acquired in the securities of publicly listed companies or to acquire positions (principally equity) in companies where we see a market opportunity to acquire such securities at attractive valuations. In cases where we do use a broker, we do not execute transactions through any particular broker or dealer, but will seek to obtain the best net results for the Company, taking into account such factors as price (including the applicable brokerage commission or dealer spread), size of order, difficulty of execution, and operational facilities of the firm and the firm’s risk and skill in positioning blocks of securities. While we generally seek reasonably competitive execution costs, we may not necessarily pay the lowest spread or commission available. Subject to applicable legal requirements, we may select a broker based partly upon brokerage or research services provided to us. In return for such services, we may pay a higher commission than other brokers would charge if we determine in good faith that such commission is reasonable in relation to the services provided.
EMPLOYEES
As of December 31, 2018, we had 69 employees, including approximately 36 investment and portfolio management professionals, all of whom have extensive experience working on financing transactions for technology-related companies.
REGULATION
The following discussion is a general summary of the material prohibitions and descriptions governing business development companies. It does not purport to be a complete description of all of the laws and regulations affecting business development companies.
A business development company primarily focuses on investing in or lending to private companies and making managerial assistance available to them, while providing its stockholders with the ability to retain the liquidity of a publicly-traded stock. The 1940 Act contains prohibitions and restrictions relating to transactions between business development companies and their directors and officers and principal underwriters and certain other related persons and requires that a majority of the directors be persons other than “interested persons,” as that term is defined in the 1940 Act. In addition, the 1940 Act provides that we may not change the nature of our business so as to cease to be, or to withdraw our election as, a business development company unless approved by a majority of our outstanding voting securities as defined in the 1940 Act. A majority of the outstanding voting securities of a company is defined under the 1940 Act as the lesser of: (i) 67% or more of such company’s shares present at a meeting if more than 50% of the outstanding shares of such company are present or represented by proxy, or (ii) more than 50% of the outstanding shares of such company.
13
Under the 1940 Act, a business development company may not acquire any asset other than assets of the type listed in Section 55(a) of the 1940 Act, which are referred to as qualifying assets, unless, at the time the acquisition is made, qualifying assets represent at least 70% of the company’s total assets. The principal categories of qualifying assets relevant to our proposed business are the following:
|
|
(1) |
Securities purchased in transactions not involving any public offering from the issuer of such securities, which issuer (subject to certain limited exceptions) is an eligible portfolio company, or from any person who is, or has been during the preceding 13 months, an affiliated person of an eligible portfolio company, or from any other person, subject to such rules as may be prescribed by the SEC. An eligible portfolio company is defined in the 1940 Act as any issuer which: |
|
|
(a) |
is organized under the laws of, and has its principal place of business in, the United States; |
|
|
(b) |
is not an investment company (other than a SBIC wholly owned by the business development company) or a company that would be an investment company but for certain exclusions under the 1940 Act; and |
|
|
(c) |
does not have any class of securities listed on a national securities exchange; or if it has securities listed on a national securities exchange such company has a market capitalization of less than $250 million; is controlled by the business development company and has an affiliate of a business development company on its Board of Directors; or meets such other criteria as may be established by the SEC. |
|
|
(2) |
Securities of any portfolio company which we control. |
|
|
(3) |
Securities purchased in a private transaction from a U.S. issuer that is not an investment company or from an affiliated person of the issuer, or in transactions incident thereto, if the issuer is in bankruptcy and subject to reorganization or if the issuer, immediately prior to the purchase of its securities was unable to meet its obligations as they came due without material assistance other than conventional lending or financing arrangements. |
|
|
(4) |
Securities of an eligible portfolio company purchased from any person in a private transaction if there is no ready market for such securities and we already own 60% of the outstanding equity of the eligible portfolio company. |
|
|
(5) |
Securities received in exchange for or distributed on or with respect to securities described in (1) through (4) above, or pursuant to the exercise of warrants or rights relating to such securities. |
|
|
(6) |
Cash, cash equivalents, U.S. Government securities or high-quality debt securities maturing in one year or less from the time of investment. |
Control, as defined by the 1940 Act, is presumed to exist where a business development company beneficially owns more than 25% of the outstanding voting securities of the portfolio company or has greater than 50% representation on its board.
We do not intend to acquire securities issued by any investment company, including other business development companies, that exceed the limits imposed by the 1940 Act. Under these limits, we generally cannot acquire more than 3% of the voting stock of any investment company (as defined in the 1940 Act), invest more than 5% of the value of our total assets in the securities of one such investment company or invest more than 10% of the value of our total assets in the securities of such other investment companies in the aggregate. With regard to that portion of our portfolio invested in securities issued by investment companies, it should be noted that such investments might subject our stockholders to additional expenses.
Significant Managerial Assistance
Business development companies generally must offer to make available to the issuer of the securities significant managerial assistance, except in circumstances where either (i) the business development company controls such issuer of securities or (ii) the business development company purchases such securities in conjunction with one or more other persons acting together and one of the other persons in the group makes available such managerial assistance. Making available significant managerial assistance means, among other things, any arrangement whereby the business development company, through its directors, officers or employees, offers to provide and, if accepted, does so provide, significant guidance and counsel concerning the management, operations or business objectives and policies of a portfolio company through monitoring of portfolio company operations, selective participation in board and management meetings, consulting with and advising a portfolio company’s officers or other organizational or financial guidance.
14
Pending investment in other types of qualifying assets, as described above, our investments may consist of cash, cash equivalents, U.S. government securities or high-quality debt securities maturing in one year or less from the time of investment, which we refer to, collectively, as temporary investments, so that 70% of our assets are qualifying assets. We may invest in U.S. Treasury bills or in repurchase agreements, provided that such agreements are fully collateralized by cash or securities issued by the U.S. government or its agencies. A repurchase agreement involves the purchase by an investor, such as us, of a specified security and the simultaneous agreement by the seller to repurchase it at an agreed upon future date and at a price which is greater than the purchase price by an amount that reflects an agreed-upon interest rate. There is no percentage restriction on the proportion of our assets that may be invested in such repurchase agreements. However, if more than 25% of our total assets constitute repurchase agreements from a single counterparty, we generally would not meet the diversification tests imposed on us by the Code in order to qualify as a RIC for federal income tax purposes. Thus, we do not intend to enter into repurchase agreements with a single counterparty in excess of this limit. We will monitor the creditworthiness of the counterparties with which we enter into repurchase agreement transactions.
Warrants and Options
Under the 1940 Act, a business development company is subject to restrictions on the amount of warrants, options, restricted stock or rights to purchase shares of capital stock that it may have outstanding at any time. In particular, the amount of capital stock that would result from the conversion or exercise of all outstanding warrants, options or other rights to purchase capital stock cannot exceed 25% of the business development company’s total outstanding shares of capital stock. This amount is reduced to 20% of the business development company’s total outstanding shares of capital stock if the amount of warrants, options or rights issued pursuant to an executive compensation plan would exceed 15% of the business development company’s total outstanding shares of capital stock. We have received exemptive relief from the SEC permitting us to issue stock options and restricted stock to our employees and directors subject to the above conditions, among others. For a discussion regarding the conditions of this exemptive relief, see “—Exemptive Relief” below and Note 7 to our consolidated financial statements.
Reduced Asset Coverage Requirements
The Small Business Credit Availability Act, or the SBCAA, which was signed into law in March 2018, decreased the minimum asset coverage ratio in Section 61(a) of the 1940 Act for business development companies from 200% to 150% (subject to either stockholder approval or approval of both a majority of the board of directors and a majority of directors who are not interested persons). On September 4, 2018 and December 6, 2018, our Board of Directors, including a “required majority” (as such term is defined in Section 57(o) of the 1940 Act) and our stockholders, respectively, approved the application to us of the 150% minimum asset coverage ratio set forth in Section 61(a)(2) of the 1940 Act. As a result, effective December 7, 2018, the asset coverage ratio under the 1940 Act applicable to us decreased from 200% to 150%, permitting us to incur additional leverage.
Senior Securities; Coverage Ratio
We will be permitted, under specified conditions, to issue multiple classes of indebtedness and one class of stock senior to our common stock if our asset coverage, as defined in the 1940 Act, is at least equal to 150% immediately after each such issuance. In addition, we may not be permitted to declare any cash dividend distribution on our outstanding common shares, or purchase any such shares, unless, at the time of such declaration or purchase, we have asset coverage of at least 150% after deducting the amount of such distribution or purchase price. We may also borrow amounts up to 5% of the value of our total assets for temporary or emergency purposes. For a discussion of the risks associated with the resulting leverage, see “Item 1A. Risk Factors—Risks Related to Our Business Structure—Because we have substantial indebtedness, there could be increased risk in investing in our company.”
On April 5, 2007, we received approval from the SEC on our request for exemptive relief that permits us to exclude the indebtedness of our wholly-owned subsidiaries that are SBICs from the 150% asset coverage requirement applicable to us.
Capital Structure
We are not generally able to issue and sell our common stock at a price below NAV per share. We may, however, sell our common stock, at a price below the current NAV of the common stock, or sell warrants, options or other rights to acquire such common stock, at a price below the current NAV of the common stock if our Board of Directors determines that such sale is in the best interests of us and our stockholders have approved the practice of making such sales.
In connection with the receipt of such stockholder approval, we will limit the number of shares that we issue at a price below NAV pursuant to this authorization so that the aggregate dilutive effect on our then outstanding shares will not exceed 20%. Our Board of Directors, subject to its fiduciary duties and regulatory requirements, has the discretion to determine the amount of the discount, and as a result, the discount could be up to 100% of NAV per share.
15
We have adopted and will maintain a code of ethics that establishes procedures for personal investments and restricts certain personal securities transactions. Personnel subject to the code may invest in securities for their personal investment accounts, including securities that may be purchased or held by us, so long as such investments are made in accordance with the code’s requirements. Our code of ethics will generally not permit investments by our employees in securities that may be purchased or held by us. We may be prohibited under the 1940 Act from conducting certain transactions with our affiliates without the prior approval of our directors who are not interested persons and, in some cases, the prior approval of the SEC.
Our current code of ethics is posted on our website at www.htgc.com. In addition, the code of ethics is available on the EDGAR Database on the SEC’s Internet site at http://www.sec.gov. You may also obtain copies of the code of ethics, after paying a duplicating fee, by electronic request at the following e-mail address: publicinfo@sec.gov.
Privacy Principles
We are committed to maintaining the privacy of our stockholders and safeguarding their non-public personal information. The following information is provided to help you understand what personal information we collect, how we protect that information and why, in certain cases, we may share information with select other parties.
Generally, we do not receive any non-public personal information relating to our stockholders, although certain non-public personal information of our stockholders may become available to us. We do not disclose any non-public personal information about our stockholders or former stockholders, except as permitted by law or as is necessary in order to service stockholder accounts (for example, to a transfer agent).
We restrict access to non-public personal information about our stockholders to our employees with a legitimate business need for the information. We maintain physical, electronic and procedural safeguards designed to protect the non-public personal information of our stockholders.
Proxy Voting Policies and Procedures
We vote proxies relating to our portfolio securities in the best interest of our stockholders. Our proxy voting decisions are made by members of the Investment Team, who review on a case- by-case basis each proposal submitted to a stockholder vote to determine its impact on the portfolio securities held by us. Although we generally vote against proposals that may have a negative impact on our portfolio securities, we may vote for such a proposal if there exists compelling long-term reasons to do so. We generally do not believe it is necessary to engage the services of an independent third party to assist in issue analysis and vote recommendation for proxy proposals.
To ensure that our vote is not the product of a conflict of interest, we require that: (i) anyone involved in the decision making process disclose to our Chief Compliance Officer any potential conflict that he or she is aware of and any contact that he or she has had with any interested party regarding a proxy vote; and (ii) employees involved in the decision making process or vote administration are prohibited from revealing how we intend to vote on a proposal in order to reduce any attempted influence from interested parties.
Exemptive Relief
On June 21, 2005, we filed a request with the SEC for exemptive relief to allow us to take certain actions that would otherwise be prohibited by the 1940 Act, as applicable to business development companies. Specifically, we requested that the SEC permit us to issue stock options to our non-employee directors as contemplated by Section 61(a)(3)(B)(i)(II) of the 1940 Act. On February 15, 2007, we received approval from the SEC on this exemptive request. In addition, in June 2007, we filed an amendment to the February 2007 order to adjust the number of shares issued to the non-employee directors. On October 10, 2007, we received approval from the SEC on this amended exemptive request.
On April 5, 2007, we received approval from the SEC on our request for exemptive relief that permits us to exclude the indebtedness of our wholly-owned subsidiaries that are SBICs from the asset coverage requirement applicable to us under the 1940 Act.
16
On May 23, 2007, we received approval from the SEC on our request for exemptive relief that permits us to issue restricted stock to our employees, officers and directors. On June 21, 2007, our shareholders approved amendments to the 2004 Equity Incentive Plan, or the 2004 Plan, and 2006 Non-Employee Director Plan, or the 2006 Plan and, together with the 2004 Plan, the Plans, permitting such restricted grants. On June 21, 2017, the 2006 Plan expired in accordance with its terms and no additional awards may be granted under the 2006 Plan. On May 13, 2018, the Board of Directors further amended and restated the 2004 Plan and renamed it the Hercules Capital, Inc. Amended and Restated 2018 Equity Incentive Plan, or the 2018 Equity Incentive Plan. On May 13, 2018, the Board of Directors adopted the Hercules Capital, Inc. 2018 Non-employee Director Plan, or the Director Plan. The 2018 Equity Incentive Plan and the Director Plan were each approved by stockholders on June 28, 2018.
On May 29, 2018, we filed an exemptive application with the SEC and an amendment to the exemptive application on September 27, 2018, with respect to the 2018 Equity Incentive Plan and the Director Plan for an exemptive order from certain provisions of the 1940 Act. On January 30, 2019, we received approval from the SEC on our request for exemptive relief that permits us to issue restricted stock to non-employee directors under the Director Plan and restricted stock and restricted stock units to certain of our employees, officers, and directors (excluding non-employee directors) under the 2018 Equity Incentive Plan. The exemptive order also (i) allows participants in the Director Plan and the 2018 Equity Incentive Plan to elect to have us withhold shares of our common stock to pay for the exercise price and applicable taxes with respect to an option exercise, or net issuance exercise, and (ii) permit the holders of restricted stock to elect to have us withhold shares of our stock to pay the applicable taxes due on restricted stock at the time of vesting. Each individual would be able to make a cash payment at the time of option exercise or to pay taxes on restricted stock.
Other
We may be periodically examined by the SEC for compliance with the Exchange Act and the 1940 Act.
We are required to provide and maintain a bond issued by a reputable fidelity insurance company to protect us against larceny and embezzlement. Furthermore, as a business development company, we are prohibited from protecting any director or officer against any liability to our stockholders arising from willful misfeasance, bad faith, gross negligence or reckless disregard of the duties involved in the conduct of such person’s office.
We are required to adopt and implement written policies and procedures reasonably designed to prevent violation of the federal securities laws, review these policies and procedures annually for their adequacy and the effectiveness of their implementation. Our Chief Compliance Officer is responsible for administering these policies and procedures.
Small Business Administration Regulations
We make investments in qualifying small businesses through our wholly-owned SBIC subsidiary, HT III. With our net investment of $74.5 million in HT III, we have the capacity to issue $149.0 million of SBA guaranteed debentures, subject to SBA approval. At December 31, 2018, we have issued $149.0 million in SBA guaranteed debentures in HT III. On July 13, 2018, the Company completed repayment of the remaining outstanding Hercules Technology II, L.P., or HT II, debentures and subsequently surrendered the SBA license with respect to HT II.
We intend to seek an additional SBIC license to ensure continued access to the maximum statutory limit of SBA guaranteed debentures under the SBIC program. We have formed Hercules Technology IV, L.P., or HT IV, for that purpose. On September 6, 2018, we received a “green light” or “go forth” letter approval from the SBA to finalize our application process to obtain our third license. There can be no assurance of when or if we will receive SBA approval of our HT IV application.
SBICs are designed to stimulate the flow of private equity capital to eligible small businesses. Under present SBA regulations, eligible small businesses include businesses that have a tangible net worth not exceeding $19.5 million and have average annual fully taxed net income not exceeding $6.5 million for the two most recent fiscal years. In addition, SBICs must devote 25.0% of its investment activity to “smaller” enterprises as defined by the SBA. A smaller enterprise is one that has a tangible net worth not exceeding $6.0 million and has average annual fully taxed net income not exceeding $2.0 million for the two most recent fiscal years. SBA regulations also provide alternative size standard criteria to determine eligibility, which depend on the industry in which the business is engaged and are based on such factors as the number of employees and gross sales. According to SBA regulations, SBICs may make long-term loans to small businesses, invest in the equity securities of such businesses and provide them with consulting and advisory services. Through our wholly-owned subsidiary, HT III, we plan to provide long-term loans to qualifying small businesses, and in connection therewith, make equity investments.
17
HT III is periodically examined and audited by the SBA’s staff to determine their compliance with SBA regulations. If HT III fails to comply with applicable SBA regulations, the SBA could, depending on the severity of the violation, limit or prohibit HT III’s use of debentures, declare outstanding debentures immediately due and payable, and/or limit HT III from making new investments. In addition, HT III may also be limited in its ability to make distributions to us if it does not have sufficient capital in accordance with SBA regulations. Such actions by the SBA would, in turn, negatively impact us because HT III is our wholly owned subsidiary. HT III was in compliance with the terms of the SBIC’s leverage as of December 31, 2018 as a result of having sufficient capital as defined under the SBA regulations.
HT III holds approximately $307.5 million in assets and accounted for approximately 14.3% of our total assets prior to consolidation at December 31, 2018.
The SBA restricts the ability of SBICs to repurchase their capital stock. SBA regulations also include restrictions on a “change of control” or transfer of an SBIC and require that SBICs invest idle funds in accordance with SBA regulations. In addition, HT III may also be limited in its ability to make distributions to us if it does not have sufficient capital and/or distributed earnings, in accordance with SBA regulations.
Our SBIC subsidiary is subject to regulation and oversight by the SBA, including requirements with respect to maintaining certain minimum financial ratios and other covenants. Receipt of an SBIC license does not assure that our SBIC subsidiaries will receive SBA guaranteed debenture funding, which is dependent upon our SBIC subsidiaries continuing to be in compliance with SBA regulations and policies. The SBA, as a creditor, will have a superior claim to our SBIC subsidiaries’ assets over our stockholders in the event we liquidate our SBIC subsidiaries or the SBA exercises its remedies under the SBA-guaranteed debentures issued by our SBIC subsidiaries upon an event of default.
CERTAIN UNITED STATES FEDERAL INCOME TAX CONSIDERATIONS
The following discussion is a general summary of certain material U.S. federal income tax considerations relating to our qualification and taxation as a RIC and the acquisition, ownership and disposition of our preferred stock or common stock, but does not purport to be a complete description of the income tax considerations relating thereto. Except as otherwise noted, this discussion assumes you are a taxable U.S. person (as defined for U.S. federal income tax purposes) and that you hold your shares of our stock as capital assets for U.S. federal income tax purposes (generally, assets held for investment). This discussion is based upon current provisions of the Code, the regulations promulgated thereunder and judicial and administrative authorities, all of which are subject to change or differing interpretations by the courts or the Internal Revenue Service, or the IRS, possibly with retroactive effect. No attempt is made to present a detailed explanation of all U.S. federal income tax concerns affecting us and our shareholders (including shareholders subject to special rules under U.S. federal income tax law).
The discussions set forth herein do not constitute tax advice. We have not sought and will not seek any ruling from the IRS regarding any matters discussed herein. No assurance can be given that the IRS would not assert, or that a court would not sustain, a position contrary to those set forth below. This summary does not discuss any aspects of foreign, state or local tax. Prospective investors must consult their own tax advisers as to the U.S. federal income tax consequences (including the alternative minimum tax consequences) of acquiring, holding and disposing of shares of our stock, as well as the effects of state, local and non-U.S. tax laws.
Election to be Subject to Tax as a RIC
Through December 31, 2005, we were subject to U.S. federal income tax as an ordinary corporation under Subchapter C of the Code. Effective beginning on January 1, 2006 we met the criteria specified below to qualify as a RIC, and elected to be treated as a RIC under Subchapter M of the Code with the filing of our U.S. federal income tax return for 2006. To qualify for treatment as a RIC we must, among other things, meet certain source of income and asset diversification requirements (as described below). In addition, we must distribute to our stockholders, in respect of each taxable year, dividends for federal income tax purposes of an amount generally at least equal to 90% of our “investment company taxable income,” which is generally equal to the sum of our net ordinary income plus the excess of our realized net short-term capital gains over our realized net long-term capital losses, determined without regard to any deduction for distributions paid, or the “Annual Distribution Requirement.” Upon satisfying these requirements in respect of a taxable year, we generally will not be subject to corporate taxes on any income we distribute to our stockholders as dividends for federal income tax purposes, which will allow us to reduce or eliminate our liability for corporate-level income tax.
On December 31, 2005, immediately before the effective date of our RIC election, we held assets with “built-in gains,” which are assets whose fair market value as of the effective date of the election exceeded their tax basis as of such date. We elected to recognize all of our net built-in gains on such assets at the time of the conversion and paid tax on the built-in gain with the filing of our 2005 U.S. federal income tax return. In making this election, we marked our portfolio investments and other assets to market at the time of our RIC election and paid approximately $294,000 in income tax on the resulting gains.
18
Taxation as a Regulated Investment Company
For any taxable year in which we:
|
|
• |
qualify as a RIC; and |
|
|
• |
distribute dividends for federal income tax purposes to our shareholders of an amount at least equal to the Annual Distribution Requirement; |
We generally will not be subject to U.S. federal income tax on the portion of our investment company taxable income and net capital gain (i.e., net realized long-term capital gains in excess of net realized short-term capital losses) we distribute (or are deemed to distribute) as dividends for U.S. federal income tax purposes to stockholders with respect to that taxable year.
As described above, we made the election to recognize built-in gains as of the effective date of our election to be treated as a RIC and therefore were not subject to built-in gains tax when we sold those assets. However, if we subsequently acquire built-in gain assets from a C corporation in a carryover basis transaction, then we may be subject to tax on the gains recognized by us on dispositions of such assets unless we make a special election to pay corporate-level tax on such built-in gain at the time the assets are acquired. We will be subject to U.S. federal income tax at the regular corporate rates on any income or capital gains not distributed (or deemed distributed) as dividends for U.S. federal income tax purposes to our stockholders.
In order to qualify as a RIC for federal income tax purposes and obtain the tax benefits of RIC status, in addition to satisfying the Annual Distribution Requirement, we must, among other things:
|
|
• |
have in effect at all times during each taxable year an election to be regulated as a business development company under the 1940 Act; |
|
|
• |
derive in each taxable year at least 90% of our gross income from (a) dividends, interest, payments with respect to certain securities loans, gains from the sale of stock or other securities, or other income derived with respect to our business of investing in such stock or securities and (b) net income derived from an interest in a “qualified publicly traded partnership”, or the 90% Income Test; |
|
|
• |
diversify our holdings so that at the end of each quarter of the taxable year: |
|
|
o |
at the close of each quarter of each taxable year, at least 50% of the value of our assets consists of cash, cash equivalents, U.S. government securities, securities of other RICs, and other securities if such other securities of any one issuer do not represent more than 5% of the value of our assets or more than 10% of the outstanding voting securities of such issuer; and |
|
|
o |
at the close of each quarter of each taxable year, no more than 25% of the value of our assets is invested in (i) securities (other than U.S. government securities or securities of other RICs) of one issuer, (ii) securities of two or more issuers that are controlled, as determined under applicable tax rules, by us and that are engaged in the same or similar or related trades or businesses or (iii) securities of one or more “qualified publicly traded partnerships”, or the Diversification Tests. |
We may invest in partnerships which may result in our being subject to state, local or foreign income, franchise or other tax liabilities. In addition, some of the income and fees that we may recognize will not be qualifying income under the 90% Income Test. In order to mitigate the risk that such income and fees would disqualify us as a RIC as a result of a failure to satisfy the 90% Income Test, we may be required to recognize such income and fees indirectly through one or more entities classified as corporations for U.S. federal income tax purposes. Such corporations generally will be subject to corporate income taxes on their earnings, which ultimately will reduce our return on such income and fees.
As a RIC, we will be subject to a 4% nondeductible U.S. federal excise tax on certain undistributed income and gains unless we make distributions treated as dividends for U.S. federal income tax purposes in a timely manner to our stockholders in respect of each calendar year of an amount at least equal to the sum of (1) 98% of our ordinary income (taking into account certain deferrals and elections) for each calendar year, (2) 98.2% of our capital gain net income (adjusted for certain ordinary losses) for the 1-year period ending October 31 of each such calendar year and (3) any ordinary income and capital gain net income realized, but not distributed, in preceding calendar years, or the Excise Tax Avoidance Requirement. We are not subject to this excise tax on any amount on which we incurred U.S. federal corporate income tax (such as the tax imposed on a RIC’s retained net capital gains).
Depending on the level of taxable income earned in a taxable year, we may choose to carry over taxable income in excess of current taxable year distributions treated as dividends for U.S. federal income tax purposes from such taxable income into the next taxable year and incur a 4% excise tax on such taxable income, as required. The maximum amount of excess taxable income that may be carried over for distribution in the next taxable year under the Code is the total amount of distributions treated as dividends for U.S. federal income tax purposes paid in the following taxable year, subject to certain declaration and payment guidelines. To the extent we
19
choose to carry over taxable income into the next taxable year, distributions declared and paid by us in a taxable year may differ from our taxable income for that taxable year as such distributions may include the distribution of current taxable year taxable income, the distribution of prior taxable year taxable income carried over into and distributed in the current taxable year, or returns of capital.
Under applicable Treasury regulations and other administrative guidance issued by the IRS, we are permitted to treat certain distributions payable in our stock as taxable distributions that will satisfy the Annual Distribution Requirement as well as the Excise Tax Avoidance Requirement provided that shareholders have the opportunity to elect to receive the distribution in cash. Taxable stockholders receiving such distributions will be required to include the full amount of the such distributions as ordinary income (or as long-term capital gain to the extent such distribution is properly reported as a capital gain dividend) to the extent of our current and accumulated earnings and profits for United States federal income tax purposes. As a result, a U.S. stockholder may be subject to tax with respect to such distributions in excess of any cash received. If a U.S. stockholder sells the stock it receives as a distribution in order to pay this tax, the sales proceeds may be less than the amount included in income with respect to the distribution, depending on the market price of our stock at the time of the sale. Furthermore, with respect to non-U.S. stockholders, we may be required to withhold U.S. tax with respect to such distributions, including in respect of all or a portion of such distribution that is payable in stock. In addition, if a significant number of our stockholders determine to sell shares of our stock in order to pay taxes owed on distributions, then such sales may put downward pressure on the trading price of our stock. We may in the future determine to make taxable distributions that are payable in part in our common stock.
We may be required to recognize taxable income in circumstances in which we do not receive a corresponding payment in cash. For example, if we hold debt obligations that are treated under applicable tax rules as having OID (such as debt instruments with PIK interest provisions or, in certain cases, increasing interest rates or debt instruments that were issued with warrants), we must include in income each taxable year a portion of the OID that accrues over the life of the obligation, regardless of whether cash representing such income is received by us in the same taxable year. Because any OID accrued is generally required to be included in our investment company taxable income for the taxable year of accrual, we may be required to make a distribution to our stockholders in order to satisfy the Annual Distribution Requirement and the Excise Tax Avoidance Requirement, even though we will not have received any corresponding cash amount.
Gain or loss realized by us from the sale or exchange of warrants acquired by us as well as any loss attributable to the lapse of such warrants generally will be treated as capital gain or loss. Such gain or loss generally will be long-term or short-term, depending on how long we held a particular warrant.
We are authorized to borrow funds and to sell assets in order to satisfy the Annual Distribution Requirement and the Excise Tax Avoidance Requirement, or collectively, the Distribution Requirements. However, under the 1940 Act, we are not permitted to make distributions to our stockholders while our debt obligations and other senior securities are outstanding unless certain “asset coverage” tests are met. See “Regulation—Senior Securities; Coverage Ratio.” We may be restricted from making distributions under the terms of our debt obligations themselves unless certain conditions are satisfied. Moreover, our ability to dispose of assets to meet the Distribution Requirements may be limited by (1) the illiquid nature of our portfolio, or (2) other requirements relating to our status as a RIC, including the Diversification Tests. If we dispose of assets in order to meet the Distribution Requirements, we may make such dispositions at times that, from an investment standpoint, are not advantageous. If we are prohibited from making distributions or are unable to obtain cash from other sources to make the distributions, we may fail to be subject to tax as a RIC, which would result in us becoming subject to corporate-level income taxes.
In addition, we will be partially dependent on our SBIC subsidiaries for cash distributions to enable us to meet the RIC Distribution Requirements. Our SBIC subsidiaries may be limited by the Small Business Investment Act of 1958, as amended, and SBA regulations governing SBICs, from making certain distributions to us that may be necessary to maintain our status as a RIC. We may have to request a waiver of the SBA’s restrictions for our SBIC subsidiaries to make certain distributions to maintain our RIC status. We cannot assure you that the SBA will grant such waiver. If our SBIC subsidiaries are unable to obtain a waiver, compliance with the SBA regulations may cause us to fail to be subject to tax as a RIC, which would result in us becoming subject to corporate-level income taxes.
Certain of our investment practices are subject to special and complex U.S. federal income tax provisions that may, among other things, (i) convert distributions that would otherwise constitute qualified dividend income into ordinary income, (ii) treat distributions that would otherwise be eligible for deductions available to certain U.S. corporations under the Code as ineligible for such treatment, (iii) disallow, suspend or otherwise limit the allowance of certain losses or deductions, (iv) convert long-term capital gains into short-term capital gains or ordinary income, (v) convert short-term capital losses into long-term capital losses, (vi) convert an ordinary loss or deduction into a capital loss (the deductibility of which is more limited), (vii) cause us to recognize income or gain without a corresponding receipt of cash, (viii) adversely alter the characterization of certain complex financial transactions, and (ix) produce gross income that will not constitute qualifying gross income for purposes of the 90% Income Test. These rules also could affect the amount, timing and character of distributions to stockholders.
20
A RIC is limited in its ability to deduct expenses in excess of its “investment company taxable income.” If our otherwise deductible expenses in a given taxable year exceed our ordinary taxable gross income (e.g., as the result of large amounts of equity-based compensation), we would incur a net operating loss for that taxable year. However, a RIC is not permitted to carry back or carry forward net operating losses, respectively, to prior and subsequent taxable years, and such net operating losses do not pass through to the RIC’s stockholders. In addition, deductible expenses can be used only to offset investment company taxable income, not net capital gain. A RIC may not use any net capital losses (that is, realized capital losses in excess of realized capital gains) to offset the RIC’s investment company taxable income, but may carry forward such net capital losses, and generally use them to offset capital gains indefinitely. Due to these limits on the deductibility of expenses and net capital losses, we may for tax purposes have aggregate taxable income for several taxable years that we are required to distribute and that is taxable to our stockholders even if such taxable income is greater than the aggregate net income we actually earned during those taxable years. Such required distributions may be made from our cash assets or by liquidation of investments, if necessary. We may realize gains or losses from such liquidations. In the event we realize net capital gains from such transactions, you may receive a larger capital gain distribution than you would have received in the absence of such transactions.
Investment income received from sources within foreign countries, or capital gains earned by investing in securities of foreign issuers, may be subject to foreign income taxes withheld at the source. In this regard, withholding tax rates in countries with which the United States does not have a tax treaty are often as high as 35% or more. The United States has entered into tax treaties with many foreign countries that may entitle us to a reduced rate of tax or exemption from tax on this related income and gains. The effective rate of foreign tax cannot be determined at this time since the amount of our assets to be invested within various countries is not now known. We do not anticipate being eligible for the special election that allows a RIC to treat foreign income taxes paid by such RIC as having been paid by its shareholders.
If we acquire the equity securities of certain foreign corporations that earn at least 75% of their annual gross income from passive sources (such as interest, dividends, rents, royalties or capital gain) or hold at least 50% of their total assets in investments producing such passive income, or PFICs, we could be subject to federal income tax and additional interest charges on “excess distributions” received from such companies or gain from the sale of stock in such companies, even if all income or gain actually received by us is timely distributed to our shareholders to the extent that such income or gain is attributable to our ownership of PFIC stock in a prior taxable year. We would not be able to pass through to our shareholders any credit or deduction for such a tax. Certain elections may, if available, ameliorate these adverse tax consequences, but any such election could require us to recognize taxable income or gain without the concurrent receipt of cash. We intend to limit and/or manage our holdings in PFICs to minimize our liability for any such taxes and related interest charges.
If we hold greater than 10% of the interests treated as equity for U.S. federal income tax purposes in a foreign corporation that is treated as a controlled foreign corporation, or CFC, we may be treated as receiving a deemed distribution (taxable as ordinary income) each taxable year from such foreign corporation in an amount equal to our pro rata share of the corporation’s income for such taxable year (including both ordinary earnings and capital gains), whether or not the corporation makes an actual distribution during such taxable year. We would be required to include the amount of a deemed distribution from a CFC when computing our investment company taxable income as well as in determining whether we satisfy the distribution requirements applicable to RICs, even to the extent the amount of our income deemed recognized from the CFC exceeds the amount of any actual distributions from the CFC and our proceeds from any sales or other dispositions of CFC stock during a taxable year. In general, a foreign corporation will be considered a CFC if greater than 50% of the shares of the corporation, measured by reference to combined voting power or value, is owned (directly, indirectly or by attribution) by U.S. Shareholders. A “U.S. Shareholder,” for this purpose, is any U.S. person that possesses (actually or constructively) 10% or more of the combined voting power or value of all classes of shares of a foreign corporation. Furthermore, under recently proposed Treasury Regulations, certain income derived by us from a CFC would generally constitute qualifying income for purposes of determining our ability to be subject to tax as a RIC only to the extent the CFC makes distributions of that income to us in the same year of the CFC in which we are treated as having received a deemed distribution of such income. As such, we may limit and/or manage our holdings in issuers that could be treated as CFCs in order to limit our tax liability or maximize our after-tax return from these investments.
Our functional currency, for U.S. federal income tax purposes, is the U.S. dollar. Under the Code, foreign exchange gains and losses realized by us in connection with certain transactions involving foreign currencies, or payables or receivables denominated in a foreign currency, as well as certain non-U.S. dollar denominated debt securities, certain foreign currency futures contracts, foreign currency option contracts, foreign currency forward contracts, and similar financial instruments are subject to Code provisions that generally treat such gains and losses as ordinary income and losses and may affect the amount, timing and character of distributions to our stockholders. Any such transactions that are not directly related to our investment in securities (possibly including speculative currency positions or currency derivatives not used for hedging purposes) also could, under future Treasury regulations, produce income not among the types of “qualifying income” from which a RIC must derive at least 90% of its annual gross income.
21
Failure to Qualify as a Regulated Investment Company
If we fail to satisfy the 90% Income Test or the Diversification Tests for any taxable year, we may nevertheless continue to qualify as a RIC for such taxable year if certain relief provisions are applicable (which may, among other things, require us to pay certain corporate-level federal taxes or to dispose of certain assets).
If we were unable to qualify for treatment as a RIC and the foregoing relief provisions are not applicable, we would be subject to tax on all of our taxable income at regular corporate rates. We would not be able to deduct distributions to stockholders, nor would they be required to be made. Such distributions would be taxable to our stockholders and provided certain holding period and other requirements were met, could qualify for treatment as “qualified dividend income” eligible for the 20% maximum U.S. federal income tax rate if earned by certain U.S. resident non-corporate stockholders to the extent of our current and accumulated earnings and profits. Subject to certain limitations under the Code, corporate distributions generally would be eligible for the dividends-received deduction with respect to distributions current and accumulated earnings and profits if earned by certain U.S. resident corporate stockholders. Distributions in excess of our current and accumulated earnings and profits would be treated first as a return of capital to the extent of the stockholder’s tax basis, and any remaining distributions would be treated as a capital gain. To requalify as a RIC in a subsequent taxable year, we would be required to satisfy the RIC qualification requirements for that taxable year and dispose of any earnings and profits from any taxable year in which we failed to qualify as a RIC. Subject to a limited exception applicable to a corporation that qualified as a RIC under Subchapter M of the Code for at least one taxable year prior to disqualification and that requalify as a RIC no later than the second taxable year following the nonqualifying taxable year, we also could be subject to tax on any unrealized net built-in gains in the assets held by us during the period in which we failed to qualify as a RIC that are recognized within the subsequent five taxable years, unless we made a special election to incur a corporate-level income tax on such built-in gain at the time of our requalification as a RIC.
DETERMINATION OF NET ASSET VALUE
We determine the NAV per share of our common stock quarterly. The NAV per share is equal to the value of our total assets minus liabilities and any preferred stock outstanding divided by the total number of shares of common stock outstanding. As of the date of this report, we do not have any preferred stock outstanding.
At December 31, 2018, approximately 96.7% of our total assets represented investments in portfolio companies whose fair value is determined in good faith by the Board of Directors. Value, as defined in Section 2(a)(41) of the 1940 Act, is (i) the market price for those securities for which a market quotation is readily available and (ii) for all other securities and assets, fair value is as determined in good faith by the Board of Directors. Our investments are carried at fair value in accordance with the 1940 Act and ASC Topic 946 and measured in accordance with ASC Topic 820, Fair Value Measurements and Disclosures. Our debt securities are primarily invested in venture capital-backed companies in technology-related industries including technology, drug discovery and development, biotechnology, life sciences, healthcare, and sustainable and renewable technology at all stages of development. Given the nature of lending to these types of businesses, substantially all of our investments in these portfolio companies are considered Level 3 assets under ASC Topic 820 because there is no known or accessible market or market indexes for these investment securities to be traded or exchanged. As such, we value substantially all of our investments at fair value as determined in good faith pursuant to a consistent valuation policy by our Board of Directors in accordance with the provisions of ASC Topic 820 and the 1940 Act. Due to the inherent uncertainty in determining the fair value of investments that do not have a readily available market value, the fair value of our investments determined in good faith by our Board of Directors may differ significantly from the value that would have been used had a readily available market existed for such investments, and the differences could be material.
We may from time to time engage one or more independent valuation firms to provide us with valuation assistance with respect to certain of our portfolio investments. We engage independent valuation firms on a discretionary basis. Specifically, on a quarterly basis, we will identify portfolio investments with respect to which an independent valuation firm will assist in valuing. We select these portfolio investments based on a number of factors, including, but not limited to, the potential for material fluctuations in valuation results, credit quality and the time lapse since the last valuation of the portfolio investment by an independent valuation firm.
We intend to continue to engage an independent valuation firm to provide us with assistance regarding our determination of the fair value of selected portfolio investments each quarter unless directed by the Board of Directors to cancel such valuation services. The scope of the services rendered by an independent valuation firm is at the discretion of the Board of Directors. Our Board of Directors is ultimately, and solely, responsible for determining the fair value of our investments in good faith.
With respect to investments for which market quotations are not readily available or when such market quotations are deemed not to represent fair value, our Board of Directors has approved a multi-step valuation process each quarter, as described below:
(1) our quarterly valuation process begins with each portfolio company being initially valued by the investment professionals responsible for the portfolio investment;
22
(2) preliminary valuation conclusions are then documented and business-based assumptions are discussed with our investment committee;
(3) the Audit Committee of the Board of Directors reviews the preliminary valuation of the investments in the portfolio as provided by the investment committee, which incorporates the results of the independent valuation firm as appropriate; and
(4) the Board of Directors, upon the recommendation of the Audit Committee, discusses valuations and determines the fair value of each investment in our portfolio in good faith based on the input of, where applicable, the respective independent valuation firm and the investment committee.
ASC Topic 820 establishes a framework for measuring the fair value of assets and liabilities and outlines a fair value hierarchy which prioritizes the inputs used to measure fair value and the effect of fair value measures on earnings. ASC Topic 820 also requires disclosure for fair value measurements based on the level within the hierarchy of the information used in the valuation. ASC Topic 820 applies whenever other standards require (or permit) assets or liabilities to be measured at fair value. ASC Topic 820 defines fair value as the price that would be received to sell an asset or paid to transfer a liability in an orderly transaction between market participants at the measurement date.
We have categorized all investments recorded at fair value in accordance with ASC Topic 820 based upon the level of judgment associated with the inputs used to measure their fair value. Hierarchical levels, defined by ASC Topic 820 and directly related to the amount of subjectivity associated with the inputs to fair valuation of these assets and liabilities, are as follows:
Level 1—Inputs are unadjusted, quoted prices in active markets for identical assets at the measurement date. The types of assets carried at Level 1 fair value generally are equities listed in active markets.
Level 2—Inputs (other than quoted prices included in Level 1) are either directly or indirectly observable for the asset in connection with market data at the measurement date and for the extent of the instrument’s anticipated life. Fair valued assets that are generally included in this category are publicly held debt investments and warrants held in a public company.
Level 3—Inputs reflect management’s best estimate of what market participants would use in pricing the asset at the measurement date. It includes prices or valuations that require inputs that are both significant to the fair value measurement and unobservable. Generally, assets carried at fair value and included in this category are the debt investments and warrants and equities held in a private company.
Debt Investments
We follow the guidance set forth in ASC Topic 820 which establishes a framework for measuring the fair value of assets and liabilities and outlines a fair value hierarchy which prioritizes the inputs used to measure fair value and the effect of fair value measures on earnings. Our debt securities are primarily invested in venture capital-backed companies in technology-related markets including technology, drug discovery and development, biotechnology, life sciences, healthcare, and sustainable and renewable technology at all stages of development. Given the nature of lending to these types of businesses, substantially all of our investments in these portfolio companies are considered Level 3 assets under ASC Topic 820 because there is no known or accessible market or market indexes for debt instruments for these investment securities to be traded or exchanged. In addition, we may, from time to time, invest in public debt of companies that meet our investment objectives. These investments are considered Level 2 assets.
In making a good faith determination of the value of our investments, we generally start with the cost basis of the investment, which includes the value attributed to the OID, if any, and PIK interest or other receivables which have been accrued as earned. We then apply the valuation methods as set forth below.
We apply a procedure for debt investments that assumes the sale of each investment in a hypothetical market to a hypothetical market participant where buyers and sellers are willing participants. The hypothetical market does not include scenarios where the underlying security was simply repaid or extinguished, but includes an exit concept. We determine the yield at inception for each debt investment.
We then use senior secured, leveraged loan yields provided by third party providers to determine the change in market yields between inception of the debt investments and the measurement date. Industry specific indices and other relevant market data are used to benchmark/assess market-based movements.
Under this process, we also evaluate the collateral for recoverability of the debt investments. We consider each portfolio company’s credit rating, security liens and other characteristics of the investment to adjust the baseline yield to derive a credit adjusted hypothetical yield for each investment as of the measurement date. The anticipated future cash flows from each investment are then discounted at the hypothetical yield to estimate each investment’s fair value as of the measurement date.
23
Our process includes an analysis of, among other things, the underlying investment performance, the current portfolio company’s financial condition and market changing events that impact valuation, estimated remaining life, current market yields and interest rate spreads of similar securities as of the measurement date. We value our syndicated debt investments using broker quotes and bond indices amongst other factors. If there is a significant deterioration of the credit quality of a debt investment, we may consider other factors than those a hypothetical market participant would use to estimate fair value, including the proceeds that would be received in a liquidation analysis.
We record unrealized depreciation on investments when we believe that an investment has decreased in value, including where collection of a debt investment is doubtful or, if under the in-exchange premise, when the value of a debt investment is less than the amortized cost of the investment. Conversely, where appropriate, we record unrealized appreciation if we believe that the underlying portfolio company has appreciated in value and, therefore, that our investment has also appreciated in value or, if under the in-exchange premise, the value of a debt investment is greater than amortized cost.
When originating a debt investment, we generally receive warrants or other equity-related securities from the borrower. We determine the cost basis of the warrants or other equity-related securities received based upon their respective fair values on the date of receipt in proportion to the total fair value of the debt and warrants or other equity-related securities received. Any resulting discount on the debt investment from recordation of the warrant or other equity instruments is accreted into interest income over the life of the loan.
Debt investments that are traded on a public exchange are valued at the prevailing market price as of the valuation date.
Equity-Related Securities and Warrants
Securities that are traded in the over-the-counter markets or on a stock exchange will be valued at the prevailing bid price at period end. We have a limited amount of equity securities in public companies. In accordance with the 1940 Act, unrestricted publicly traded securities for which market quotations are readily available are valued at the closing market quote on the measurement date.
We estimate the fair value of warrants using a Black Scholes option pricing model, or OPM. At each reporting date, privately held warrant and equity-related securities are valued based on an analysis of various factors including, but not limited to, the portfolio company’s operating performance and financial condition and general market conditions, price to enterprise value or price to equity ratios, discounted cash flow, valuation comparisons to comparable public companies or other industry benchmarks. When an external event occurs, such as a purchase transaction, public offering, or subsequent equity sale, the pricing indicated by that external event is utilized to corroborate our valuation of the warrant and equity-related securities. We periodically review the valuation of our portfolio companies that have not been involved in a qualifying external event to determine if the enterprise value of the portfolio company may have increased or decreased since the last valuation measurement date.
Escrow Receivables
Escrow receivables are collected in accordance with the terms and conditions of the escrow agreement. Escrow balances are typically distributed over a period greater than one year and may accrue interest during the escrow period. Escrow balances are measured for collectability on at least a quarterly basis and fair value is determined based on the amount of the estimated recoverable balances and the contractual maturity date. As of December 31, 2018, there were no material past due escrow receivables.
Determinations In Connection With Offerings
In connection with each offering of shares of our common stock, the Board of Directors or a committee thereof is required to make the determination that we are not selling shares of our common stock at a price below our then current NAV at the time at which the sale is made, unless it is determined by the Board of Directors that such sale is in the best interests of our stockholders and such sale is otherwise approved by our stockholders. The Board of Directors considers the following factors, among others, in making such determination:
|
|
• |
the NAV of our common stock disclosed in the most recent periodic report we filed with the SEC; |
|
|
• |
our management’s assessment of whether any material change in the NAV has occurred (including through the realization of net gains on the sale of our portfolio investments) from the period beginning on the date of the most recently disclosed NAV to the period ending two days prior to the date of the sale of our common stock; and |
|
|
• |
the magnitude of the difference between (i) a value that our Board of Directors or an authorized committee thereof has determined reflects the current NAV of our common stock, which is generally based upon the NAV of our common stock disclosed in the most recent periodic report that we filed with the SEC, as adjusted to reflect our management’s assessment of any material change in the NAV of our common stock since the date of the most recently disclosed NAV of our common stock, and (ii) the offering price of the shares of our common stock in the proposed offering. |
24
Importantly, this determination does not require that we calculate NAV in connection with each offering of shares of our common stock, but instead it involves the determination by the Board of Directors or a committee thereof that we are not selling shares of our common stock at a price below the then current NAV at the time at which the sale is made.
Moreover, to the extent that there is a possibility that we may (i) issue shares of our common stock at a price below the then current NAV of our common stock at the time at which the sale is made or (ii) trigger the undertaking (which we will provide to the SEC in a registration statement to which a prospectus will be a part) to suspend the offering of shares of our common stock pursuant to a prospectus if the NAV fluctuates by certain amounts in certain circumstances until such prospectus is amended, the Board of Directors or a committee thereof will elect, in the case of clause (i) above, either to postpone the offering until such time that there is no longer the possibility of the occurrence of such, events or to undertake to determine NAV within two days prior to any such sale to ensure that such sale will not be below our then current NAV, and, in the case of clause (ii) above, to comply with such undertaking or to undertake to determine NAV to ensure that such undertaking has not been triggered.
These processes and procedures are part of our compliance policies and procedures. Records will be made contemporaneously with all determinations described in this section and these records will be maintained with other records we are required to maintain under the 1940 Act.
25
Investing in our securities may be speculative and involves a high degree of risk. You should consider carefully the risks described below and all other information contained in this Annual Report, including our financial statements and the related notes and the schedules and exhibits to this Annual Report. The risks set forth below are not the only risks we face. Additional risks and uncertainties not presently known to us or not presently deemed material by us may also impair our operations and performance. If any of the following risks occur, our business, financial condition and results of operations could be materially adversely affected. In such case, our NAV and the trading price of our securities could decline, and you may lose all or part of your investment.
Risks Related to our Business Structure
As an internally managed business development company, we are subject to certain restrictions that may adversely affect our business.
As an internally managed business development company, the size and categories of our assets under management is limited, and we are unable to offer as wide a variety of financial products to prospective portfolio companies and sponsors (potentially limiting the size and diversification of our asset base). We therefore may not achieve efficiencies of scale and greater management resources available to externally managed business development companies.
Additionally, as an internally managed business development company, our ability to offer more competitive and flexible compensation structures, such as offering both a profit-sharing plan and an equity incentive plan, is subject to the limitations imposed by the 1940 Act, which limits our ability to attract and retain talented investment management professionals. As such, these limitations could inhibit our ability to grow, pursue our business plan and attract and retain professional talent, any or all of which may have a negative impact on our business, financial condition and results of operations.
As an internally managed business development company, we are dependent upon key management personnel for their time availability and for our future success, particularly Manuel A. Henriquez, and if we are not able to hire and retain qualified personnel, or if we lose any member of our senior management team, our ability to implement our business strategy could be significantly harmed.
As an internally managed business development company, our ability to achieve our investment objectives and to make distributions to our stockholders depends upon the performance of our senior management. We depend upon the members of our senior management, particularly Mr. Henriquez, as well as other key personnel for the identification, final selection, structuring, closing and monitoring of our investments. These employees have critical industry experience and relationships on which we rely to implement our business plan. If we lose the services of Mr. Henriquez or any senior management members, we may not be able to operate the business as we expect, and our ability to compete could be harmed, which could cause our operating results to suffer. Furthermore, we do not have an employment agreement with Mr. Henriquez or our senior management that restricts them from creating new investment vehicles subject to compliance with applicable law. We believe our future success will depend, in part, on our ability to identify, attract and retain sufficient numbers of highly skilled employees. If we do not succeed in identifying, attracting and retaining such personnel, we may not be able to operate our business as we expect. In connection with our recruiting, branding and marketing efforts, we may, among other things, make charitable contributions in amounts we believe to be immaterial and that do not exceed $500,000 in the aggregate in any year. We believe that many of these contributions help us raise our profile in the communities and benefit us in attracting and retaining talent and investment opportunities.
As an internally managed business development company, our compensation structure is determined and set by our Board of Directors. This structure currently includes salary and bonus and incentive compensation, which is issued through grants and subsequent vesting of restricted stock. We are not generally permitted by the 1940 Act to employ an incentive compensation structure that directly ties performance of our investment portfolio and results of operations to compensation owing to our granting of restricted stock as incentive compensation.
Members of our senior management may receive offers of more flexible and attractive compensation arrangements from other companies, particularly from investment advisers to externally managed business development companies that are not subject to the same limitations on incentive-based compensation that we, as an internally managed business development company are subject to. We do not currently have agreements with certain members of our senior management that prohibit them from leaving and competing with our business and certain States limit our ability to have such agreements. A departure by one or more members of our senior management could have a negative impact on our business, financial condition and results of operations.
26
Our business model depends to a significant extent upon strong referral relationships with venture capital and private equity fund sponsors, and our inability to develop or maintain these relationships, or the failure of these relationships to generate investment opportunities, could adversely affect our business.
We expect that members of our management team will maintain their relationships with venture capital and private equity firms, and we will rely to a significant extent upon these relationships to provide us with our deal flow. If we fail to maintain our existing relationships, our relationships become strained as a result of enforcing our rights with respect to non-performing portfolio companies in protecting our investments or we fail to develop new relationships with other firms or sources of investment opportunities, then we will not be able to grow our investment portfolio. In addition, persons with whom members of our management team have relationships are not obligated to provide us with investment opportunities and, therefore, there is no assurance that such relationships will lead to the origination of debt or other investments.
We may be the target of litigation.
We may be the target of securities litigation in the future, particularly if the trading price of our common stock and our debt securities fluctuates significantly. We could also generally be subject to litigation, including derivative actions by our stockholders. Any litigation could result in substantial costs and divert management’s attention and resources from our business and cause a material adverse effect on our business, financial condition and results of operations.
We operate in a highly competitive market for investment opportunities, and we may not be able to compete effectively.
A number of entities compete with us to make the types of investments that we plan to make in prospective portfolio companies. We compete with a large number of venture capital and private equity firms, as well as with other investment funds, business development companies, investment banks and other sources of financing, including traditional financial services companies such as commercial banks and finance companies. Many of our competitors are substantially larger and have considerably greater financial, technical, marketing and other resources than we do. For example, some competitors may have a lower cost of funds and/or access to funding sources that are not available to us. This may enable some competitors to make loans with interest rates that are comparable to or lower than the rates that we typically offer.
A significant increase in the number and/or the size of our competitors, including traditional commercial lenders and other financing sources, in technology-related industries could force us to accept less attractive investment terms. We may be unable to capitalize on certain opportunities if we do not match competitors’ pricing, terms and structure. If we do match competitors’ pricing, terms or structure, we may experience decreased net interest income and increased risk of credit losses. In addition, some of our competitors may have higher risk tolerances or different risk assessments, which could allow them to consider a wider variety of investments, establish more relationships and build their market shares. An increasing number of competitors may also have the effect of compressing our margins, which could harm our ability to retain employees, increase our operating costs, and decrease the amount and frequency of future distributions. Furthermore, many potential competitors are not subject to the regulatory restrictions that the 1940 Act imposes on us as a business development company or that the Code imposes on us as a RIC. If we are not able to compete effectively, our business, financial condition, and results of operations will be adversely affected. As a result of this competition, there can be no assurance that we will be able to identify and take advantage of attractive investment opportunities, or that we will be able to fully invest our available capital.
If we are unable to manage our future growth effectively, we may be unable to achieve our investment objective, which could adversely affect our financial condition and results of operations and cause the value of your investment to decline.
Our ability to achieve our investment objective will depend on our ability to sustain growth. Sustaining growth will depend, in turn, on our senior management team’s ability to identify, evaluate, finance and invest in suitable companies that meet our investment criteria. Accomplishing this result on a cost-effective basis is largely a function of our marketing capabilities, our management of the investment process, our ability to provide efficient services and our access to financing sources on acceptable terms. Organizational growth and scale-up of our investments could strain our existing managerial, investment, financial and other resources. Management of our growth could divert financial resources from other projects. Failure to manage our future growth effectively could lead to a decrease in our future distributions and have a material adverse effect on our business, financial condition and results of operations.
27
Because we intend to distribute substantially all of our income to our stockholders in order to qualify as a RIC, we will continue to need additional capital to finance our growth. If additional funds are unavailable or not available on favorable terms, our ability to grow will be impaired.
In order to satisfy the tax requirements applicable to a RIC and to minimize or avoid being subject to income and excise taxes, we intend to make distributions to our stockholders treated as dividends for U.S. federal income tax purposes generally of an amount at least equal to substantially all of our net ordinary income and realized net capital gains except for certain realized net capital gains, which we may retain, pay applicable income taxes with respect thereto and elect to treat as deemed distributions to our stockholders. As a business development company, we generally are required to meet a coverage ratio of total assets to total borrowings and other senior securities, which includes all of our borrowings and any preferred stock that we may issue in the future, of at least 150%, subject to certain disclosure requirements. This requirement limits the amount that we may borrow. This limitation may prevent us from incurring debt and require us to raise additional equity at a time when it may be disadvantageous to do so. We cannot assure you that debt and equity financing will be available to us on favorable terms, or at all, and debt financings may be restricted by the terms of any of our outstanding borrowings. If we are unable to incur additional debt, we may be required to raise additional equity at a time when it may be disadvantageous to do so. In addition, shares of closed-end investment companies have recently traded at discounts to their NAV.
This characteristic of closed-end investment companies is separate and distinct from the risk that our NAV per share may decline. We cannot predict whether shares of our common stock will trade above, at or below our NAV. If our common stock trades below its NAV, we generally will not be able to issue additional shares of our common stock at its market price without first obtaining the approval for such issuance from our stockholders and our independent directors. If additional funds are not available to us, we could be forced to curtail or cease new lending and investment activities, and our NAV could decline. In addition, our results of operations and financial condition could be adversely affected.
Because most of our investments typically are not in publicly-traded securities, there is uncertainty regarding the value of our investments, which could adversely affect the determination of our NAV.
At December 31, 2018, portfolio investments, whose fair value is determined in good faith by the Board of Directors, were approximately 96.7% of our total assets. We expect our investments to continue to consist primarily of securities issued by privately-held companies, the fair value of which is not readily determinable. In addition, we are not permitted to maintain a general reserve for anticipated loan losses. Instead, we are required by the 1940 Act to specifically value each investment and record an unrealized gain or loss for any asset that we believe has increased or decreased in value.
There is no single standard for determining fair value in good faith. We value these securities at fair value as determined in good faith by our Board of Directors, based on the recommendations of our Audit Committee. In making a good faith determination of the value of these securities, we generally start with the cost basis of each security, which includes the amortized OID and PIK interest, if any. The Audit Committee uses its best judgment in arriving at the fair value of these securities. As a result, determining fair value requires that judgment be applied to the specific facts and circumstances of each portfolio investment while applying a valuation process for the types of investments we make, which includes but is not limited to deriving a hypothetical exit price.
However, the Board of Directors retains ultimate authority as to the appropriate valuation of each investment. Because such valuations are inherently uncertain and may be based on estimates, our determinations of fair value may differ materially from the values that would be assessed if a ready market for these securities existed. We adjust quarterly the valuation of our portfolio to reflect the Board of Directors’ determination of the fair value of each investment in our portfolio. Any changes in fair value are recorded in our statement of operations as net change in unrealized appreciation or depreciation. Our NAV could be adversely affected if our determinations regarding the fair value of our investments were materially higher than the values that we ultimately realize upon the disposal of such securities.
Because we have substantial indebtedness, there could be increased risk in investing in our company.
Lenders have fixed dollar claims on our assets that are superior to the claims of stockholders, and we have granted, and may in the future grant, lenders a security interest in our assets in connection with borrowings. In the case of a liquidation event, those lenders would receive proceeds before our stockholders. In addition, borrowings, also known as leverage, magnify the potential for gain or loss on amounts invested and, therefore, increase the risks associated with investing in our securities. Leverage is generally considered a speculative investment technique. If the value of our assets increases, then leverage would cause the NAV attributable to our common stock to increase more than it otherwise would have had we not leveraged. Conversely, if the value of our assets decreases, leverage would cause the NAV attributable to our common stock to decline more than it otherwise would have had we not used leverage. Similarly, any increase in our revenue in excess of interest expense on our borrowed funds would cause our net income to increase more than it would without the leverage. Any decrease in our revenue would cause our net income to decline more than it would have had we not borrowed funds and could negatively affect our ability to make distributions on common stock. Our ability to service any debt that we incur will depend largely on our financial performance and will be subject to prevailing economic conditions
28
and competitive pressures. We and, indirectly, our stockholders will bear the cost associated with our leverage activity. If we are not able to service our substantial indebtedness, our business could be harmed materially.
Our secured credit facilities with Wells Fargo Capital Finance, LLC, or the Wells Facility, and MUFG Union Bank, N.A., or the Union Bank Facility and, together with the Wells Facility, our Credit Facilities, our 2022 Notes, our 2024 Notes, our 2025 Notes, our 2033 Notes, our 2027 Asset-Backed Notes, and our 2022 Convertible Notes (as each term is defined below) contain financial and operating covenants that could restrict our business activities, including our ability to declare dividend distributions if we default under certain provisions.
As of December 31, 2018, we had $13.1 million of borrowings outstanding under the Wells Facility and $39.8 million of borrowings outstanding on the Union Bank Facility. In addition, as of December 31, 2018, we had approximately $149.0 million of indebtedness outstanding incurred by our SBIC subsidiary, approximately $150.0 million in aggregate principal amount of 4.625% notes due 2022, or the 2022 Notes, approximately $83.5 million in aggregate principal amount of 6.25% notes due 2024, or the 2024 Notes, approximately $75.0 million in aggregate principal amount of 5.25% notes due 2025, or the 2025 Notes, approximately $40.0 million in aggregate principal amount of 6.25% notes due 2033, or the 2033 Notes, approximately $200.0 million in aggregate principal amount of fixed rate asset-backed notes issued in November 2018, or the 2027 Asset-Backed Notes, in connection with our $284.8 million debt securitization, or the 2018 Debt Securitization, and approximately $230.0 million in aggregate principal amount of 4.375% convertible notes due 2022, or the 2022 Convertible Notes. Additionally, subsequent to December 31, 2018, we had approximately $250.0 million in aggregate principal amount of fixed rate asset-backed notes issued in January 2019, or the 2028 Asset-Backed Notes and, together with the 2027 Asset-Backed Notes, the Asset-Backed Notes, in connection with our $357.2 million debt securitization, or the 2019 Debt Securitization and, together with the 2018 Debt Securitization, the Debt Securitizations.
There can be no assurance that we will be successful in obtaining any additional debt capital on terms acceptable to us or at all. If we are unable to obtain debt capital, then our equity investors will not benefit from the potential for increased returns on equity resulting from leverage to the extent that our investment strategy is successful and we may be limited in our ability to make new commitments or fundings to our portfolio companies.
Until December 6, 2018, as a business development company, under the 1940 Act, generally, we were not permitted to incur indebtedness unless immediately after such borrowing we had an asset coverage for total borrowings of at least 200% (i.e., the amount of debt may not exceed 50% of the value of our assets). The Small Business Credit Availability Act, or the SBCAA, which was signed into law in March 2018, modifies this section of the 1940 Act and decreases this percentage from 200% to 150% (subject to either stockholder approval or approval of both a majority of the board of directors and a majority of directors who are not interested persons). On September 4, 2018 and December 6, 2018, our Board of Directors, including a “required majority” (as such term is defined in Section 57(o) of the 1940 Act) and our stockholders, respectively, approved the application to us of the 150% minimum asset coverage ratio set forth in Section 61(a)(2) of the 1940 Act. As a result, as of December 7, 2018, we are able to incur additional indebtedness, subject to certain disclosure requirements and, therefore, your risk of an investment in us may increase. Rating agencies have reviewed, and may continue to review, our credit ratings and those of other business development companies in light of this new law as well as any corresponding changes to asset coverage ratios and, in certain cases, downgrade such ratings. Such a downgrade in our credit ratings may adversely affect our securities.
As of December 31, 2018, our asset coverage ratio under our regulatory requirements as a business development company was 214.6% excluding our SBIC debentures as a result of our exemptive order from the SEC that allows us to exclude all SBA leverage from our asset coverage ratio and was 197.2% when including all SBA leverage.
Based on assumed leverage equal to 102.6% of our net assets as of December 31, 2018, our investment portfolio would have been required to experience an annual return of at least 2.8% to cover annual interest payments on our additional indebtedness.
Illustration. The following table illustrates the effect of leverage on returns from an investment in our common stock assuming that we employ (1) our actual asset coverage ratio as of December 31, 2018, (excluding our SBA debentures as permitted by our exemptive relief), (2) a hypothetical asset coverage ratio of 200% (excluding our SBA debentures as permitted by our exemptive relief), and (3) a hypothetical asset coverage ratio of 150% (excluding our SBA debentures as permitted by our exemptive relief), each at various annual returns on our portfolio as of December 31, 2018, net of expenses.
29
The calculations in the table below are hypothetical, and actual returns may be higher or lower than those appearing in the table below.
|
|
|
|
|
|
|
|
|
|
|
|
|
|
|
|
|
|
|
|
|
|
|
||
|
|
|
|
Annual Return on Our Portfolio |
|
|||||||||||||||||||
|
|
|
-10% |
|
|
|
-5% |
|
|
0% |
|
|
5% |
|
|
10% |
|
|||||||
|
Corresponding return to common stockholder assuming actual asset coverage as of December 31, 2018 (214.6%) (1) |
|
|
(26.15%) |
|
|
|
|
(15.97%) |
|
|
|
(5.79%) |
|
|
|
4.38% |
|
|
|
14.56% |
|
||
|
Corresponding return to common stockholder assuming 200% asset coverage (2) |
|
|
(28.18%) |
|
|
|
|
(17.36%) |
|
|
|
(6.53%) |
|
|
|
4.30% |
|
|
|
15.13% |
|
||
|
Corresponding return to common stockholder assuming 150% asset coverage (3) |
|
|
(43.82%) |
|
|
|
|
(28.00%) |
|
|
|
(12.17%) |
|
|
|
3.65% |
|
|
|
19.48% |
|
||
|
|
|
(1) |
Assumes $1.9 billion in total assets, $980.5 million in debt outstanding, $955.4 million in stockholders’ equity, and an average cost of funds of 5.6%, which is the approximate average cost of borrowed funds, including our SBA debentures, 2022 Notes, 2024 Notes, 2025 Notes, 2033 Notes, 2027 Asset-Backed Notes, 2022 Convertible Notes, and Credit Facilities for the period ended December 31, 2018. Actual interest payments may be different. |
|
(2) |
Assumes $2.1 billion in total assets including debt issuance costs on a pro forma basis, $1.1 billion in debt outstanding, $955.4 million in stockholders’ equity, and an average cost of funds of 5.6%, which is the approximate average cost of borrowed funds, including our SBA debentures, 2022 Notes, 2024 Notes, 2025 Notes, 2033 Notes, 2027 Asset-Backed Notes, 2022 Convertible Notes, and Credit Facilities for the period ended December 31, 2018, along with the hypothetical estimated incremental cost of debt that would be incurred on offering the maximum permissible debt under the 200% asset coverage. Actual interest payments may be different. |
|
(3) |
Assumes $3.0 billion in total assets including debt issuance costs on a pro forma basis, $2.1 billion in debt outstanding, $955.4 million in stockholders’ equity, and an average cost of funds of 5.6%, which is the approximate average cost of borrowed funds, including our SBA debentures, 2022 Notes, 2024 Notes, 2025 Notes, 2033 Notes, 2027 Asset-Backed Notes, 2022 Convertible Notes, and Credit Facilities for the period ended December 31, 2018, along with the hypothetical estimated incremental cost of debt that would be incurred on offering the maximum permissible debt under the 150% asset coverage. Actual interest payments may be different. |
It is likely that the terms of any current or future long-term or revolving credit or warehouse facility we may enter into in the future could constrain our ability to grow our business.
Under our borrowings and our Credit Facilities, current lenders have, and any future lender or lenders may have, fixed dollar claims on our assets that are senior to the claims of our stockholders and, thus, will have a preference over our stockholders with respect to our assets pledged as collateral under the Credit Facilities. Our Credit Facilities and borrowings also subject us to various financial and operating covenants, including, but not limited to, maintaining certain financial ratios and minimum tangible net worth amounts. Future credit facilities and borrowings will likely subject us to similar or additional covenants. In addition, we may grant a security interest in our assets in connection with any such credit facilities and borrowings.
Our Credit Facilities generally contain customary default provisions such as a minimum net worth amount, a profitability test, and a restriction on changing our business and loan quality standards. In addition, our Credit Facilities require or are expected to require the repayment of all outstanding debt on the maturity which may disrupt our business and potentially the business of our portfolio companies that are financed through the facilities. An event of default under these facilities would likely result, among other things, in termination of the availability of further funds under the facilities and accelerated maturity dates for all amounts outstanding under the facilities, which would likely disrupt our business and, potentially, the business of the portfolio companies whose loans we finance through the facilities. This could reduce our revenues and, by delaying any cash payment allowed to us under our facilities until the lender has been paid in full, reduce our liquidity and cash flow and impair our ability to grow our business and our ability to make distributions sufficient to maintain our ability to be subject to tax as a RIC.
The terms of future available financing may place limits on our financial and operation flexibility. If we are unable to obtain sufficient capital in the future, we may be forced to reduce or discontinue our operations, not be able to make new investments, or otherwise respond to changing business conditions or competitive pressures.
30
In addition to regulatory requirements that restrict our ability to raise capital, our 2022 Notes, 2024 Notes, 2025 Notes, 2033 Notes, 2022 Convertible Notes, and Credit Facilities contain various covenants which, if not complied with, could require accelerated repayment under the facility or require us to repurchase the 2022 Notes, 2024 Notes, 2025 Notes, 2033 Notes, or 2022 Convertible Notes thereby materially and adversely affecting our liquidity, financial condition, results of operations and ability to pay distributions.
The credit agreements governing our 2022 Notes, 2024 Notes, 2025 Notes, 2033 Notes, 2022 Convertible Notes, and Credit Facilities require us to comply with certain financial and operational covenants. These covenants require us to, among other things, maintain certain financial ratios, including asset coverage, debt to equity and interest coverage. Our ability to continue to comply with these covenants in the future depends on many factors, some of which are beyond our control. There are no assurances that we will be able to comply with these covenants. Failure to comply with these covenants would result in a default which, if we were unable to obtain a waiver from the lenders under our Credit Facilities and could accelerate repayment under the facilities or the 2022 Notes, 2024 Notes, 2025 Notes, 2033 Notes, or 2022 Convertible Notes and thereby have a material adverse impact on our liquidity, financial condition, results of operations and ability to pay a sufficient amount of distributions and maintain our ability to be subject to tax as a RIC. We may not have enough available cash or be able to obtain financing at the time we are required to make repurchases. See “Note 4 – Borrowings”.
Acquisitions or investments that we may pursue could be unsuccessful, consume significant resources and require the incurrence of additional indebtedness.
We regularly consider acquisitions and investments that complement our existing business. These possible acquisitions and investments involve or may involve significant cash expenditures, debt incurrence, operating losses and expenses that could have a material effect on our financial condition and operating results.
In particular, if we incur additional debt, our liquidity and financial stability could be impaired as a result of using a significant portion of available cash or borrowing capacity to finance an acquisition. Moreover, we may face an increase in interest expense or financial leverage if additional debt is incurred to finance an acquisition, which may, among other things, adversely affect our various financial ratios and our compliance with the conditions of our existing indebtedness. In addition, such additional indebtedness may be secured by liens on our assets.
Acquisitions involve numerous other risks, including:
|
|
• |
diversion of management time and attention; |
|
|
• |
failures to identify material problems and liabilities of acquisition targets or to obtain sufficient indemnification rights to fully offset possible liabilities related to the acquired businesses; |
|
|
• |
difficulties integrating the operations, technologies and personnel of the acquired businesses; |
|
|
• |
inefficiencies and complexities that may arise due to unfamiliarity with new assets, businesses or markets; |
|
|
• |
disruptions to our ongoing business; |
|
|
• |
inaccurate estimates of fair value made in the accounting for acquisitions and amortization of acquired intangible assets which would reduce future reported earnings; |
|
|
• |
the inability to obtain required financing for the new acquisition or investment opportunities and our existing business; |
|
|
• |
the need or obligation to divest portions of an acquired business; |
|
|
• |
challenges associated with operating in new geographic regions; |
|
|
• |
difficulties in achieving anticipated cost savings, synergies, business opportunities and growth prospects; |
|
|
• |
potential loss of our or the acquired business’ key employees, contractual relationships, suppliers or customers; and |
|
|
• |
inability to obtain required regulatory approvals. |
To the extent we pursue an acquisition that causes us to incur unexpected costs or that fails to generate expected returns, our financial position, results of operations and cash flows may be adversely affected, and our ability to service indebtedness, including our outstanding notes, may be negatively impacted.
In addition, we may fail in our pursuit of an acquisition and, instead, one of our competitors may successfully obtain the target and deprive us of an important opportunity and allow them to grow larger giving them the ability to have a lower cost of capital and competitive advantage in the market (including by being able to offer better pricing and larger loans) and, as a larger company, potentially giving them more valuable equity currency to do other transactions.
31
We may be unable to obtain debt capital on favorable terms or at all, in which case we would not be able to use leverage to increase the return on our investments.
If we are unable to obtain debt capital, then our equity investors will not benefit from the potential for increased returns on equity resulting from leverage to the extent that our investment strategy is successful and we may be limited in our ability to make new commitments or fundings to our portfolio companies. An inability to obtain debt capital may also limit our ability to refinance existing indebtedness, particularly during periods of adverse credit market conditions when refinancing indebtedness may not be available under interest rates and other terms acceptable to us or at all.
The Wells Facility and the Union Bank Facility mature in January 2023 and February 2023, respectively, and any inability to renew, extend or replace our Credit Facilities could adversely impact our liquidity and ability to find new investments or maintain distributions to our stockholders.
As of December 31, 2018, we had two available secured credit facilities, the Wells Facility and the Union Bank Facility, which mature in January 2023 and February 2023, respectively. There can be no assurance that we will be able to renew, extend or replace our Credit Facilities upon maturity on terms that are favorable to us, if at all. Our ability to renew, extend or replace the Credit Facility will be constrained by then-current economic conditions affecting the credit markets. In the event that we are not able to renew, extend or replace either Credit Facility at the time of its maturity, this could have a material adverse effect on our liquidity and ability to fund new investments, our ability to make distributions to our stockholders and our ability to qualify as a RIC.
We are subject to certain risks as a result of our interests in connection with the Debt Securitizations and our equity interest in the Securitization Issuers.
On November 1, 2018, in connection with the 2018 Debt Securitization and the offering of the 2027 Asset-Backed Notes by Hercules Capital Funding Trust 2018-1, or the 2018 Securitization Issuer, we sold and/or contributed to Hercules Capital Funding 2018-1 LLC, as trust depositor, or the 2018 Trust Depositor, certain senior loans made to certain of our portfolio companies, or the 2018 Loans, which the 2018 Trust Depositor in turn sold and/or contributed to the 2018 Securitization Issuer in exchange for 100% of the equity interest in the 2018 Securitization Issuer, cash proceeds and other consideration. Following these transfers, the 2018 Securitization Issuer, and not the 2018 Trust Depositor or us, held all of the ownership interest in the 2018 Loans.
On January 22, 2019, in connection with the 2019 Debt Securitization and the offering of the 2028 Asset-Backed Notes by Hercules Capital Funding Trust 2019-1, or the 2019 Securitization Issuer and, together with the 2018 Securitization Issuer, the Securitization Issuers, we sold and/or contributed to Hercules Capital Funding 2019-1 LLC, as trust depositor, or the 2019 Trust Depositor and, together with the 2018 Trust Depositor, the Trust Depositors, certain senior loans made to certain of our portfolio companies, or the 2019 Loans and, together with the 2018 Loans, the Securitization Loans, which the 2019 Trust Depositor in turn sold and/or contributed to the 2019 Securitization Issuer in exchange for 100% of the equity interest in the 2019 Securitization Issuer, cash proceeds and other consideration. Following these transfers, the 2019 Securitization Issuer, and not the 2019 Trust Depositor or us, held all of the ownership interest in the 2019 Loans.
As a result of the Debt Securitizations, we hold, indirectly through the Trust Depositors, 100% of the equity interests in the Securitization Issuers. As a result, we consolidate the financial statements of the Trust Depositors and the Securitization Issuers, as well as our other subsidiaries, in our consolidated financial statements. Because each of the Trust Depositors and the Securitization Issuers is disregarded as an entity separate from its owners for U.S. federal income tax purposes, the sale or contribution by us to the Trust Depositors, and by the Trust Depositors to the Securitization Issuers, as applicable, did not constitute a taxable event for U.S. federal income tax purposes. If the IRS were to take a contrary position, there could be a material adverse effect on our business, financial condition, results of operations or cash flows.
Further, a failure of either of the Securitization Issuers to be treated as a disregarded entity for U.S. federal income tax purposes would constitute an event of default pursuant to the applicable indenture under the Debt Securitizations, upon which the trustee under the 2018 Debt Securitization, or the 2018 Trustee, or the 2019 Debt Securitization, or the 2019 Trustee and, together with the 2018 Trustee, the Securitization Trustees, as applicable, may and will at the direction of a supermajority of the holders of the 2027 Asset-Backed Notes, or the 2027 Noteholders, or the holders of the 2028 Asset-Back Notes, or the 2028 Noteholders and, together with the 2027 Noteholders, the Securitization Noteholders, as the case may be, declare the applicable Asset-Backed Notes, to be immediately due and payable and exercise remedies under the applicable indenture, including (i) to institute proceedings for the collection of all amounts then payable on the applicable Asset-Backed Notes, or under the applicable indenture, enforce any judgment obtained, and collect from the applicable Securitization Issuer and any other obligor upon the applicable Asset-Backed Notes monies adjudged due; (ii) institute proceedings from time to time for the complete or partial foreclosure of the applicable indenture with respect to the property of the applicable Securitization Issuer; (iii) exercise any remedies as a secured party under the relevant Uniform Commercial Code and take other appropriate action under applicable law to protect and enforce the rights and remedies of the applicable Securitization Trustee and the applicable Securitization Noteholders; or (iv) sell the property of the applicable Securitization Issuer or any portion thereof or rights or interest therein at one or more public or private sales called and conducted in any matter permitted by
32
law. Any such exercise of remedies could have a material adverse effect on our business, financial condition, results of operations or cash flows.
An event of default in connection with the Debt Securitizations could give rise to a cross-default under our other material indebtedness.
The documents governing our other material indebtedness contain customary cross-default provisions that could be triggered if an event of default occurs in connection with either of the Debt Securitizations. An event of default with respect to our other indebtedness could lead to the acceleration of such indebtedness and the exercise of other remedies as provided in the documents governing such other indebtedness. This could have a material adverse effect on our business, financial condition, results of operations and cash flows and may result in our inability to make distributions sufficient to maintain our ability to be subject to tax as a RIC.
We may not receive cash distributions in respect of our indirect ownership interests in the Securitization Issuers.
Apart from fees payable to us in connection with our role as servicer of the Securitization Loans and the reimbursement of related amounts under the documents governing the Debt Securitizations, we receive cash in connection with the Debt Securitizations only to the extent that the Trust Depositors receive payments in respect of their equity interests in the Securitization Issuers. The respective holders of the equity interests in the Securitization Issuers are the residual claimants on distributions, if any, made by the applicable Securitization Issuer after the respective Securitization Noteholders and other claimants have been paid in full on each payment date or upon maturity of the applicable Asset-Backed Notes, subject to the priority of payments under the documents governing the Debt Securitizations. To the extent that the value of a Securitization Issuer’s portfolio of loans is reduced as a result of conditions in the credit markets (relevant in the event of a liquidation event), other macroeconomic factors, distressed or defaulted loans or the failure of individual portfolio companies to otherwise meet their obligations in respect of the loans, or for any other reason, the ability of either Securitization Issuer to make cash distributions in respect of the applicable Trust Depositor’s equity interests would be negatively affected and consequently, the value of the equity interests in such Securitization Issuer would also be reduced. In the event that we fail to receive cash indirectly from the Securitization Issuers, we could be unable to make distributions, if at all, in amounts sufficient to maintain our ability to be subject to tax as a RIC.
The interests of the Securitization Noteholders may not be aligned with our interests.
The Asset-Backed Notes are debt obligations ranking senior in right of payment to the rights of the holders of the equity interests in the Securitization Issuers, as residual claimants in respect of distributions, if any, made by the Securitization Issuers. As such, there are circumstances in which the interests of the Securitization Noteholders may not be aligned with the interests of holders of the equity interests in the Securitization Issuers. For example, under the terms of the documents governing the Debt Securitizations, the Securitization Noteholders have the right to receive payments of principal and interest prior to holders of the equity interests.
For as long as the Asset-Backed Notes remain outstanding, the respective Securitization Noteholders have the right to act in certain circumstances with respect to the applicable Securitization Loans in ways that may benefit their interests but not the interests of the respective holders of the equity interests in the Securitization Issuers, including by exercising remedies under the documents governing the Debt Securitizations.
If an event of default occurs, the applicable Securitization Noteholders will be entitled to determine the remedies to be exercised, subject to the terms of the documents governing the Debt Securitizations. For example, upon the occurrence of an event of default with respect to the Asset-Backed Notes, the applicable Securitization Trustee may and will at the direction of the holders of a supermajority of the applicable Asset-Backed Notes declare the principal, together with any accrued interest, of the notes to be immediately due and payable. This would have the effect of accelerating the principal on such notes, triggering a repayment obligation on the part of the applicable Securitization Issuer. The applicable Asset-Backed Notes then outstanding will be paid in full before any further payment or distribution on the equity interest is made. There can be no assurance that there will be sufficient funds through collections on the Securitization Loans or through the proceeds of the sale of the Securitization Loans in the event of a bankruptcy or insolvency to repay in full the obligations under the Asset-Backed Notes, or to make any distribution to holders of the equity interests in the Securitization Issuers.
Remedies pursued by the Securitization Noteholders could be adverse to our interests as the indirect holder of the equity interests in the Securitization Issuers. The Securitization Noteholders have no obligation to consider any possible adverse effect on such other interests. Thus, there can be no assurance that any remedies pursued by the Securitization Noteholders will be consistent with the best interests of the Trust Depositors or that we will receive, indirectly through the Trust Depositors, any payments or distributions upon an acceleration of the Asset-Backed Notes. Any failure of the Securitization Issuers to make distributions in respect of the equity interests that we indirectly hold, whether as a result of an event of default and the acceleration of payments on the Asset-Backed Notes or otherwise, could have a material adverse effect on our business, financial condition, results of operations and cash flows and may result in our inability to make distributions sufficient to maintain our ability to be subject to tax as a RIC.
33
Certain events related to the performance of Securitization Loans could lead to the acceleration of principal payments on the Asset-Backed Notes.
The following constitute rapid amortization events, or Rapid Amortization Events, under the documents governing the Debt Securitizations: (i) the aggregate outstanding principal balance of delinquent Securitization Loans, and restructured Securitization Loans that would have been delinquent Securitization Loans had such loans not become restructured loans, in the portfolio of Securitization Loans held by the applicable Securitization Issuer exceeds 10% of the current aggregate outstanding principal balance of the Securitization Loans held by such Securitization Issuer for a period of three consecutive months; (ii) the aggregate outstanding principal balance of defaulted Securitization Loans in the portfolio of Securitization Loans held by the applicable Securitization Issuer exceeds 5% of the initial outstanding principal balance of the Securitization Loans held by such Securitization Issuer determined as of November 1, 2018 (in the case of the 2027 Loans) or January 22, 2019 (in the case of the 2028 Loans) for a period of three consecutive months; (iii) the aggregate outstanding principal balance of the 2027 Asset-Backed Notes or the 2028 Asset-Backed Notes, as applicable, exceeds the applicable borrowing base for a period of three consecutive months; (iv) either Securitization Issuer’s pool of Securitization Loans contains Securitization Loans to ten or fewer obligors, as applicable; and (v) the occurrence of an event of default under the applicable documents governing the Debt Securitizations. After a Rapid Amortization Event has occurred, subject to the priority of payments under the documents governing the Debt Securitizations, principal collections on the applicable Securitization Loans will be used to make accelerated payments of principal on the applicable Asset-Backed Notes until the principal balance of such Asset-Back Notes is reduced to zero. Such an event could delay, reduce or eliminate the ability of the applicable Securitization Issuer to make distributions in respect of the equity interests that we indirectly hold, which could have a material adverse effect on our business, financial condition, results of operations and cash flows and may result in our inability to make distributions sufficient to maintain our ability to be subject to tax as a RIC.
We have certain repurchase obligations with respect to the Securitization Loans transferred in connection with the Debt Securitizations.
As part of each Debt Securitization, we entered into a sale and contribution agreement and a sale and servicing agreement under which we would be required to repurchase any Securitization Loan (or participation interest therein) which was sold to the applicable Securitization Issuer in breach of certain customary representations and warranties made by us or by the applicable Trust Depositor with respect to such Securitization Loan or the legal structure of the applicable Debt Securitization. To the extent that there is a breach of such representations and warranties and we fail to satisfy any such repurchase obligation, the applicable Securitization Trustee may, on behalf of the applicable Securitization Issuer, bring an action against us to enforce these repurchase obligations.
Our investments in a portfolio company, whether debt, equity, or a combination thereof, may lead to our receiving material non-public information, or MNPI, or obtaining ‘control’ of the target company. Our ability to exit an investment where we have MNPI or control could be limited and could result in a realized loss on the investment.
If we receive MNPI, or a controlling interest in a portfolio company, our ability to divest ourselves from a debt or equity investment could be restricted. Causes of such restriction could include market factors, such as liquidity in a private stock, or limited trading volume in a public company’s securities, or regulatory factors, such as the receipt of MNPI or insider blackout periods, where we are under legal obligation not to sell. Additionally, we may choose not to take certain actions to protect a debt investment in a control investment portfolio company. As a result, we could experience a decrease in the value of our portfolio company holdings and potentially incur a realized loss on the investment.
Regulations governing our operations as a business development company may affect our ability to, and the manner in which, we raise additional capital, which may expose us to risks.
Our business will require a substantial amount of capital. We may acquire additional capital from the issuance of senior securities, including borrowings, securitization transactions or other indebtedness, or the issuance of additional shares of our common stock. However, we may not be able to raise additional capital in the future on favorable terms or at all. We may issue debt securities, other evidences of indebtedness or preferred stock, and we may borrow money from banks or other financial institutions, which we refer to collectively as “senior securities,” up to the maximum amount permitted by the 1940 Act. Until December 6, 2018, as a business development company, under the 1940 Act, we were not permitted to incur indebtedness unless immediately after such borrowing we have an asset coverage for total borrowings of at least 200% (i.e., the amount of debt may not exceed 50% of the value of our assets). The SBCAA, which was signed into law in March 2018, modifies this section of the 1940 Act and decreases this percentage from 200% to 150% (subject to either stockholder approval or approval of both a majority of the board of directors and a majority of directors who are not interested persons). On September 4, 2018 and December 6, 2018, our Board of Directors, including a “required majority” (as such term is defined in Section 57(o) of the 1940 Act) and our stockholders, respectively, approved the application to us of the 150% minimum asset coverage ratio set forth in Section 61(a)(2) of the 1940 Act. As a result, as of December 7, 2018, we are able to incur additional indebtedness, subject to certain disclosure requirements and, therefore, your risk of an investment in us may increase. Rating agencies may also decide to review our credit ratings and those of other business development companies in light of this new law as well as any corresponding changes to asset coverage ratios and consider downgrading such
34
ratings, including a downgrade from an investment grade rating to a non-investment grade rating. Such a downgrade in our credit ratings may adversely affect our securities. See “—A downgrade, suspension or withdrawal of the credit rating assigned by a rating agency to us or our debt securities, if any, or change in the debt markets could cause the liquidity or market value of our debt securities to decline significantly.”
If the value of our assets declines, we may be unable to satisfy this test. If that happens, we may be required to liquidate a portion of our investments and repay a portion of our indebtedness at a time when such transaction may be disadvantageous. As a result of issuing senior securities, we would also be exposed to risks associated with leverage, including an increased risk of loss. If we issue preferred stock, the preferred stock would rank “senior” to common stock in our capital structure, preferred stockholders would have separate voting rights and might have rights, preferences, or privileges more favorable than those of our common stockholders and the issuance of preferred stock could have the effect of delaying, deferring, or preventing a transaction or a change of control that might involve a premium price for holders of our common stock or otherwise be in your best interest. It is likely that any senior securities or other indebtedness we issue will be governed by an indenture or other instrument containing covenants restricting our operating flexibility. Additionally, some of these securities or other indebtedness may be rated by rating agencies, and in obtaining a rating for such securities and other indebtedness, we may be required to abide by operating and investment guidelines that further restrict operating and financial flexibility.
To the extent that we are constrained in our ability to issue debt or other senior securities, we will depend on issuances of common stock to finance operations. Other than in certain limited situations such as rights offerings, as a business development company, we are generally not able to issue our common stock at a price below NAV without first obtaining required approvals from our stockholders and our independent directors. If we raise additional funds by issuing more common stock or senior securities convertible into, or exchangeable for, our common stock, then the percentage ownership of our stockholders at that time will decrease, and you might experience dilution. Moreover, we can offer no assurance that we will be able to issue and sell additional equity securities in the future, on favorable terms or at all.
When we are a debt or minority equity investor in a portfolio company, we may not be in a position to control the entity, and management of the company may make decisions that could decrease the value of our portfolio holdings.
We make both debt and minority equity investments; therefore, we are subject to the risk that a portfolio company may make business decisions with which we disagree, and the stockholders and management of such company may take risks or otherwise act in ways that do not serve our interests. As a result, a portfolio company may make decisions that could decrease the value of our portfolio holdings.
If we do not invest a sufficient portion of our assets in qualifying assets, we could fail to qualify as a business development company or be precluded from investing according to our current business strategy.
As a business development company, we may not acquire any assets other than “qualifying assets” as defined under the 1940 Act, unless, at the time of and after giving effect to such acquisition, at least 70% of our total assets are qualifying assets. See “Item 1. Business –Regulation.”
We believe that most of the senior loans we make will constitute qualifying assets. However, we may be precluded from investing in what we believe are attractive investments if such investments are not qualifying assets for purposes of the 1940 Act. If we do not invest a sufficient portion of our assets in qualifying assets, we could lose our status as a business development company, which would have a material adverse effect on our business, financial condition and results of operations. In addition, a rise in the equity markets may result in increased market valuations of certain of our existing and prospective portfolio companies, which may lead to new investments with such companies being qualified as non-eligible portfolio company assets and would require we invest in qualified assets or risk losing our status as a business development company. Similarly, these rules could prevent us from making follow-on investments in existing portfolio companies (which could result in the dilution of our position) or could require us to dispose of investments at inopportune times in order to comply with the 1940 Act. If we need to dispose of such investments quickly, it would be difficult to dispose of such investments on favorable terms. For example, we may have difficulty in finding a buyer and, even if we do find a buyer, we may have to sell the investments at a substantial loss.
A failure on our part to maintain our qualification as a business development company would significantly reduce our operating flexibility.
If we fail to continuously qualify as a business development company, we might be subject to regulation as a registered closed-end investment company under the 1940 Act, which would significantly decrease our operating flexibility, and lead to situations where we might have to restrict our borrowings, reduce our leverage, sell securities and pursue other activities that we are allowed to engage in as a business development company. In addition, failure to comply with the requirements imposed on business development companies by the 1940 Act could cause the SEC to bring an enforcement action against us. For additional information on the qualification requirements of a business development company, see “Item 1. Business – Regulation.”
35
To the extent OID and PIK interest constitute a portion of our income, we will be exposed to risks associated with such income being required to be included in taxable and accounting income prior to receipt of cash representing such income.
Our investments may include OID instruments and contractual PIK interest arrangements, which represents contractual interest added to a loan balance and due at the end of such loan’s term. To the extent OID or PIK interest constitute a portion of our income, we are exposed to risks associated with such income being required to be included in taxable and accounting income prior to receipt of cash, including the following:
|
|
• |
The higher interest rates of OID and PIK instruments reflect the payment deferral and increased credit risk associated with these instruments, and OID and PIK instruments generally represent a significantly higher credit risk than coupon loans. |
|
|
• |
Even if the accounting conditions for income accrual are met, the borrower could still default when our actual collection is supposed to occur at the maturity of the obligation, which could lead to future losses. |
|
|
• |
OID and PIK instruments may have unreliable valuations because their continuing accruals require continuing judgments about the collectability of the deferred payments and the value of any associated collateral. OID and PIK income may also create uncertainty about the source of our cash distributions. |
|
|
• |
For accounting purposes, any cash distributions to stockholders representing OID and PIK income are not treated as coming from paid-in capital, even though the cash to pay them comes from the offering proceeds. As a result, despite the fact that a distribution representing OID and PIK income could be paid out of amounts invested by our stockholders, the 1940 Act does not require that stockholders be given notice of this fact by reporting it as a return of capital. |
|
|
• |
The deferral of PIK interest may have a negative impact on our liquidity as it represents non-cash income that may require cash distributions to our stockholders in order to maintain our ability to be subject to tax as a RIC. |
|
|
• |
Recent tax legislation requires that income be recognized for tax purposes no later than when recognized for financial reporting purposes. |
If we are unable to satisfy Code requirements for qualification as a RIC, then we will be subject to corporate-level income tax, which would adversely affect our results of operations and financial condition.
We elected to be treated as a RIC for U.S. federal income tax purposes with the filing of our federal corporate income tax return for 2006. We will not qualify for the tax treatment allowable to RICs if we are unable to comply with the source of income, asset diversification and distribution requirements contained in Subchapter M of the Code, or if we fail to maintain our election to be regulated as a business development company under the 1940 Act. If we fail to qualify as a RIC for any reason and become subject to a corporate-level income tax, the resulting taxes could substantially reduce our net assets, the amount of income available for distribution to our stockholders and the actual amount of our distributions. Such a failure would have a material adverse effect on us, the NAV of our common stock and the total return, if any, earned from your investment in our common stock.
We may have difficulty paying our required distributions under applicable tax rules if we recognize income before or without receiving cash representing such income.
In accordance with U.S. federal tax requirements, we are required to include in income for tax purposes certain amounts that we have not yet received in cash, such as OID and contractual PIK interest arrangements, which represent contractual interest added to a loan balance and due at the end of such loan’s term. In addition to the cash yields received on our loans, in some instances, our loans generally include one or more of the following: exit fees, balloon payment fees, commitment fees, success fees or prepayment fees. In some cases our loans also include contractual PIK interest arrangements. The increases in loan balances as a result of contractual PIK arrangements are included in income for the period in which such PIK interest was accrued, which is often in advance of receiving cash payment, and are separately identified on our statements of cash flows. We also may be required to include in income for tax purposes certain other amounts prior to receiving the related cash. Also, recent tax legislation requires that income be recognized for tax purposes no later than when recognized for financial reporting purposes.
Any warrants that we receive in connection with our debt investments will generally be valued as part of the negotiation process with the particular portfolio company. As a result, a portion of the aggregate purchase price for the debt investments and warrants will be allocated to the warrants that we receive. This will generally result in OID for tax purposes, which we must recognize as ordinary income, increasing the amount that we are required to distribute in order to be subject to tax as a RIC. Because these warrants generally will not produce distributable cash for us at the same time as we are required to make distributions in respect of the related OID, if ever, we would need to obtain cash from other sources or to pay a portion of our distributions using shares of newly issued common stock, consistent with IRS guidelines and the Code, to satisfy such distribution requirements.
36
Other features of the debt instruments that we hold may also cause such instruments to generate OID in excess of current cash interest received. Since in certain cases we may recognize income before or without receiving cash representing such income, we may have difficulty meeting the RIC tax requirement to make distributions each taxable year to our stockholders treated as dividends for U.S. federal income tax purposes generally of an amount equal to at least 90% of our investment company taxable income, determined without regard to any deduction for dividends paid. Under such circumstances, we may have to sell some of our assets, raise additional debt or equity capital or reduce new investment originations to meet these distribution requirements. If we are unable to obtain cash from other sources and are otherwise unable to satisfy such distribution requirements, we may fail to qualify to be subject to tax as a RIC and, thus, become subject to a corporate-level income tax on all our taxable income (including any net realized securities gains).
Furthermore, we may invest in the equity securities of non-U.S. corporations (or other non-U.S. entities classified as corporations for U.S. federal income tax purposes) that could be treated under the Code and U.S. Treasury regulations as PFICs and/or CFCs. The rules relating to investment in these types of non-U.S. entities are designed to ensure that U.S. taxpayers are either, in effect, taxed currently (or on an accelerated basis with respect to corporate level events) or taxed at increased tax rates at distribution or disposition. In certain circumstances, these rules also could require us to recognize taxable income or gains where we do not receive a corresponding payment in cash. Furthermore, under recently proposed Treasury Regulations, certain income derived by us either from a PFIC with respect to which we have made a certain U.S. tax election or from a CFC would generally constitute qualifying income for purposes of determining our ability to be subject to tax as a RIC only to the extent the PFIC or CFC respectively makes distributions of that income to us. As such, we may be restricted in our ability to make QEF elections with respect to our holdings in issuers that could either be treated as PFICs or CFCs in order to limit our tax liability or maximize our after-tax return from these investments.
Our portfolio investments may present special tax issues.
Investments in below-investment grade debt instruments and certain equity securities may present special tax issues for us. U.S. federal income tax rules are not entirely clear about issues such as when we may cease to accrue interest, OID or market discount, when and to what extent deductions may be taken for bad debts or worthless debt in equity securities, how payments received on obligations in default should be allocated between principal and interest income, as well as whether exchanges of debt instruments in a bankruptcy or workout context are taxable. Such matters could cause us to recognize taxable income for U.S. federal income tax purposes, even in the absence of cash or economic gain, and require us to make taxable distributions to our stockholders to maintain our RIC status or preclude the imposition of either U.S. federal corporate income or excise taxation. Additionally, because such taxable income may not be matched by corresponding cash received by us, we may be required to borrow money or dispose of other investments to be able to make distributions to our stockholders. These and other issues will be considered by us, to the extent determined necessary, in order that we minimize the level of any U.S. federal income or excise tax that we would otherwise incur. See “Certain United States Federal Income Tax Considerations—Taxation as a Regulated Investment Company.”
FATCA withholding may apply to payments made to certain foreign entities.
The Foreign Account Tax Compliance Act provisions of the Code and the related Treasury Regulations and other administrative guidance promulgated thereunder, or collectively, FATCA, generally requires us to withhold U.S. tax (at a 30% rate) on payments of interest and taxable dividends made to a foreign financial institution or non-financial foreign entity (including such an institution or entity acting as an intermediary) unless the foreign financial institution or non-financial foreign entity complies with certain information reporting, withholding, identification, certification and related requirements imposed by FATCA. Persons located in jurisdictions that have entered into an intergovernmental agreement with the United States to implement FATCA may be subject to different rules. Stockholders may be requested to provide additional information to enable us to determine whether such withholding is required.
Legislative or regulatory tax changes could adversely affect you.
At any time, the U.S. federal income tax laws governing RICs or the administrative interpretations of those laws or regulations may be amended. Any of those new laws, regulations or interpretations may take effect retroactively and could adversely affect the taxation of us or of you as a stockholder. Therefore, changes in tax laws, regulations or administrative interpretations or any amendments thereto could diminish the value of an investment in our shares or the value or the resale potential of our investments.
There is a risk that you may not receive distributions or that our distributions may not grow over time.
We intend to make distributions on a quarterly basis to our stockholders. We cannot assure you that we will achieve investment results, or our business may not perform in a manner that will allow us to make a specified level of distributions or year-to-year increases in cash distributions. In addition, due to the asset coverage test applicable to us as a business development company, we may be limited in our ability to make distributions. Also, our Credit Facilities limit our ability to declare distributions to our stockholders if we default under certain provisions of our Credit Facilities. Furthermore, while we may have undistributed earnings, those earnings may not yield distributions because we may incur unrealized losses or otherwise be unable to distribute such earnings.
37
We have and may in the future choose to pay distributions in our own stock, in which case you may be required to pay tax in excess of the cash you receive.
Under applicable Treasury regulations and other general guidelines issued by the IRS, RICs are permitted to treat certain distributions payable in their stock, as taxable dividends that will satisfy their annual distribution obligations for U.S. federal income tax and excise tax purposes provided that stockholders have the opportunity to elect to receive all or a portion of such distribution in cash. Taxable stockholders receiving distributions will be required to include the full amount of such distributions as ordinary income (or as long-term capital gain to the extent such distribution is properly reported as a capital gain dividend) to the extent of our current and accumulated earnings and profits for U.S. federal income tax purposes. As a result, a U.S. stockholder may be required to pay tax with respect to such distributions in excess of any cash received. If a U.S. stockholder sells the stock it receives as a distribution in order to pay this tax, the sales proceeds may be less than the amount included in income with respect to the distribution, depending on the market price of our stock at the time of the sale. Furthermore, with respect to non-U.S. stockholders, we may be required to withhold U.S. federal income tax with respect to such distributions, including in respect of all or a portion of such distribution that is payable in stock. In addition, if a significant number of our stockholders determine to sell shares of our stock in order to pay taxes owed on such distributions, then such sales may put downward pressure on the trading price of our stock. We may in the future determine to distribute taxable distributions that are partially payable in our common stock.
We are exposed to risks associated with changes in interest rates, including fluctuations in interest rates which could adversely affect our profitability or the value of our portfolio
General interest rate fluctuations may have a substantial negative impact on our investments and investment opportunities, and, accordingly, may have a material adverse effect on our investment objective and rate of return on investment capital. A portion of our income will depend upon the difference between the rate at which we borrow funds and the interest rate on the debt securities in which we invest. Because we will borrow money to make investments and may issue debt securities, preferred stock or other securities, our net investment income is dependent upon the difference between the rate at which we borrow funds or pay interest or dividends on such debt securities, preferred stock or other securities and the rate at which we invest these funds. Typically, we anticipate that our interest-earning investments will accrue and pay interest at both variable and fixed rates, and that our interest-bearing liabilities will generally accrue interest at fixed rates.
A significant increase in market interest rates could harm our ability to attract new portfolio companies and originate new loans and investments. In addition to potentially increasing the cost of our debt, increasing interest rates may also have a negative impact on our portfolio companies’ ability to repay or service their loans, which could enhance the risk of loan defaults. We expect that most of our current initial investments in debt securities will be at floating rate with a floor. However, in the event that we make investments in debt securities at variable rates, a significant increase in market interest rates could also result in an increase in our non-performing assets and a decrease in the value of our portfolio because our floating-rate loan portfolio companies may be unable to meet higher payment obligations. As of December 31, 2018, approximately 97.3% of our loans were at floating rates or floating rates with a floor and 2.7% of the loans were at fixed rates.
In periods of rising interest rates, our cost of funds would increase, resulting in a decrease in our net investment income. In addition, a decrease in interest rates may reduce net income, because new investments may be made at lower rates despite the increased demand for our capital that the decrease in interest rates may produce. We may, but will not be required to, hedge against the risk of adverse movement in interest rates in our short-term and long-term borrowings relative to our portfolio of assets. If we engage in hedging activities, it may limit our ability to participate in the benefits of lower interest rates with respect to the hedged portfolio. Adverse developments resulting from changes in interest rates or hedging transactions could have a material adverse effect on our business, financial condition, and results of operations.
Additionally, in July 2017, the head of the United Kingdom Financial Conduct Authority announced that it will no longer persuade or compel banks to submit rates for the calculation of LIBOR after 2021. At this time, it is not possible to predict the effect of this announcement as there is no definitive information regarding the future utilization of LIBOR or of any particular replacement rate. In addition, any further changes or reforms to the determination or supervision of LIBOR may result in a sudden or prolonged increase or decrease in reported LIBOR, which could have an adverse impact on the market value for or value of any LIBOR-linked securities, loans, and other financial obligations or extensions of credit held by or due to us and could have a material adverse effect on our business, financial condition and results of operations.
38
We may expose ourselves to risks if we engage in hedging transactions.
If we engage in hedging transactions, we may expose ourselves to risks associated with such transactions. We may utilize instruments such as forward contracts, currency options and interest rate swaps, caps, collars and floors to seek to hedge against fluctuations in the relative values of our portfolio positions from changes in currency exchange rates and market interest rates. Hedging against a decline in the values of our portfolio positions does not eliminate the possibility of fluctuations in the values of such positions or prevent losses if the values of such positions decline. However, such hedging can establish other positions designed to gain from those same developments, thereby offsetting the decline in the value of such portfolio positions. Such hedging transactions may also limit the opportunity for gain if the values of the underlying portfolio positions should increase. It may not be possible to hedge against an exchange rate or interest rate fluctuation that is so generally anticipated that we are not able to enter into a hedging transaction at an acceptable price. Moreover, for a variety of reasons, we may not seek to establish a perfect correlation between such hedging instruments and there can be no assurance that any such hedging arrangements will achieve the desired effect. During the year ended December 31, 2018, we did not engage in any hedging activities.
Recently passed legislation allows us to incur additional leverage.
Until December 6, 2018, as a business development company, under the 1940 Act, generally we were not permitted to incur indebtedness unless immediately after such borrowing we had an asset coverage for total borrowings of at least 200% (i.e., the amount of debt may not exceed 50% of the value of our assets). The SBCAA, which was signed into law in March 2018, modifies this section of the 1940 Act and decreases this percentage from 200% to 150% (subject to either stockholder approval or approval of both a majority of the board of directors and a majority of directors who are not interested persons). On September 4, 2018 and December 6, 2018, our Board of Directors, including a “required majority” (as such term is defined in Section 57(o) of the 1940 Act) and our stockholders, respectively, approved the application to us of the 150% minimum asset coverage ratio set forth in Section 61(a)(2) of the 1940 Act. As a result, as of December 7, 2018, we are able to incur additional indebtedness, subject to certain disclosure requirements and, therefore, your risk of an investment in us may increase. Rating agencies may also decide to review our credit ratings and those of other business development companies in light of this new law as well as any corresponding changes to asset coverage ratios and consider downgrading such ratings, including a downgrade from an investment grade rating to a non-investment grade rating. Such a downgrade in our credit ratings may adversely affect our securities. See “—A downgrade, suspension or withdrawal of the credit rating assigned by a rating agency to us or our debt securities, if any, or change in the debt markets could cause the liquidity or market value of our debt securities to decline significantly.”
One of our wholly-owned subsidiaries is licensed by the U.S. SBA, and as a result, we will be subject to SBA regulations, which could limit our capital or investment decisions.
Our wholly-owned subsidiary HT III is licensed to act as SBIC and is regulated by the SBA. HT III holds approximately $307.5 million in assets and it accounted for approximately 14.3% of the Company’s total assets, prior to consolidation at December 31, 2018. The SBIC license allows our SBIC subsidiary to obtain leverage by issuing SBA-guaranteed debentures, subject to the issuance of a capital commitment by the SBA and other customary procedures. On July 13, 2018, we completed repayment of the remaining outstanding HT II debentures and subsequently surrendered the SBA license with respect to our wholly-owned subsidiary HT II.
The SBA regulations require that a licensed SBIC be periodically examined and audited by the SBA to determine its compliance with the relevant SBA regulations. The SBA prohibits, without prior SBA approval, a “change of control” of an SBIC or transfers that would result in any person (or a group of persons acting in concert) owning 10.0% or more of a class of capital stock of a licensed SBIC. If HT III fails to comply with applicable SBA regulations, the SBA could, depending on the severity of the violation, limit or prohibit HT III’s use of debentures, declare outstanding debentures immediately due and payable, and/or limit HT III from making new investments. Such actions by the SBA would, in turn, negatively affect us because HT III is our wholly owned subsidiaries.
HT III was in compliance with the terms of the SBIC’s leverage as of December 31, 2018 as a result of having sufficient capital as defined under the SBA regulations. Compliance with SBA requirements may cause HT III to forego attractive investment opportunities that are not permitted under SBA regulations. See “Item 1. Business — Regulation—Small Business Administration Regulations.”
39
SBA regulations limit the outstanding dollar amount of SBA guaranteed debentures that may be issued by an SBIC or group of SBICs under common control.
The SBA regulations currently limit the dollar amount of SBA-guaranteed debentures that can be issued by any one SBIC to $175.0 million or to a group of SBICs under common control to $350.0 million. An SBIC may not borrow an amount in excess of two times (and in certain cases, up to three times) its regulatory capital. As of December 31, 2018, we have issued $149.0 million in SBA-guaranteed debentures in our SBIC subsidiary, which is the maximum capacity for our SBIC subsidiary under our existing license. During times that we reach the maximum dollar amount of SBA-guaranteed debentures permitted, and if we require additional capital, our cost of capital is likely to increase, and there is no assurance that we will be able to obtain additional financing on acceptable terms.
Moreover, the current status of our SBIC subsidiary as a SBIC does not automatically assure that our SBIC subsidiary will continue to receive SBA-guaranteed debenture funding. Receipt of SBA leverage funding is dependent upon our SBIC subsidiary continuing to be in compliance with SBA regulations and policies and available SBA funding. The amount of SBA leverage funding available to a SBIC is dependent upon annual Congressional authorizations and in the future may be subject to annual Congressional appropriations. There can be no assurance that there will be sufficient debenture funding available at the times desired by our SBIC subsidiary.
The debentures guaranteed by the SBA have a maturity of ten years and require semi-annual payments of interest. HT III has debentures outstanding that become due starting in September 2020. Our SBIC subsidiary will need to generate sufficient cash flow to make required interest payments on the debentures. If our SBIC subsidiary is unable to meet its financial obligations under the debentures, the SBA, as a creditor, will have a superior claim to our SBIC subsidiary’s assets over our stockholders in the event we liquidate our SBIC subsidiary or the SBA exercises its remedies under such debentures as the result of a default by us.
Our wholly-owned SBIC subsidiary may be unable to make distributions to us that will enable us to maintain RIC status, which could result in the imposition of an entity-level tax.
In order for us to continue to qualify for RIC tax treatment and to minimize corporate-level taxes, we will be required to distribute substantially all of our investment company taxable income, determined without regard to any deduction for dividends paid, and net capital gains, including income from certain of our subsidiaries, which includes the income from our SBIC subsidiary. We will be partially dependent on our SBIC subsidiary for cash distributions to enable us to meet the RIC distribution requirements. Our SBIC subsidiary may be limited by the Small Business Investment Act of 1958, as amended, and SBA regulations governing SBICs, from making certain distributions to us that may be necessary to maintain our ability to be subject to tax as a RIC. We may have to request a waiver of the SBA’s restrictions for our SBIC subsidiary to make certain distributions to maintain our ability to be subject to tax as a RIC. We cannot assure you that the SBA will grant such waiver. If our SBIC subsidiary is unable to obtain a waiver, compliance with the SBA regulations may result in loss of RIC tax treatment and a consequent imposition of an entity-level tax on us.
If we fail to maintain an effective system of internal control over financial reporting, we may not be able to accurately report our financial results or prevent fraud. As a result, stockholders could lose confidence in our financial and other public reporting, which would harm our business and the trading price of our common stock.
Effective internal controls over financial reporting are necessary for us to provide reliable financial reports and, together with adequate disclosure controls and procedures, are designed to prevent fraud. Any failure to implement required new or improved controls, or difficulties encountered in their implementation could cause us to fail to meet our reporting obligations. In addition, any testing by us conducted in connection with Section 404 of the Sarbanes-Oxley Act of 2002, as amended, or the Sarbanes-Oxley Act, or the subsequent testing by our independent registered public accounting firm (when undertaken, as noted below), may reveal deficiencies in our internal controls over financial reporting that are deemed to be material weaknesses or that may require prospective or retroactive changes to our consolidated financial statements or identify other areas for further attention or improvement. Inferior internal controls could also cause investors and lenders to lose confidence in our reported financial information, which could have a negative effect on the trading price of our common stock.
Our Board of Directors may change our investment objective, operating policies and strategies without prior notice or stockholder approval, the effects of which may be adverse.
Our Board of Directors has the authority, except as otherwise provided in the 1940 Act, to modify or waive certain of our operating policies and strategies without prior notice and without stockholder approval. However, absent stockholder approval, we may not change the nature of our business so as to cease to be, or withdraw our election as, a business development company. We cannot predict the effect any changes to our current operating policies and strategies would have on our business, operating results and the market price of our common stock. Nevertheless, any such changes could materially and adversely affect our business and impair our ability to make distributions to our stockholders.
40
Significant U.S. federal tax legislation was recently enacted and the impact of this new legislation on us and on entities in which we may invest is uncertain.
Significant U.S. federal tax reform legislation was enacted in 2017 that, among many other changes, permanently reduces the maximum federal corporate income tax rate, reduces the maximum individual income tax rate (effective for taxable years 2018 through 2025), restricts the deductibility of business interest expense, changes the rules regarding the calculation of net operating loss deductions that may be used to offset taxable income, and, under certain circumstances, requires accrual method taxpayers to recognize income for U.S. federal income tax purposes no later than the income is taken into account as revenue in an applicable financial statement. The legislation also makes extensive changes to the U.S. international tax system. The impact of this legislation on us and on entities in which we may invest is uncertain. Prospective investors are urged to consult their tax advisors regarding the effects of the legislation on an investment in us.
Changes in laws or regulations governing our business could negatively affect the profitability of our operations.
Changes in the laws or regulations, or the interpretations of the laws and regulations, which govern business development companies, SBICs, RICs or non-depository commercial lenders could significantly affect our operations and our cost of doing business. We are subject to federal, state and local laws and regulations, in addition to applicable foreign and international laws and regulations, and are subject to judicial and administrative decisions that affect our operations, including our loan originations maximum interest rates, fees and other charges, disclosures to portfolio companies, the terms of secured transactions, collection and foreclosure procedures, and other trade practices. If these laws, regulations or decisions change, or if we expand our business into jurisdictions that have adopted more stringent requirements than those in which we currently conduct business, then we may have to incur significant expenses in order to comply or we may have to restrict our operations. In addition, if we do not comply with applicable laws, regulations and decisions, then we may lose licenses needed for the conduct of our business and be subject to civil fines and criminal penalties, any of which could have a material adverse effect upon our business results of operations or financial condition.
Uncertainty about presidential administration initiatives could negatively impact our business, financial condition and results of operations.
The Trump administration has called for significant changes to U.S. trade, healthcare, immigration, foreign and government regulatory policy. In this regard, there is significant uncertainty with respect to legislation, regulation and government policy at the federal level, as well as the state and local levels. Recent events have created a climate of heightened uncertainty and introduced new and difficult-to-quantify macroeconomic and political risks with potentially far-reaching implications. There has been a corresponding meaningful increase in the uncertainty surrounding interest rates, inflation, foreign exchange rates, trade volumes and fiscal and monetary policy. To the extent the U.S. Congress or the Trump administration implements changes to U.S. policy, those changes may impact, among other things, the U.S. and global economy, international trade and relations, unemployment, immigration, corporate taxes, healthcare, the U.S. regulatory environment, inflation and other areas. Although we cannot predict the impact, if any, of these changes to our business, they could adversely affect our business, financial condition, operating results and cash flows. Until we know what policy changes are made and how those changes impact our business and the business of our competitors over the long term, we will not know if, overall, we will benefit from them or be negatively affected by them.
Our business is subject to increasingly complex corporate governance, public disclosure and accounting requirements that could adversely affect our business and financial results.
We are subject to changing rules and regulations of federal and state government as well as the stock exchange on which our common stock is listed. These entities, including the Public Company Accounting Oversight Board, the SEC and the New York Stock Exchange, or NYSE, have issued a significant number of new and increasingly complex requirements and regulations over the course of the last several years and continue to develop additional regulations and requirements in response to laws enacted by Congress. The Dodd-Frank Wall Street Reform and Protection Act, as amended, or the Dodd-Frank Act, contains significant corporate governance and executive compensation-related provisions, and the SEC has adopted, and will continue to adopt, additional rules and regulations that may impact us. Our efforts to comply with these requirements have resulted in, and are likely to continue to result in, an increase in expenses and a diversion of management’s time from other business activities.
In addition, our failure to maintain compliance with such rules, or for our management to appropriately address issues relating to our compliance with such rules fully and in a timely manner, exposes us to an increasing risk of inadvertent non-compliance. While our management team takes reasonable efforts to ensure that we are in full compliance with all laws applicable to its operations, the increasing rate and extent of regulatory change increases the risk of a failure to comply, which may result in our ability to operate our business in the ordinary course or may subject us to potential fines, regulatory findings or other matters that may materially impact our business.
41
Many of the requirements called for in the Dodd-Frank Act are expected to be implemented over time, most of which will likely be subject to implementing regulations over the course of several years. However, the new presidential administration has announced its intention to repeal, amend, or replace certain portions of the Dodd-Frank Act and the regulations implemented thereunder. Given the uncertainty associated with the manner in which and whether the provisions of the Dodd‑Frank Act will be implemented, repealed, amended or replaced, the full impact such requirements will have on our business, results of operations or financial condition is unclear. The changes resulting from the Dodd‑Frank Act or any changes to the regulations already implemented thereunder may require us to invest significant management attention and resources to evaluate and make necessary changes in order to comply with new statutory and regulatory requirements. Failure to comply with any such laws, regulations or principles, or changes thereto, may negatively impact our business, results of operations and financial condition. While we cannot predict what effect any changes in the laws or regulations or their interpretations would have on our business as a result of recent financial reform legislation, these changes could be materially adverse to us and our stockholders.
We incur significant costs as a result of being a publicly traded company.
As a publicly traded company, we incur legal, accounting and other expenses, including costs associated with the periodic reporting requirements applicable to a company whose securities are registered under the Exchange Act as well as additional corporate governance requirements, including requirements under the Sarbanes-Oxley Act and other rules implemented by the SEC.
Results may fluctuate and may not be indicative of future performance.
Our operating results may fluctuate and, therefore, you should not rely on current or historical period results to be indicative of our performance in future reporting periods. Factors that could cause operating results to fluctuate include, but are not limited to, variations in the investment origination volume and fee income earned, changes in the accrual status of our debt investments, variations in timing of prepayments, variations in and the timing of the recognition of net realized gains or losses and changes in unrealized appreciation or depreciation, the level of our expenses, the degree to which we encounter competition in our markets, and general economic conditions.
We face cyber-security risks and the failure in cyber security systems, as well as the occurrence of events unanticipated in our disaster recovery systems and management continuity planning could impair our ability to conduct business effectively.
Our business operations rely upon secure information technology systems for data processing, storage and reporting. Despite careful security and controls design, implementation and updating, our information technology systems could become subject to cyber-attacks. Network, system, application and data breaches could result in operational disruptions or information misappropriation, which could have a material adverse effect on our business, results of operations and financial condition.
The occurrence of a disaster such as a cyber-attack, a natural catastrophe, an industrial accident, a terrorist attack or war, events unanticipated in our disaster recovery systems, or a support failure from external providers, could have an adverse effect on our ability to conduct business and on our results of operations and financial condition, particularly if those events affect our computer-based data processing, transmission, storage, and retrieval systems or destroy data. If a significant number of our managers were unavailable in the event of a disaster, our ability to effectively conduct our business could be severely compromised.
We depend heavily upon computer systems to perform necessary business functions. Despite our implementation of a variety of security measures, our computer systems could be subject to cyber-attacks and unauthorized access, such as physical and electronic break-ins or unauthorized tampering. Like other companies, we may experience threats to our data and systems, including malware and computer virus attacks, unauthorized access, system failures and disruptions. If one or more of these events occurs, it could potentially jeopardize the confidential, proprietary and other information processed and stored in, and transmitted through, our computer systems and networks, or otherwise cause interruptions or malfunctions in our operations, which could result in damage to our reputation, financial losses, litigation, increased costs, regulatory penalties and/or customer dissatisfaction or loss.
Terrorist attacks, acts of war or natural disasters may affect any market for our securities, impact the businesses in which we invest and harm our business, operating results and financial condition.
Terrorist acts, acts of war or natural disasters may disrupt our operations, as well as the operations of the businesses in which we invest. Such acts have created, and continue to create, economic and political uncertainties and have contributed to global economic instability. Future terrorist activities, military or security operations, or natural disasters could further weaken the domestic/global economies and create additional uncertainties, which may negatively impact the businesses in which we invest directly or indirectly and, in turn, could have a material adverse impact on our business, operating results and financial condition. Losses from terrorist attacks and natural disasters are generally uninsurable.
42
We are dependent on information systems and systems failures could significantly disrupt our business, which may, in turn, negatively affect the market price of our common stock and our ability to pay distributions.
Our business is dependent on our and third parties’ communications and information systems. Any failure or interruption of those systems, including as a result of the termination of an agreement with any third-party service providers, could cause delays or other problems in our activities. Our financial, accounting, data processing, backup or other operating systems and facilities may fail to operate properly or become disabled or damaged as a result of a number of factors including events that are wholly or partially beyond our control and adversely affect our business. There could be:
|
|
• |
sudden electrical or telecommunication outages; |
|
|
• |
natural disasters such as earthquakes, tornadoes and hurricanes; |
|
|
• |
disease pandemics; |
|
|
• |
events arising from local or larger scale political or social matters, including terrorist acts; and |
|
|
• |
cyber-attacks. |
These events, in turn, could have a material adverse effect on our operating results and negatively affect the market price of our common stock and our ability to pay distributions to our stockholders.
We may be subject to restrictions on our ability to make distributions to our stockholders.
Restrictions imposed on the declaration of dividends or other distributions to holders of our common stock, by both the 1940 Act and by requirements imposed by rating agencies, might impair our ability to make the required distributions to our stockholders in order to be subject to tax as a RIC. While we intend to prepay our Notes and other debt to the extent necessary to enable us to distribute our income as required to maintain our ability to be subject to tax as a RIC, there can be no assurance that such actions can be effected in time or in a manner to satisfy the requirements set forth in the Code.
Further downgrades of the U.S. credit rating, automatic spending cuts or another government shutdown could negatively impact our liquidity, financial condition and earnings.
Recent U.S. debt ceiling and budget deficit concerns have increased the possibility of additional credit-rating downgrades and economic slowdowns, or a recession in the U.S. Although U.S. lawmakers passed legislation to raise the federal debt ceiling on multiple occasions, ratings agencies have lowered or threatened to lower the long-term sovereign credit rating on the United States. The impact of this or any further downgrades to the U.S. government’s sovereign credit rating or its perceived creditworthiness could adversely affect the U.S. and global financial markets and economic conditions. These developments could cause interest rates and borrowing costs to rise, which may negatively impact our ability to access the debt markets on favorable terms.
In addition, disagreement over the federal budget has caused the U.S. federal government to shutdown for periods of time resulting in, among other things, inadequate funding for and/or the shutdown of certain government agencies, including the SEC, SBA, and U.S. Food and Drug Administration, or the FDA, on which the operation of our business may rely. Inadequate funding for and/or the shutdown of these government agencies prevents them from performing their normal business functions, which could impact, among other things, (i) our and our portfolio companies’ ability to access the public markets and obtain necessary capital in order to, among other things, properly capitalize, continue or expand operations, or, in the case of portfolio investments held by us, liquidate such investments; (ii) our ability to originate SBA loans; and (iii) the ability of the FDA and other governmental agencies to timely review and process regulatory submissions of our portfolio companies. Continued adverse political and economic conditions, including a prolonged U.S. federal government shutdown, could have a material adverse effect on our business, financial condition and results of operations.
Our business and operations could be negatively affected if we become subject to stockholder activism, which could cause us to incur significant expense, hinder the execution of our investment strategy or impact our stock price.
Stockholder activism, which could take many forms, including making public demands that we consider certain strategic alternatives, engaging in public campaigns to attempt to influence our corporate governance and/or our management, and commencing proxy contests to attempt to elect the activists’ representatives or others to our Board of Directors, or arise in a variety of situations, has been increasing in the business development company industry recently. While we are currently not subject to any stockholder activism, due to the potential volatility of our stock price and for a variety of other reasons, we may in the future become the target of stockholder activism. Stockholder activism could result in substantial costs and divert management’s and our Board of Directors’ attention and resources from our business. Additionally, such stockholder activism could give rise to perceived uncertainties as to our future and adversely affect our relationships with service providers and our portfolio companies. Also, we may be required to incur
43
significant legal and other expenses related to any activist stockholder matters. Further, our stock price could be subject to significant fluctuation or otherwise be adversely affected by the events, risks and uncertainties of any stockholder activism.
Risks Related to Current Economic and Market Conditions
Capital markets may experience periods of disruption and instability and we cannot predict when these conditions will occur. Such market conditions could materially and adversely affect debt and equity capital markets in the United States and abroad, which could have a negative impact on our business, financial condition and results of operations.
The global capital markets have experienced a period of disruption as evidenced by a lack of liquidity in the debt capital markets, write-offs in the financial services sector, the re-pricing of credit risk and the failure of certain major financial institutions. While the capital markets have improved, these conditions could deteriorate again in the future. During such market disruptions, we may have difficulty raising debt or equity capital, especially as a result of regulatory constraints.
Market conditions may in the future make it difficult to extend the maturity of or refinance our existing indebtedness and any failure to do so could have a material adverse effect on our business. The illiquidity of our investments may make it difficult for us to sell such investments if required. As a result, we may realize significantly less than the value at which we have recorded our investments. In addition, significant changes in the capital markets, including the disruption and volatility, have had, and may in the future have, a negative effect on the valuations of our investments and on the potential for liquidity events involving our investments. An inability to raise capital, and any required sale of our investments for liquidity purposes, could have a material adverse impact on our business, financial condition and results of operations.
Various social and political tensions in the United States and around the world, including in the Middle East, Eastern Europe North Korea, and Russia, may continue to contribute to increased market volatility, may have long-term effects on the United States and worldwide financial markets, and may cause further economic uncertainties or deterioration in the United States and worldwide. In addition, continuing uncertainty arising from the United Kingdom’s decision to leave the European Union, or Brexit, could lead to further market disruptions and currency volatility, potentially weakening consumer, corporate and financial confidence and resulting in lower economic growth for companies that rely significantly on Europe for their business activities and revenues. We may in the future have difficulty accessing debt and equity capital markets, and a severe disruption in the global financial markets, deterioration in credit and financing conditions or uncertainty regarding U.S. government spending and deficit levels, Brexit or other global economic conditions could have a material adverse effect on our business, financial condition and results of operations.
The broader fundamentals of the United States economy remain mixed. In the event that the United States economy contracts, it is likely that the financial results of small to mid-sized companies, like many of our portfolio companies, could experience deterioration or limited growth from current levels, which could ultimately lead to difficulty in meeting their debt service requirements and an increase in defaults. In addition, declines in oil and natural gas prices could adversely affect the credit quality of our debt investments and the underlying operating performance of our equity investments in energy-related businesses. In addition, volatility in the equity markets could impact our portfolio companies’ access to the debt and equity capital markets, which could ultimately limit their ability to grow, satisfy existing financing and other arrangements and impact their ability to perform. Volatility in the equity markets could also impact our ability to liquidate or achieve value from warrants and other equity investments we have in our portfolio companies. Consequently, we can provide no assurance that the performance of certain portfolio companies will not be negatively impacted by economic cycles, industry cycles or other conditions, which could also have a negative impact on our future results.
These market and economic disruptions affect, and these and other similar market and economic disruptions may in the future affect, the U.S. capital markets, which could adversely affect our business and that of our portfolio companies. We cannot predict the duration of the effects related to these or similar events in the future on the United States economy and securities markets or on our investments. We monitor developments and seek to manage our investments in a manner consistent with achieving our investment objective, but there can be no assurance that we will be successful in doing so.
Depending on funding requirements, we may need to raise additional capital to meet our unfunded commitments through additional borrowings.
As of December 31, 2018, we had approximately $139.0 million of unfunded commitments, including undrawn revolving facilities, which were available at the request of the portfolio company and unencumbered by milestones.
44
Our unfunded contractual commitments may be significant from time to time. A portion of these unfunded contractual commitments are dependent upon the portfolio company reaching certain milestones before the debt commitment becomes available. Furthermore, our credit agreements contain customary lending provisions which allow us relief from funding obligations for previously made commitments in instances where the underlying company experiences materially adverse events that affect the financial condition or business outlook for the company. These commitments will be subject to the same underwriting and ongoing portfolio maintenance as are the on-balance sheet financial instruments that we hold. Since these commitments may expire without being drawn upon, the total commitment amount does not necessarily represent future cash requirements. Closed commitments generally fund 70-80% of the committed amount in aggregate over the life of the commitment. We believe that our assets provide adequate cover to satisfy all of our unfunded comments and we intend to use cash flow from normal and early principal repayments and proceeds from borrowings and notes to fund these commitments. However, there can be no assurance that we will have sufficient capital available to fund these commitments as they come due, which could have a material adverse effect on our reputation in the market and our ability to generate incremental lending activity and subject us to lender liability claims.
Our ability to secure additional financing and satisfy our financial obligations under indebtedness outstanding from time to time will depend upon our future operating performance, which is subject to the prevailing general economic and credit market conditions, including interest rate levels and the availability of credit generally, and financial, business and other factors, many of which are beyond our control. The prolonged continuation or worsening of current economic and capital market conditions could have a material adverse effect on our ability to secure financing on favorable terms, if at all.
Changes relating to the LIBOR calculation process may adversely affect the value of our portfolio of the LIBOR-indexed, floating-rate debt securities.
In the recent past, concerns have been publicized that some of the member banks surveyed by the British Bankers’ Association, or BBA, in connection with the calculation of the London Interbank Offered Rate, or LIBOR, across a range of maturities and currencies may have been under-reporting or otherwise manipulating the inter-bank lending rate applicable to them in order to profit on their derivatives positions or to avoid an appearance of capital insufficiency or adverse reputational or other consequences that may have resulted from reporting inter-bank lending rates higher than those they actually submitted. A number of BBA member banks entered into settlements with their regulators and law enforcement agencies with respect to alleged manipulation of LIBOR, and investigations by regulators and governmental authorities in various jurisdictions are ongoing.
Actions by the BBA, regulators or law enforcement agencies as a result of these or future events, may result in changes to the manner in which LIBOR is determined. Potential changes, or uncertainty related to such potential changes may adversely affect the market for LIBOR-based securities, including our portfolio of LIBOR-indexed, floating-rate debt securities. In addition, any further changes or reforms to the determination or supervision of LIBOR may result in a sudden or prolonged increase or decrease in reported LIBOR, which could have an adverse impact on the market for LIBOR-based securities or the value of our portfolio of LIBOR-indexed, floating-rate debt securities.
Risks Related to Our Investments
Our investments are concentrated in certain industries and in a number of technology-related companies, which subjects us to the risk of significant loss if any of these companies default on their obligations under any of their debt securities that we hold, or if any of the technology-related industry sectors experience a downturn.
We have invested and intend to continue investing in a limited number of technology-related companies and, we have recently seen an increase in the number of investments representing approximately 5% or more of our NAV. A consequence of this limited number of investments is that the aggregate returns we realize may be significantly adversely affected if a small number of investments perform poorly or if we need to write down the value of any one investment. Beyond the asset diversification requirements to which we are subject as a business development company and a RIC, we do not have fixed guidelines for diversification or limitations on the size of our investments in any one portfolio company and our investments could be concentrated in relatively few issuers. In addition, we have invested in and intend to continue investing, under normal circumstances, at least 80% of the value of our total assets (including the amount of any borrowings for investment purposes) in technology-related companies.
As of December 31, 2018, approximately 87.8% of the fair value of our portfolio was composed of investments in five industries: 29.2% was composed of investments in the software industry, 28.7% was composed of investments in the drug discovery and development industry, 17.5% was composed of investments in the internet consumer and business services industry, 6.5% was composed of investments in the medical devices & equipment industry and 5.9% was composed of investments in the sustainable and renewable technology industry.
As a result, a downturn in technology-related industry sectors and particularly those in which we are heavily concentrated could materially adversely affect our financial condition.
45
We are a non-diversified investment company within the meaning of the 1940 Act, and therefore we generally are not limited with respect to the proportion of our assets that may be invested in securities of a single issuer.
We are classified as a non-diversified investment company within the meaning of the 1940 Act, which means that we are not limited by the 1940 Act with respect to the proportion of our assets that we may invest in securities of a single issuer, excluding limitations on investments in other investment companies. To the extent that we assume large positions in the securities of a small number of issuers, our NAV may fluctuate to a greater extent than that of a diversified investment company as a result of changes in the financial condition or the market’s assessment of the issuer. We may also be more susceptible to any single economic or regulatory occurrence than a diversified investment company. Beyond the asset diversification requirements to which we are subject as a business development company and a RIC, we do not have fixed guidelines for portfolio diversification, and our investments could be concentrated in relatively few portfolio companies or industries. Although we are classified as a non-diversified investment company within the meaning of the 1940 Act, we maintain the flexibility to operate as a diversified investment company and have done so for an extended period of time. To the extent that we operate as a non-diversified investment company in the future, we may be subject to greater risk.
Our financial results could be negatively affected if a significant portfolio investment fails to perform as expected.
Our total investment in companies may be significant individually or in the aggregate. As a result, if a significant investment in one or more companies fails to perform as expected, our financial results could be more negatively affected and the magnitude of the loss could be more significant than if we had made smaller investments in more companies.
The following table shows the fair value of the totals of investments held in portfolio companies at December 31, 2018 that represent greater than 5% of our net assets:
|
|
December 31, 2018 |
|
|||||
|
(in thousands) |
Fair Value |
|
|
Percentage of Net Assets |
|
||
|
Paratek Pharmaceuticals, Inc. (p.k.a. Transcept Pharmaceuticals, Inc.) |
$ |
70,960 |
|
|
|
7.4 |
% |
|
EverFi, Inc. |
|
60,408 |
|
|
|
6.3 |
% |
|
BridgeBio Pharma LLC |
|
56,986 |
|
|
|
6.0 |
% |
|
Businessolver.com, Inc. |
|
53,967 |
|
|
|
5.6 |
% |
|
Lithium Technologies, Inc. |
|
53,706 |
|
|
|
5.6 |
% |
|
Fuze, Inc. |
|
51,943 |
|
|
|
5.4 |
% |
|
Axovant Sciences Ltd. |
|
49,415 |
|
|
|
5.2 |
% |
|
|
• |
Paratek Pharmaceuticals, Inc. is a biopharmaceutical company focused on the development and commercialization of innovative therapies based upon its expertise in novel tetracycline chemistry. |
|
|
• |
EverFi, Inc. is a technology company that offers a web-based media platform to teach and certify students in the core concepts of financial literacy, from student loan defaults and sub-prime mortgages to credit card debt and rising bankruptcy rates. |
|
|
• |
BridgeBio Pharma LLC is a clinical-stage biopharmaceutical company that discovers and develops drugs for patients with genetic diseases. |
|
|
• |
Businessolver.com, Inc. is a technology company that provides a cloud-based SaaS platform for employee benefit administration designed to manage and monitor enrollment and payroll dashboards with real-time data. |
|
|
• |
Lithium Technologies, Inc. is a technology company that develops a software platform that helps customers to connect, engage, and understand their total community. |
|
|
• |
Fuze, Inc. is a technology company that provides a cloud-based unified communications-as-a-service platform to server message block, mid-market, and small enterprise customers worldwide. |
|
|
• |
Axovant Sciences Ltd. is a clinical-stage biopharmaceutical company focused on acquiring, developing and commercializing novel therapeutics for the treatment of dementia. |
Our financial results could be materially adversely affected if these portfolio companies or any of our other significant portfolio companies encounter financial difficulty and fail to repay their obligations or to perform as expected.
46
Our investments may be in portfolio companies that have limited operating histories and resources.
We expect that our portfolio will continue to consist of investments that may have relatively limited operating histories. These companies may be particularly vulnerable to U.S. and foreign economic downturns may have more limited access to capital and higher funding costs, may have a weaker financial position and may need more capital to expand or compete. These businesses also may experience substantial variations in operating results. They may face intense competition, including from larger, more established companies with greater financial, technical and marketing resources. Furthermore, some of these companies do business in regulated industries and could be affected by changes in government regulation applicable to their given industry. Accordingly, these factors could impair their cash flow or result in other events, such as bankruptcy, which could limit their ability to repay their obligations to us, and may adversely affect the return on, or the recovery of, our investment in these companies. We cannot assure you that any of our investments in our portfolio companies will be successful. We may lose our entire investment in any or all of our portfolio companies.
Investing in publicly traded companies can involve a high degree of risk and can be speculative.
We have invested, and expect to continue to invest, a portion of our portfolio in publicly traded companies or companies that are in the process of completing their IPO. As publicly traded companies, the securities of these companies may not trade at high volumes, and prices can be volatile, particularly during times of general market volatility, which may restrict our ability to sell our positions and may have a material adverse impact on us.
Our ability to invest in public companies may be limited in certain circumstances.
To maintain our status as a business development company, we are not permitted to acquire any assets other than “qualifying assets” specified in the 1940 Act unless, at the time the acquisition is made, at least 70% of our total assets are qualifying assets (with certain limited exceptions). Subject to certain exceptions for follow-on investments and distressed companies, an investment in an issuer that has outstanding securities listed on a national securities exchange may be treated as a qualifying asset only if such issuer has a market capitalization that is less than $250.0 million at the time of such investment and meets the other specified requirements.
Our investment strategy focuses on technology-related companies, which are subject to many risks, including volatility, intense competition, shortened product life cycles, changes in regulatory and governmental programs and periodic downturns, and you could lose all or part of your investment.
We have invested and will continue investing primarily in technology-related companies, many of which may have narrow product lines and small market shares, which tend to render them more vulnerable to competitors’ actions and market conditions, as well as to general economic downturns. The revenues, income (or losses), and valuations of technology-related companies can and often do fluctuate suddenly and dramatically. In addition, technology-related industries are generally characterized by abrupt business cycles and intense competition. Overcapacity in technology-related industries, together with cyclical economic downturns, may result in substantial decreases in the market capitalization of many technology-related companies. Such decreases in market capitalization may occur again, and any future decreases in technology-related company valuations may be substantial and may not be temporary in nature. Therefore, our portfolio companies may face considerably more risk of loss than do companies in other industry sectors.
Because of rapid technological change, the average selling prices of products and some services provided by technology-related companies have historically decreased over their productive lives. As a result, the average selling prices of products and services offered by technology-related companies may decrease over time, which could adversely affect their operating results, their ability to meet obligations under their debt securities and the value of their equity securities. This could, in turn, materially adversely affect our business, financial condition and results of operations.
Our investments in sustainable and renewable technology companies are subject to substantial operational risks, such as underestimated cost projections, unanticipated operation and maintenance expenses, loss of government subsidies, and inability to deliver cost-effective alternative energy solutions compared to traditional energy products. In addition, sustainable and renewable technology companies employ a variety of means of increasing cash flow, including increasing utilization of existing facilities, expanding operations through new construction or acquisitions, or securing additional long-term contracts. Thus, some energy companies may be subject to construction risk, acquisition risk or other risks arising from their specific business strategies. Furthermore, production levels for solar, wind and other renewable energies may be dependent upon adequate sunlight, wind, or biogas production, which can vary from market to market and period to period, resulting in volatility in production levels and profitability. Demand for sustainable and renewable technology is also influenced by the available supply and prices for other energy products, such as coal, oil and natural gases. A change in prices in these energy products could reduce demand for alternative energy.
47
A natural disaster may also impact the operations of our portfolio companies, including our technology-related portfolio companies. The nature and level of natural disasters cannot be predicted and may be exacerbated by global climate change. A portion of our technology-related portfolio companies rely on items assembled or produced in areas susceptible to natural disasters, and may sell finished goods into markets susceptible to natural disasters. A major disaster, such as an earthquake, tsunami, flood or other catastrophic event could result in disruption to the business and operations of our technology-related portfolio companies.
We will invest in technology-related companies that are reliant on U.S. and foreign regulatory and governmental programs. Any material changes or discontinuation, due to change in administration or U.S. Congress or otherwise could have a material adverse effect on the operations of a portfolio company in these industries and, in turn, impair our ability to timely collect principal and interest payments owed to us to the extent applicable.
We have invested in and may continue investing in technology-related companies that do not have venture capital or private equity firms as equity investors, and these companies may entail a higher risk of loss than do companies with institutional equity investors, which could increase the risk of loss of your investment.
Our portfolio companies will often require substantial additional equity financing to satisfy their continuing working capital and other cash requirements and, in most instances, to service the interest and principal payments on our investment. Portfolio companies that do not have venture capital or private equity investors may be unable to raise any additional capital to satisfy their obligations or to raise sufficient additional capital to reach the next stage of development. Portfolio companies that do not have venture capital or private equity investors may be less financially sophisticated and may not have access to independent members to serve on their boards, which means that they may be less successful than portfolio companies sponsored by venture capital or private equity firms. Accordingly, financing these types of companies may entail a higher risk of loss than would financing companies that are sponsored by venture capital or private equity firms.
Sustainable and renewable technology companies are subject to extensive government regulation and certain other risks particular to the sectors in which they operate and our business and growth strategy could be adversely affected if government regulations, priorities and resources impacting such sectors change or if our portfolio companies fail to comply with such regulations.
As part of our investment strategy, we plan to invest in portfolio companies in sustainable and renewable technology sectors that may be subject to extensive regulation by foreign, U.S. federal, state and/or local agencies. Changes in existing laws, rules or regulations, or judicial or administrative interpretations thereof, or new laws, rules or regulations could have an adverse impact on the business and industries of our portfolio companies. In addition, changes in government priorities or limitations on government resources could also adversely impact our portfolio companies. We are unable to predict whether any such changes in laws, rules or regulations will occur and, if they do occur, the impact of these changes on our portfolio companies and our investment returns. Furthermore, if any of our portfolio companies fail to comply with applicable regulations, they could be subject to significant penalties and claims that could materially and adversely affect their operations, which would also impact our ability to realize value since our exit from the investment may be subject to the portfolio company obtaining the necessary regulatory approvals. Our portfolio companies may be subject to the expense, delay and uncertainty of the regulatory approval process for their products and, even if approved, these products may not be accepted in the marketplace.
In addition, there is considerable uncertainty about whether foreign, U.S., state and/or local governmental entities will enact or maintain legislation or regulatory programs that mandate reductions in greenhouse gas emissions or provide incentives for sustainable and renewable technology companies. Without such regulatory policies, investments in sustainable and renewable technology companies may not be economical and financing for sustainable and renewable technology companies may become unavailable, which could materially adversely affect the ability of our portfolio companies to repay the debt they owe to us. Any of these factors could materially and adversely affect the operations and financial condition of a portfolio company and, in turn, the ability of the portfolio company to repay the debt they owe to us.
Cyclicality within the energy sector may adversely affect some of our portfolio companies.
Industries within the energy sector are cyclical with fluctuations in commodity prices and demand for, and production of commodities driven by a variety of factors. The highly cyclical nature of the industries within the energy sector may lead to volatile changes in commodity prices, which may adversely affect the earnings of energy companies in which we may invest and the performance and valuation of our portfolio.
48
Depressed oil and natural gas prices for a prolonged period of time could have a material adverse effect on us.
Depressed oil and natural gas prices could adversely affect (i) the credit quality of our debt investments in certain of our portfolio companies and (ii) the underlying operating performance of our portfolio companies’ business that are heavily dependent upon the prices of, and demand for, oil and natural gas. A decrease in credit quality and the operating performance would, in turn, negatively affect the fair value of these investments, which would consequently negatively affect our NAV. Declines in oil and natural gas prices may adversely impact the ability of these portfolio companies to satisfy financial or operating covenants imposed by us or other lenders, thereby negatively impacting their financial condition and their ability to satisfy their debt service and other obligations to us. Likewise, declines in oil and natural gas prices may adversely impact our energy-related portfolio companies’ and other affected companies’ cash flow and their profit generating capacities would also be adversely affected thereby negatively impacting their ability to pay us dividends or distributions on our equity investments.
Our investments in the life sciences industry are subject to extensive government regulation, litigation risk and certain other risks particular to that industry.
We have invested and plan to continue investing in companies in the life sciences industry that are subject to extensive regulation by the FDA and to a lesser extent, other federal, state and other foreign agencies. If any of these portfolio companies fail to comply with applicable regulations, they could be subject to significant penalties and claims that could materially and adversely affect their operations. Portfolio companies that produce medical devices or drugs are subject to the expense, delay and uncertainty of the regulatory approval process for their products and, even if approved, these products may not be accepted in the marketplace. In addition, governmental budgetary constraints effecting the regulatory approval process, new laws, regulations or judicial interpretations of existing laws and regulations might adversely affect a portfolio company in this industry. Portfolio companies in the life sciences industry may also have a limited number of suppliers of necessary components or a limited number of manufacturers for their products, and therefore face a risk of disruption to their manufacturing process if they are unable to find alternative suppliers when needed. Any of these factors could materially and adversely affect the operations of a portfolio company in this industry and, in turn, impair our ability to timely collect principal and interest payments owed to us.
Our investments in the drug discovery industry are subject to numerous risks, including competition, extensive government regulation, product liability and commercial difficulties.
Our investments in the drug discovery industry are subject to numerous risks. The successful and timely implementation of the business model of our drug discovery portfolio companies depends on their ability to adapt to changing technologies and introduce new products. As competitors continue to introduce competitive products, the development and acquisition of innovative products and technologies that improve efficacy, safety, patient’s and clinician’s ease of use and cost-effectiveness are important to the success of such portfolio companies. The success of new product offerings will depend on many factors, including the ability to properly anticipate and satisfy customer needs, obtain regulatory approvals on a timely basis, develop and manufacture products in an economic and timely manner, obtain or maintain advantageous positions with respect to intellectual property, and differentiate products from those of competitors. Failure by our portfolio companies to introduce planned products or other new products or to introduce products on schedule could have a material adverse effect on our business, financial condition and results of operations.
Further, the development of products by drug discovery companies requires significant research and development, clinical trials and regulatory approvals. The results of product development efforts may be affected by a number of factors, including the ability to innovate, develop and manufacture new products, complete clinical trials, obtain regulatory approvals and reimbursement in the U.S. and abroad, or gain and maintain market approval of products. In addition, regulatory review processes by U.S. and foreign agencies may extend longer than anticipated as a result of decreased funding and tighter fiscal budgets. Further, patents attained by others can preclude or delay the commercialization of a product. There can be no assurance that any products now in development will achieve technological feasibility, obtain regulatory approval, or gain market acceptance. Failure can occur at any point in the development process, including after significant funds have been invested. Products may fail to reach the market or may have only limited commercial success because of efficacy or safety concerns, failure to achieve positive clinical outcomes, inability to obtain necessary regulatory approvals, failure to achieve market adoption, limited scope of approved uses, excessive costs to manufacture, the failure to establish or maintain intellectual property rights, or the infringement of intellectual property rights of others.
49
Future legislation, and/or regulations and policies adopted by the FDA or other U.S. or foreign regulatory authorities may increase the time and cost required by some of our portfolio companies to conduct and complete clinical trials for the product candidates that they develop, and there is no assurance that these companies will obtain regulatory approval to market and commercialize their products in the U.S. and in foreign countries.
The FDA has established regulations, guidelines and policies to govern the drug development and approval process, as have foreign regulatory authorities, which affect some of our portfolio companies. Any change in regulatory requirements due to the adoption by the FDA and/or foreign regulatory authorities of new legislation, regulations, or policies may require some of our portfolio companies to amend existing clinical trial protocols or add new clinical trials to comply with these changes. Such amendments to existing protocols and/or clinical trial applications or the need for new ones, may significantly impact the cost, timing and completion of the clinical trials.
In addition, increased scrutiny by the U.S. Congress of the FDA’s and other authorities approval processes may significantly delay or prevent regulatory approval, as well as impose more stringent product labeling and post-marketing testing and other requirements. Foreign regulatory authorities may also increase their scrutiny of approval processes resulting in similar delays. Increased scrutiny and approvals processes may limit the ability of our portfolio companies to market and commercialize their products in the U.S. and in foreign countries.
Life sciences companies, including drug development companies, device manufacturers, service providers and others, are also subject to material pressures when there are changes in the outlook for healthcare insurance markets. The ability for individuals, along with private and public insurers, to account for the costs of paying for healthcare insurance can place strain on the ability of new technology, devices and services to enter those markets, particularly when they are new or untested. As a result, it is not uncommon for changes in the insurance market place to lead to a slower rate of adoption, price pressure and other forces that may materially limit the success of companies bringing such technologies to market. Changes in the health insurance sector might then have an impact on the value of companies in our portfolio or our ability to invest in the sector generally.
Changes in healthcare laws and other regulations, or the enforcement or interpretation of such laws or regulations, applicable to some of our portfolio companies’ businesses may constrain their ability to offer their products and services.
Changes in healthcare or other laws and regulations, or the enforcement or interpretation of such laws or regulations, applicable to the businesses of some of our portfolio companies may occur that could increase their compliance and other costs of doing business, require significant systems enhancements, or render their products or services less profitable or obsolete, any of which could have a material adverse effect on their results of operations. There has also been an increased political and regulatory focus on healthcare laws in recent years, and new legislation could have a material effect on the business and operations of some of our portfolio companies.
Additionally, because of the continued uncertainty surrounding the healthcare industry under the Trump Administration, including the potential for further legal challenges or repeal of existing legislation, we cannot quantify or predict with any certainty the likely impact on our portfolio companies, our business model, prospects, financial condition or results of operations. We also anticipate that Congress, state legislatures, and third-party payors may continue to review and assess alternative healthcare delivery and payment systems and may in the future propose and adopt legislation or policy changes or implementations effecting additional fundamental changes in the healthcare delivery system. We cannot assure you as to the ultimate content, timing, or effect of changes, nor is it possible at this time to estimate the impact of any such potential legislation on certain of our portfolio companies, our business model, prospects, financial condition or results of operations.
Price declines and illiquidity in the corporate debt markets could adversely affect the fair value of our portfolio investments, reducing our NAV through increased net unrealized depreciation.
As a business development company, we are required to carry our investments at market value or, if no market value is ascertainable, at fair market value as determined in good faith by or under the direction of our Board of Directors. As part of the valuation process, we may take into account the following types of factors, if relevant, in determining the fair value of our investments: the enterprise value of a portfolio company (an estimate of the total fair value of the portfolio company’s debt and equity), the nature and realizable value of any collateral, the portfolio company’s ability to make payments and its earnings and discounted cash flow, the markets in which the portfolio company does business, a comparison of the portfolio company’s securities to similar publicly traded securities, changes in the interest rate environment and the credit markets generally that may affect the price at which similar investments may be made in the future and other relevant factors. When an external event such as a purchase transaction, public offering or subsequent equity sale occurs, we use the pricing indicated by the external event to corroborate our valuation. While most of our investments are not publicly traded, applicable accounting standards require us to assume as part of our valuation process that our investments are sold in a principal market to market participants (even if we plan on holding an investment through its maturity). As a result, volatility in the capital markets can also adversely affect our investment valuations. Decreases in the market values or fair values of our investments are recorded as unrealized depreciation. The effect of all of these factors on our portfolio can reduce our NAV by increasing net unrealized depreciation in our portfolio.
50
Depending on market conditions, we could incur substantial realized losses and may suffer substantial unrealized depreciation in future periods, which could have a material adverse impact on our business, financial condition and results of operations.
Economic recessions or slowdowns could impair the ability of our portfolio companies to repay loans, which, in turn, could increase our non-performing assets, decrease the value of our portfolio, reduce our volume of new loans and have a material adverse effect on our results of operations.
Many of our portfolio companies may be susceptible to economic slowdowns or recessions in both the U.S. and foreign countries, and may be unable to repay our loans during such periods. Therefore, during such periods, our non-performing assets are likely to increase and the value of our portfolio is likely to decrease. Adverse economic conditions also may decrease the value of collateral securing some of our loans and the value of our equity investments. Economic slowdowns or recessions could lead to financial losses in our portfolio and a decrease in revenues, net income and assets. Unfavorable economic conditions also could increase our funding costs, limit our access to the capital markets or result in a decision by lenders not to extend credit to us. These events could prevent us from increasing investments and harm our operating results.
In particular, intellectual property owned or controlled by our portfolio companies may constitute an important portion of the value of the collateral of our loans to our portfolio companies. Adverse economic conditions may decrease the demand for our portfolio companies’ intellectual property and consequently its value in the event of a bankruptcy or required sale through a foreclosure proceeding. As a result, our ability to fully recover the amounts owed to us under the terms of the loans may be impaired by such events.
A portfolio company’s failure to satisfy financial or operating covenants imposed by us or other lenders could lead to defaults and, potentially, termination of the portfolio company’s loans and foreclosure on its secured assets, which could trigger cross-defaults under other agreements and jeopardize the portfolio company’s ability to meet its obligations under the debt securities that we hold. We may incur expenses to the extent necessary to seek recovery upon default or to negotiate new terms with a defaulting portfolio company.
Our portfolio companies may be unable to repay or refinance outstanding principal on their loans at or prior to maturity, and rising interests rates may make it more difficult for portfolio companies to make periodic payments on their loans.
Our portfolio companies may be unable to repay or refinance outstanding principal on their loans at or prior to maturity. This risk and the risk of default is increased to the extent that the loan documents do not require the portfolio companies to pay down the outstanding principal of such debt prior to maturity. In addition, if general interest rates rise, there is a risk that our portfolio companies will be unable to pay escalating interest amounts, which could result in a default under their loan documents with us. Any failure of one or more portfolio companies to repay or refinance its debt at or prior to maturity or the inability of one or more portfolio companies to make ongoing payments following an increase in contractual interest rates could have a material adverse effect on our business, financial condition, results of operations and cash flows.
The disposition of our investments may result in contingent liabilities.
We currently expect that a portion of our investments will involve private securities. In connection with the disposition of an investment in private securities, we may be required to make representations about the business and financial affairs of the portfolio company typical of those made in connection with the sale of a business. We may also be required to indemnify the purchasers of such investment to the extent that any such representations turn out to be inaccurate or with respect to certain potential liabilities. These arrangements may result in contingent liabilities that ultimately yield funding obligations that must be satisfied through our return of certain distributions previously made to us.
The health and performance of our portfolio companies could be adversely affected by political and economic conditions in the countries in which they conduct business.
Some of the products of our portfolio companies are developed, manufactured, assembled, tested or marketed outside the U.S. Any conflict or uncertainty in these countries, including due to natural disasters, public health concerns, political unrest or safety concerns, among other things, could harm their business, financial condition and results of operations. In addition, if the government of any country in which their products are developed, manufactured or sold sets technical or regulatory standards for products developed or manufactured in or imported into their country that are not widely shared, it may lead some of their customers to suspend imports of their products into that country, require manufacturers or developers in that country to manufacture or develop products with different technical or regulatory standards and disrupt cross-border manufacturing, marketing or business relationships which, in each case, could harm their businesses.
51
Any unrealized depreciation we experience on our investment portfolio may be an indication of future realized losses, which could reduce our income available for distribution and could impair our ability to service our borrowings.
As a business development company, we are required to carry our investments at market value or, if no market value is ascertainable, at fair value as determined in good faith by our Board of Directors. Decreases in the market values or fair values of our investments will be recorded as unrealized depreciation. Any unrealized depreciation in our investment portfolio could be an indication of a portfolio company’s inability to meet its repayment obligations to us with respect to the affected investments. This could result in realized losses in the future and ultimately in reductions of our income available for distribution in future periods and could materially adversely affect our ability to service our outstanding borrowings.
A lack of IPO or merger and acquisition opportunities may cause companies to stay in our portfolio longer, leading to lower returns, unrealized depreciation, or realized losses.
A lack of IPO or merger and acquisition, or M&A, opportunities for venture capital-backed companies could lead to companies staying longer in our portfolio as private entities still requiring funding. This situation may adversely affect the amount of available funding for early-stage companies in particular as, in general, venture-capital firms are being forced to provide additional financing to late-stage companies that cannot complete an IPO or M&A transaction. In the best case, such stagnation would dampen returns, and in the worst case, could lead to unrealized depreciation and realized losses as some companies run short of cash and have to accept lower valuations in private fundings or are not able to access additional capital at all. A lack of IPO or M&A opportunities for venture capital-backed companies can also cause some venture capital firms to change their strategies, leading some of them to reduce funding of their portfolio companies and making it more difficult for such companies to access capital and to fulfill their potential, which can result in unrealized depreciation and realized losses in such companies by other companies such as ourselves who are co-investors in such companies.
The majority of our portfolio companies will need multiple rounds of additional financing to repay their debts to us and continue operations. Our portfolio companies may not be able to raise additional financing, which could harm our investment returns.
The majority of our portfolio companies will often require substantial additional equity financing to satisfy their continuing working capital and other cash requirements and, in most instances, to service the interest and principal payments on our investment. Each round of venture financing is typically intended to provide a company with only enough capital to reach the next stage of development. We cannot predict the circumstances or market conditions under which our portfolio companies will seek additional capital. It is possible that one or more of our portfolio companies will not be able to raise additional financing or may be able to do so only at a price or on terms unfavorable to us, either of which would negatively impact our investment returns. Some of these companies may be unable to obtain sufficient financing from private investors, public capital markets or traditional lenders. This may have a significant impact if the companies are unable to obtain certain federal, state or foreign agency approval for their products or the marketing thereof, of if regulatory review processes extend longer than anticipated, and the companies need continued funding for their operations during these times. Accordingly, financing these types of companies may entail a higher risk of loss than would financing companies that are able to utilize traditional credit sources.
If the assets securing the loans that we make decrease in value, then we may lack sufficient collateral to cover losses.
To attempt to mitigate credit risks, we will typically take a security interest in the available assets of our portfolio companies. There is no assurance that we will obtain or properly perfect our liens.
There is a risk that the collateral securing our loans may decrease in value over time, may be difficult to sell in a timely manner, may be difficult to appraise and may fluctuate in value based upon the success of the business and market conditions, including as a result of the inability of a portfolio company to raise additional capital. In some circumstances, our lien could be subordinated to claims of other creditors. Consequently, the fact that a loan is secured does not guarantee that we will receive principal and interest payments according to the loan’s terms, or that we will be able to collect on the loan should we be forced to enforce our remedies.
In addition, because we invest in technology-related companies, a substantial portion of the assets securing our investment may be in the form of intellectual property, if any, inventory and equipment and, to a lesser extent, cash and accounts receivable. Intellectual property, if any, that is securing our loan could lose value if, among other things, the company’s rights to the intellectual property are challenged or if the company’s license to the intellectual property is revoked or expires, the technology fails to achieve its intended results or a new technology makes the intellectual property functionally obsolete. Inventory may not be adequate to secure our loan if our valuation of the inventory at the time that we made the loan was not accurate or if there is a reduction in the demand for the inventory.
52
Similarly, any equipment securing our loan may not provide us with the anticipated security if there are changes in technology or advances in new equipment that render the particular equipment obsolete or of limited value, or if the company fails to adequately maintain or repair the equipment. Any one or more of the preceding factors could materially impair our ability to recover earned interest and principal in a foreclosure.
In most cases, we collateralize our investments by obtaining a first priority security interest in a portfolio company’s assets, which may include its intellectual property. In other cases, we may obtain a negative pledge covering a company’s intellectual property. As of December 31, 2018, approximately 85.3% of our debt investments were in a senior secured first lien position, with 48.5% secured by a first priority security in all of the assets of the portfolio company, including its intellectual property, 28.8% secured by a first priority security in all of the assets of the portfolio company and the portfolio company was prohibited from pledging or encumbering its intellectual property. 1.1% of our debt investments were senior secured by the equipment of the portfolio company, and 6.9% were in a first lien “last-out” senior secured position with security interest in all of the assets of the portfolio company, whereby the “last-out” loans will be subordinated to the “first-out” portion of the unitranche loan in a liquidation, sale or other disposition. Another 13.8% of our debt investments were secured by a second priority security interest in all of the portfolio company’s assets, and 0.9% were unsecured.
We may suffer a loss if a portfolio company defaults on a loan and the underlying collateral is not sufficient.
In the event of a default by a portfolio company on a secured loan, we will only have recourse to the assets collateralizing the loan. If the underlying collateral value is less than the loan amount, we will suffer a loss. In addition, we sometimes make loans that are unsecured, which are subject to the risk that other lenders may be directly secured by the assets of the portfolio company. In the event of a default, those collateralized lenders would have priority over us with respect to the proceeds of a sale of the underlying assets. In cases described above, we may lack control over the underlying asset collateralizing our loan or the underlying assets of the portfolio company prior to a default, and as a result the value of the collateral may be reduced by acts or omissions by owners or managers of the assets.
In the event of bankruptcy of a portfolio company, we may not have full recourse to its assets in order to satisfy our loan, or our loan may be subject to “equitable subordination.” This means that depending on the facts and circumstances, including the extent to which we actually provided significant “managerial assistance,” if any, to that portfolio company, a bankruptcy court might re-characterize our debt holding and subordinate all or a portion of our claim to that of other creditors. In addition, certain of our loans are subordinate to other debt of the portfolio company. If a portfolio company defaults on our loan or on debt senior to our loan, or in the event of a portfolio company bankruptcy, our loan will be satisfied only after the senior debt receives payment. Where debt senior to our loan exists, the presence of intercreditor arrangements may limit our ability to amend our loan documents, assign our loans, accept prepayments, exercise our remedies (through “standstill” periods) and control decisions made in bankruptcy proceedings relating to the portfolio company. Bankruptcy and portfolio company litigation can significantly increase collection losses and the time needed for us to acquire the underlying collateral in the event of a default, during which time the collateral may decline in value, causing us to suffer losses.
If the value of collateral underlying our loan declines or interest rates increase during the term of our loan, a portfolio company may not be able to obtain the necessary funds to repay our loan at maturity through refinancing. Decreasing collateral value and/or increasing interest rates may hinder a portfolio company’s ability to refinance our loan because the underlying collateral cannot satisfy the debt service coverage requirements necessary to obtain new financing. If a borrower is unable to repay our loan at maturity, we could suffer a loss which may adversely impact our financial performance.
The inability of our portfolio companies to commercialize their technologies or create or develop commercially viable products or businesses would have a negative impact on our investment returns.
The possibility that our portfolio companies will not be able to commercialize their technology, products or business concepts presents significant risks to the value of our investment. Additionally, although some of our portfolio companies may already have a commercially successful product or product line when we invest, technology-related products and services often have a more limited market- or life-span than have products in other industries. Thus, the ultimate success of these companies often depends on their ability to continually innovate, or raise additional capital, in increasingly competitive markets. Their inability to do so could affect our investment return. In addition, the intellectual property held by our portfolio companies often represents a substantial portion of the collateral, if any, securing our investments. We cannot assure you that any of our portfolio companies will successfully acquire or develop any new technologies, or that the intellectual property the companies currently hold will remain viable. Even if our portfolio companies are able to develop commercially viable products, the market for new products and services is highly competitive and rapidly changing. Neither our portfolio companies nor we have any control over the pace of technology development. Commercial success is difficult to predict, and the marketing efforts of our portfolio companies may not be successful.
53
An investment strategy focused on privately-held companies presents certain challenges, including the lack of available information about these companies, a dependence on the talents and efforts of only a few key portfolio company personnel and a greater vulnerability to economic downturns.
We invest primarily in privately-held companies. Generally, very little public information exists about these companies, and we are required to rely on the ability of our management and investment teams to obtain adequate information to evaluate the potential returns from investing in these companies. Such small, privately held companies as we routinely invest in may also lack quality infrastructures, thus leading to poor disclosure standards or control environments. If we are unable to uncover all material information about these companies, then we may not make a fully informed investment decision, and we may not receive the expected return on our investment or lose some or all of the money invested in these companies.
Also, privately-held companies frequently have less diverse product lines and a smaller market presence than do larger competitors. Privately-held companies are, thus, generally more vulnerable to economic downturns and may experience more substantial variations in operating results than do larger competitors. These factors could affect our investment returns and our results of operations and financial condition.
In addition, our success depends, in large part, upon the abilities of the key management personnel of our portfolio companies, who are responsible for the day-to-day operations of our portfolio companies. Competition for qualified personnel is intense at any stage of a company’s development, and high turnover of personnel is common in technology-related companies. The loss of one or more key managers can hinder or delay a company’s implementation of its business plan and harm its financial condition. Our portfolio companies may not be able to attract and retain qualified managers and personnel. Any inability to do so may negatively impact our investment returns and our results of operations and financial condition.
If our portfolio companies are unable to protect their intellectual property rights, or are required to devote significant resources to protecting their intellectual property rights, then our investments could be harmed.
Our future success and competitive position depend in part upon the ability of our portfolio companies to obtain and maintain proprietary technology used in their products and services, which will often represent a significant portion of the collateral, if any, securing our investment. The portfolio companies will rely, in part, on patent, trade secret and trademark law to protect that technology, but competitors may misappropriate their intellectual property, and disputes as to ownership of intellectual property may arise. Portfolio companies may, from time to time, be required to institute litigation in order to enforce their patents, copyrights or other intellectual property rights, to protect their trade secrets, to determine the validity and scope of the proprietary rights of others or to defend against claims of infringement. Such litigation could result in substantial costs and diversion of resources. Similarly, if a portfolio company is found to infringe upon or misappropriate a third party’s patent or other proprietary rights, that portfolio company could be required to pay damages to such third party, alter its own products or processes, obtain a license from the third party and/or cease activities utilizing such proprietary rights, including making or selling products utilizing such proprietary rights. Any of the foregoing events could negatively affect both the portfolio company’s ability to service our debt investment and the value of any related debt and equity securities that we own, as well as any collateral securing our investment.
We generally will not control our portfolio companies.
In some instances, we may control our portfolio companies or provide our portfolio companies with significant managerial assistance. However, we generally do not, and do not expect to, control the decision making in many of our portfolio companies, even though we may have board representation or board observation rights, and our debt agreements may contain certain restrictive covenants. As a result, we are subject to the risk that a portfolio company in which we invest will make business decisions with which we disagree and the management of such company, as representatives of the holders of their common equity, will take risks or otherwise act in ways that do not serve our interests as debt investors. Due to the lack of liquidity for our investments in non-traded companies, we may not be able to dispose of our interests in our portfolio companies as readily as we would like or at an appropriate valuation. As a result, a portfolio company may make decisions that would decrease the value of our portfolio holdings.
Our financial condition, results of operations and cash flows could be negatively affected if we are unable to recover our principal investment as a result of a negative pledge or lack of a security interest on the intellectual property of our venture growth stage companies.
In some cases, we collateralize our loans with a secured collateral position in a portfolio company's assets, which may include a negative pledge or, to a lesser extent, no security on their intellectual property. In the event of a default on a loan, the intellectual property of the portfolio company will most likely be liquidated to provide proceeds to pay the creditors of the company. There can be no assurance that our security interest, if any, in the proceeds of the intellectual property will be enforceable in a court of law or bankruptcy court or that there will not be others with senior or pari passu credit interests.
54
Our relationship with certain portfolio companies may expose us to our portfolio companies' trade secrets and confidential information which may require us to be parties to non-disclosure agreements and restrict us from engaging in certain transactions.
Our relationship with some of our portfolio companies may expose us to our portfolio companies' trade secrets and confidential information (including transactional data and personal data about their employees and clients) which may require us to be parties to non-disclosure agreements and restrict us from engaging in certain transactions. Unauthorized access or disclosure of such information may occur, resulting in theft, loss or other misappropriation. Any theft, loss, improper use, such as insider trading or other misappropriation of confidential information could have a material adverse impact on our competitive positions, our relationship with our portfolio companies and our reputation and could subject us to regulatory inquiries, enforcement and fines, civil litigation (which may cause us to incur significant expense or expose us to losses) and possible financial liability or costs.
Portfolio company litigation could result in additional costs, the diversion of management time and resources and have an adverse impact on the fair value of our investment.
To the extent that litigation arises with respect to any of our portfolio companies, we may be named as a defendant, which could result in additional costs and the diversion of management time and resources. Furthermore, if we are providing managerial assistance to the portfolio company or have representatives on the portfolio company’s board of directors, our costs and diversion of our management’s time and resources in assessing the portfolio company could be substantial in light of any such litigation regardless of whether we are named as a defendant. In addition, litigation involving a portfolio company may be costly and affect the operations of the portfolio company’s business, which could in turn have an adverse impact on the fair value of our investment in such company.
We may not be able to realize our entire investment on equipment-based loans, if any, in the case of default.
We may from time-to-time provide loans that will be collateralized only by equipment of the portfolio company. If the portfolio company defaults on the loan we would take possession of the underlying equipment to satisfy the outstanding debt. The residual value of the equipment at the time we would take possession may not be sufficient to satisfy the outstanding debt and we could experience a loss on the disposition of the equipment.
Our investments in foreign securities may involve significant risks in addition to the risks inherent in U.S. investments.
Our investment strategy contemplates that a portion of our investments may be in securities of foreign companies. Our total investments at value in foreign companies were approximately $212.3 million or 11.2% of total investments at December 31, 2018. Investing in foreign companies may expose us to additional risks not typically associated with investing in U.S. companies. These risks include changes in exchange control regulations, political and social instability, expropriation, imposition of foreign taxes, less liquid markets and less available information than is generally the case in the U.S., higher transaction costs, less government supervision of exchanges, brokers and issuers, less developed bankruptcy laws, difficulty in enforcing contractual obligations, lack of uniform accounting and auditing standards and greater price volatility, among other things.
If our investments do not meet our performance expectations, you may not receive distributions.
We intend to make distributions on a quarterly basis to our stockholders. We may not be able to achieve operating results that will allow us to make distributions at a specific level or to increase the amount of these distributions from time to time. In addition, due to the asset coverage test applicable to us as a business development company, we may be limited in our ability to make distributions. Also, restrictions and provisions in any future credit facilities may limit our ability to make distributions. As a RIC, if we do not distribute at least a certain percentage of our income each taxable year as dividends for U.S. federal income tax purposes to our stockholders, we will suffer adverse tax consequences, including the inability to be subject to tax as a RIC. We cannot assure you that you will receive distributions at a particular level or at all.
55
We may not have sufficient funds to make follow-on investments. Our decision not to make a follow-on investment may have a negative impact on a portfolio company in need of such an investment or may result in a missed opportunity for us.
After our initial investment in a portfolio company, we may be called upon from time to time to provide additional funds to such company or have the opportunity or need to increase our investment in a successful situation or attempt to preserve or enhance the value of our initial investment, for example, the exercise of a warrant to purchase common stock, or a negative situation, to protect an existing investment. We have the discretion to make any follow-on investments, subject to the availability of capital resources and regulatory considerations. We may elect not to make follow-on investments or otherwise lack sufficient funds to make those investments. Any decision we make not to make a follow-on investment or any inability on our part to make such an investment may have a negative impact on a portfolio company in need of such an investment or may result in a missed opportunity for us to increase our participation in a successful operation and may dilute our equity interest or otherwise reduce the expected yield on our investment. Moreover, a follow-on investment may limit the number of companies in which we can make initial investments. In determining whether to make a follow-on investment, our management will exercise its business judgment and apply criteria similar to those used when making the initial investment. There is no assurance that we will make, or will have sufficient funds to make, follow-on investments and this could adversely affect our success and result in the loss of a substantial portion or all of our investment in a portfolio company.
The lack of liquidity in our investments may adversely affect our business and, if we need to sell any of our investments, we may not be able to do so at a favorable price. As a result, we may suffer losses.
We generally invest in debt securities with terms of up to seven years and hold such investments until maturity, and we do not expect that our related holdings of equity securities will provide us with liquidity opportunities in the near-term. We invest and expect to continue investing in companies whose securities have no established trading market and whose securities are and will be subject to legal and other restrictions on resale or whose securities are and will be less liquid than are publicly-traded securities. The illiquidity of these investments may make it difficult for us to sell these investments when desired. In addition, if we are required to liquidate all or a portion of our portfolio quickly, we may realize significantly less than the value at which we had previously recorded these investments. As a result, we do not expect to achieve liquidity in our investments in the near-term. However, to maintain our qualification as a business development company and as a RIC, we may have to dispose of investments if we do not satisfy one or more of the applicable criteria under the respective regulatory frameworks.
Our portfolio companies may incur debt or issue equity securities that rank equally with, or senior to, our investments in such companies.
We invest primarily in debt securities issued by our portfolio companies. In some cases, portfolio companies will be permitted to incur other debt, or issue other equity securities, that rank equally with, or senior to, our investment. Such instruments may provide that the holders thereof are entitled to receive payment of distributions, interest or principal on or before the dates on which we are entitled to receive payments in respect of our investments. These debt instruments would usually prohibit the portfolio companies from paying interest on or repaying our investments in the event and during the continuance of a default under such debt. Also, in the event of insolvency, liquidation, dissolution, reorganization or bankruptcy of a portfolio company, holders of securities ranking senior to our investment in that portfolio company would typically be entitled to receive payment in full before we receive any distribution in respect of our investment. After repaying such holders, the portfolio company might not have any remaining assets to use for repaying its obligation to us. In the case of securities ranking equally with our investments, we would have to share on a pari passu basis any distributions with other security holders in the event of an insolvency, liquidation, dissolution, reorganization or bankruptcy of the relevant portfolio company.
The rights we may have with respect to the collateral securing any junior priority loans we make to our portfolio companies may also be limited pursuant to the terms of one or more intercreditor agreements that we enter into with the holders of senior debt. Under such an intercreditor agreement, at any time that senior obligations are outstanding, we may forfeit certain rights with respect to the collateral to the holders of the senior obligations. These rights may include the right to commence enforcement proceedings against the collateral, the right to control the conduct of such enforcement proceedings, the right to approve amendments to collateral documents, the right to release liens on the collateral and the right to waive past defaults under collateral documents. We may not have the ability to control or direct such actions, even if as a result our rights as junior lenders are adversely affected.
56
Our warrant and equity-related investments are highly speculative, and we may not realize gains from these investments. If our warrant and equity-related investments do not generate gains, then the return on our invested capital will be lower than it would otherwise be, which could result in a decline in the value of shares of our common stock.
When we invest in debt securities, we generally expect to acquire warrants or other equity-related securities as well. Our goal is ultimately to dispose of these equity interests and realize gains upon disposition of such interests. Over time, the gains that we realize on these equity interests may offset, to some extent, losses that we experience on defaults under debt and other securities that we hold. However, the equity interests that we receive may not appreciate in value and, in fact, may decline in value. Accordingly, we may not be able to realize gains from our equity interests, and any gains that we do realize on the disposition of any equity interests may not be sufficient to offset any other losses that we experience. In addition, we anticipate that approximately 50% of our warrants may not realize and exit or generate any returns. Furthermore, because of the financial reporting requirements under U.S. generally accepted accounting principles, or U.S. GAAP, of those approximately 50% of warrants that we do not realize and exit, the assigned costs to the initial warrants may lead to realized write-offs when the warrants either expire or are not exercised.
Prepayments of our debt investments by our portfolio companies could adversely impact our results of operations and reduce our return on equity.
During the year ended December 31, 2018, we received debt investment early principal repayments and pay down of working capital debt investments of approximately $576.7 million. We are subject to the risk that the investments we make in our portfolio companies may be repaid prior to maturity. When this occurs, we will generally reinvest these proceeds in temporary investments, pending their future investment in new portfolio companies. These temporary investments will typically have substantially lower yields than the debt being prepaid and we could experience significant delays in reinvesting these amounts. Any future investment in a new portfolio company may also be at lower yields than the debt that was repaid. As a result, our results of operations could be materially adversely affected if one or more of our portfolio companies elect to prepay amounts owed to us. Additionally, prepayments could negatively impact our return on equity, which could result in a decline in the market price of our common stock.
We may choose to waive or defer enforcement of covenants in the debt securities held in our portfolio, which may cause us to lose all or part of our investment in these companies.
We structure the debt investments in our portfolio companies to include business and financial covenants placing affirmative and negative obligations on the operation of the company’s business and its financial condition. However, from time to time we may elect to waive breaches of these covenants, including our right to payment, or waive or defer enforcement of remedies, such as acceleration of obligations or foreclosure on collateral, depending upon the financial condition and prospects of the particular portfolio company. These actions may reduce the likelihood of receiving the full amount of future payments of interest or principal and be accompanied by a deterioration in the value of the underlying collateral as many of these companies may have limited financial resources, may be unable to meet future obligations and may go bankrupt. This could negatively impact our ability to pay distributions, could adversely affect our results of operation and financial condition and cause the loss of all or part of your investment.
We may also be subject to lender liability claims for actions taken by us with respect to a borrower’s business or instances where we exercise control over the borrower. It is possible that we could become subject to a lender’s liability claim, including as a result of actions taken in rendering significant managerial assistance or actions to compel and collect payments from the borrower outside the ordinary course of business.
Our loans could be subject to equitable subordination by a court which would increase our risk of loss with respect to such loans or we could be subject to lender liability claims.
Courts may apply the doctrine of equitable subordination to subordinate the claim or lien of a lender against a borrower to claims or liens of other creditors of the borrower, when the lender or its affiliates is found to have engaged in unfair, inequitable or fraudulent conduct. The courts have also applied the doctrine of equitable subordination when a lender or its affiliates is found to have exerted inappropriate control over a client, including control resulting from the ownership of equity interests in a client or providing of significant managerial assistance. We have made direct equity investments or received warrants in connection with loans. These investments represent approximately 7.8% of the outstanding value of our investment portfolio as of December 31, 2018. Payments on one or more of our loans, particularly certain loans to clients in which we also hold equity interests, may be subject to claims of equitable subordination. If we were deemed to have the ability to control or otherwise exercise influence over the business and affairs of one or more of our portfolio companies resulting in economic hardship to other creditors of that company, this control or influence may constitute grounds for equitable subordination and a court may treat one or more of our loans as if it were unsecured or common equity in the portfolio company. In that case, if the portfolio company were to liquidate, we would be entitled to repayment of our loan on a pro-rata basis with other unsecured debt or, if the effect of subordination was to place us at the level of common equity, then on an equal basis with other holders of the portfolio company’s common equity only after all of its obligations relating to its debt and preferred securities had been satisfied.
57
In addition to these risks, in the event we elect to convert our debt position to equity, or otherwise take control of a portfolio company (such as through placing a member of our management team on its board of directors), as part of a restructuring, we face additional risks acting in that capacity. It is not uncommon for unsecured, or otherwise unsatisfied creditors, to sue parties that elect to use their debt positions to later control a company following a restructuring or bankruptcy. Apart from lawsuits, key customers and suppliers might act in a fashion contrary to the interests of a portfolio company if they were left unsatisfied in a restructuring or bankruptcy. Any combination of these factors might lead to the loss in value of a company subject to such activity and may divert the time and attention of our management team and investment team to help to address such issues in a portfolio company.
The potential inability of our portfolio companies’ in the healthcare industry to charge desired prices with respect to prescription drugs could impact their revenues and in turn their ability to repay us.
Some of our portfolio companies in the healthcare industry are subject to risks associated with the pricing for prescription drugs. It is uncertain whether customers of our healthcare industry portfolio companies will continue to utilize established prescription drug pricing methods, or whether other pricing benchmarks will be adopted for establishing prices within the industry. Legislation may lead to changes in the pricing for Medicare and Medicaid programs. Regulators have conducted investigations into the use of prescription drug pricing methods for federal program payment, and whether such methods have inflated drug expenditures by the Medicare and Medicaid programs. Federal and state proposals have sought to change the basis for calculating payment of certain drugs by the Medicare and Medicaid programs. Additionally, President Trump has taken actions and made statements that suggest he plans to seek repeal of all or portions of the Affordable Care Act, or the ACA. There is currently uncertainty with respect to the impact any such repeal may have and any resulting changes may take time to unfold, which could have an impact on coverage and reimbursement for healthcare items and services covered by plans that were authorized by the ACA. We cannot predict the ultimate content, timing or effect of any such legislation or executive action or the impact of potential legislation or executive action on us. Any changes to the method for calculating prescription drug costs may reduce the revenues of our portfolio companies in the healthcare industry which could in turn impair their ability to timely make any principal and interest payments owed to us.
Risks Related to Our Securities
Investing in shares of our common stock involves an above average degree of risk.
The investments we make in accordance with our investment objective may result in a higher amount of risk, volatility or loss of principal than alternative investment options. Our investments in portfolio companies may be highly speculative and aggressive, and therefore, an investment in our common stock may not be suitable for investors with lower risk tolerance.
Our common stock may trade below its NAV per share, which limits our ability to raise additional equity capital.
If our common stock is trading below its NAV per share, we will generally not be able to issue additional shares of our common stock at its market price without first obtaining the approval for such issuance from our stockholders and our independent directors. If our common stock trades below NAV, the higher cost of equity capital may result in it being unattractive to raise new equity, which may limit our ability to grow. The risk of trading below NAV is separate and distinct from the risk that our NAV per share may decline. We cannot predict whether shares of our common stock will trade above, at or below our NAV.
Provisions of our charter and bylaws could deter takeover attempts and have an adverse impact on the price of our common stock.
Our charter and bylaws contain provisions that may have the effect of discouraging, delaying, or making difficult a change in control of our company or the removal of our incumbent directors. Under our charter, our Board of Directors is divided into three classes serving staggered terms, which will make it more difficult for a hostile bidder to acquire control of us. In addition, our Board of Directors may, without stockholder action, authorize the issuance of shares of stock in one or more classes or series, including preferred stock. Subject to compliance with the 1940 Act, our Board of Directors may, without stockholder action, amend our charter to increase the number of shares of stock of any class or series that we have authority to issue. The existence of these provisions, among others, may have a negative impact on the price of our common stock and may discourage third party bids for ownership of our company. These provisions may prevent any premiums being offered to you for shares of our common stock in connection with a takeover.
58
Sales of substantial amounts of our common stock in the public market may have an adverse effect on the market price of our common stock.
Sales of substantial amounts of our common stock, or the availability of such common stock for sale (including as a result of the conversion of our 2022 Convertible Notes, issued in January 2017, into common stock), could adversely affect the prevailing market prices for our common stock, which may also lead to further dilution of our earnings per share. If this occurs and continues, it could impair our ability to raise additional capital through the sale of securities should we desire to do so.
We may periodically obtain the approval of our stockholders to issue shares of our common stock at prices below the then current NAV per share of our common stock. If we receive such approval from the stockholders, we may issue shares of our common stock at a price below the then current NAV per share of common stock. Any such issuance could materially dilute your interest in our common stock and reduce our NAV per share.
We may periodically obtain the approval of our stockholders to issue shares of our common stock at prices below the then current NAV per share of our common stock. Such approval has allowed and may again allow us to access the capital markets in a way that we typically are unable to do as a result of restrictions that, absent stockholder approval, apply to business development companies under the 1940 Act. Any decision to sell shares of our common stock below the then current NAV per share of our common stock is subject to the determination by our Board of Directors that such issuance and sale is in our and our stockholders’ best interests.
Any sale or other issuance of shares of our common stock at a price below NAV per share has resulted and will continue to result in an immediate dilution to your interest in our common stock and a reduction of our NAV per share. This dilution would occur as a result of a proportionately greater decrease in a stockholder’s interest in our earnings and assets and voting interest in us than the increase in our assets resulting from such issuance. Because the number of future shares of common stock that may be issued below our NAV per share and the price and timing of such issuances are not currently known, we cannot predict the actual dilutive effect of any such issuance. We also cannot determine the resulting reduction in our NAV per share of any such issuance at this time. We caution you that such effects may be material, and we undertake to describe all the material risks and dilutive effects of any offering that we make at a price below our then current NAV in the future in a prospectus supplement issued in connection with any such offering. We cannot predict whether shares of our common stock will trade above, at or below our NAV.
If we conduct an offering of our common stock at a price below NAV, investors are likely to incur immediate dilution upon the closing of the offering.
We are not generally able to issue and sell our common stock at a price below NAV per share. We may, however, sell our common stock, at a price below the current NAV of the common stock, or sell warrants, options or other rights to acquire such common stock, at a price below the current NAV of the common stock if our Board of Directors determines that such sale is in our best interests and the best interests of our stockholders and our stockholders have approved the practice of making such sales.
In connection with the receipt of such stockholder approval, we will limit the number of shares that it issues at a price below NAV pursuant to this authorization so that the aggregate dilutive effect on our then outstanding shares will not exceed 20%. Our Board of Directors, subject to its fiduciary duties and regulatory requirements, has the discretion to determine the amount of the discount, and as a result, the discount could be up to 100% of NAV per share. If we were to issue shares at a price below NAV, such sales would result in an immediate dilution to existing common stockholders, which would include a reduction in the NAV per share as a result of the issuance. This dilution would also include a proportionately greater decrease in a stockholder’s interest in our earnings and assets and voting interest in us than the increase in our assets resulting from such issuance.
In addition, if we determined to conduct additional offerings in the future there may be even greater dilution if we determine to conduct such offerings at prices below NAV. As a result, investors will experience further dilution and additional discounts to the price of our common stock. Because the number of shares of common stock that could be so issued and the timing of any issuance is not currently known, the actual dilutive effect of an offering cannot be predicted. We did not sell any of our securities at a price below NAV during the year ended December 31, 2018.
We may allocate the net proceeds from an offering in ways with which you may not agree.
We have significant flexibility in investing the net proceeds of an offering and may use the net proceeds from an offering in ways with which you may not agree or for purposes other than those contemplated at the time of the offering.
59
If we issue preferred stock, debt securities or convertible debt securities, the NAV and market value of our common stock may become more volatile.
We cannot assure you that the issuance of preferred stock and/or debt securities would result in a higher yield or return to the holders of our common stock. The issuance of preferred stock, debt securities or convertible debt would likely cause the NAV and market value of our common stock to become more volatile. If the distribution rate on the preferred stock, or the interest rate on the debt securities, were to approach the net rate of return on our investment portfolio, the benefit of leverage to the holders of our common stock would be reduced. If the distribution rate on the preferred stock, or the interest rate on the debt securities, were to exceed the net rate of return on our portfolio, the use of leverage would result in a lower rate of return to the holders of common stock than if we had not issued the preferred stock or debt securities. Any decline in the NAV of our investment would be borne entirely by the holders of our common stock. Therefore, if the market value of our portfolio were to decline, the leverage would result in a greater decrease in NAV to the holders of our common stock than if we were not leveraged through the issuance of preferred stock. This decline in NAV would also tend to cause a greater decline in the market price for our common stock.
There is also a risk that, in the event of a sharp decline in the value of our net assets, we would be in danger of failing to maintain required asset coverage ratios which may be required by the preferred stock, debt securities, convertible debt or units or of a downgrade in the ratings of the preferred stock, debt securities, convertible debt or our current investment income might not be sufficient to meet the distribution requirements on the preferred stock or the interest payments on the debt securities. If we do not maintain our required asset coverage ratios, we may not be permitted to declare dividend distributions. In order to counteract such an event, we might need to liquidate investments in order to fund redemption of some or all of the preferred stock, debt securities or convertible debt. In addition, we would pay (and the holders of our common stock would bear) all costs and expenses relating to the issuance and ongoing maintenance of the preferred stock, debt securities, convertible debt or any combination of these securities. Holders of preferred stock, debt securities, convertible debt or any combination of these securities may have different interests than holders of common stock and may at times have disproportionate influence over our affairs.
Holders of any preferred stock that we may issue will have the right to elect members of the Board of Directors and have class voting rights on certain matters.
The 1940 Act requires that holders of shares of preferred stock must be entitled as a class to elect two directors at all times and to elect a majority of the directors if distributions on such preferred stock are in arrears by two years or more, until such arrearage is eliminated. In addition, certain matters under the 1940 Act require the separate vote of the holders of any issued and outstanding preferred stock, including changes in fundamental investment restrictions and conversion to open-end status and, accordingly, preferred stockholders could veto any such changes. Restrictions imposed on the declarations and payment of dividends or other distributions to the holders of our common stock and preferred stock, both by the 1940 Act and by requirements imposed by rating agencies, might impair our ability to maintain our ability to be subject to tax as a RIC.
Terms relating to redemption may materially adversely affect your return on any debt securities that we may issue.
If you are holding debt securities issued by us and such securities are redeemable at our option, we may choose to redeem your debt securities at times when prevailing interest rates are lower than the interest rate paid on your debt securities. In addition, if you are holding debt securities issued by us and such securities are subject to mandatory redemption, we may be required to redeem your debt securities at times when prevailing interest rates are lower than the interest rate paid on your debt securities. In this circumstance, you may not be able to reinvest the redemption proceeds in a comparable security at an effective interest rate as high as your debt securities being redeemed.
On October 24, 2017, our Board of Directors approved a redemption of $75.0 million of the outstanding aggregate principal amount of the 2024 Notes, which were redeemed on November 23, 2017. On February 9, 2018, our Board of Directors approved a redemption of $100.0 million of the outstanding aggregate principal amount of the 2024 Notes, which were redeemed on April 2, 2018. Further, on December 7, 2018, our Board of Directors approved a full redemption, in two equal transactions, of $83.5 million of the outstanding aggregate principal amount of the 2024 Notes. The 2024 Notes were fully redeemed on January 14, 2019 and February 4, 2019. We may redeem the 2022 Notes after September 23, 2022, the 2025 Notes after April 30, 2021, and the 2033 Notes after October 30, 2033 at a redemption price of 100% of the outstanding principal amount thereof plus accrued and unpaid interest payments. If we choose to redeem the 2022 Notes, 2025 Notes, or 2033 Notes when the fair market value of the 2022 Notes, 2025 Notes, or 2033 Notes is above par value, you would experience a loss of any potential premium.
Our shares may trade at discounts from NAV or at premiums that are unsustainable over the long term.
Shares of business development companies may trade at a market price that is less than the NAV that is attributable to those shares. Our shares have historically traded above and below our NAV. The possibility that our shares of common stock will trade at a discount from NAV or at a premium that is unsustainable over the long term is separate and distinct from the risk that our NAV may decrease. It is not possible to predict whether our shares will trade at, above or below NAV in the future.
60
Our credit ratings may not reflect all risks of an investment in our debt securities.
Our credit ratings are an assessment by third parties of our ability to pay our obligations. Consequently, real or anticipated changes in our credit ratings will generally affect the market value of our debt securities. Our credit ratings, however, may not reflect the potential impact of risks related to market conditions generally or other factors discussed herein on the market value of or trading market for the publicly issued debt securities.
A downgrade, suspension or withdrawal of the credit rating assigned by a rating agency to us or our debt securities, if any, or change in the debt markets could cause the liquidity or market value of our debt securities to decline significantly.
Our credit ratings are an assessment by rating agencies of our ability to pay our debts when due. Consequently, real or anticipated changes in our credit ratings will generally affect the market value of our outstanding debt and equity securities. These credit ratings may not reflect the potential impact of risks relating to the structure or marketing of such debt and equity securities. Credit ratings are not a recommendation to buy, sell or hold any security, and may be revised or withdrawn at any time by the issuing organization in its sole discretion.
Neither we nor any underwriter undertakes any obligation to maintain our credit ratings or to advise holders of our debt and equity securities of any changes in our credit ratings. There can be no assurance that a credit rating will remain for any given period of time or that such credit ratings will not be lowered or withdrawn entirely if future circumstances relating to the basis of the credit rating, such as adverse changes in our company, so warrant. An increase in the competitive environment, inability to cover distributions, or increase in leverage could lead to a downgrade in our credit ratings and limit our access to the debt and equity markets capability impairing our ability to grow the business. The conditions of the financial markets and prevailing interest rates have fluctuated in the past and are likely to fluctuate in the future.
Investors in offerings of our common stock will likely incur immediate dilution upon the closing of an offering.
We generally expect the public offering price of any offering of shares of our common stock to be higher than the book value per share of our outstanding common stock (unless we offer shares pursuant to a rights offering or after obtaining prior approval for such issuance from our stockholders and our independent directors). Accordingly, investors purchasing shares of common stock in offerings may pay a price per share that exceeds the tangible book value per share after such offering. We currently have an incentive plan and may in the future implement additional incentive plans or retention plans. To the extent equity is issued under any of these plans, stockholders’ ownership interest will be diluted.
Our stockholders may experience dilution upon the conversion of our 2022 Convertible Notes.
Our 2022 Convertible Notes, issued in January 2017, are convertible into shares of our common stock beginning on August 1, 2021 or, under certain circumstances, earlier. Upon conversion of the 2022 Convertible Notes, we have the choice to pay or deliver, as the case may be, at our election, cash, shares of our common stock or a combination of cash and shares of our common stock. The initial conversion price of the 2022 Convertible Notes is $16.41, subject to adjustment in certain circumstances. If we elect to deliver shares of common stock upon a conversion at the time our NAV per share exceeds the conversion price in effect at such time, our stockholders may incur dilution. In addition, our stockholders will experience dilution in their ownership percentage of common stock upon our issuance of common stock in connection with the conversion of the 2022 Convertible Notes and any distributions paid on our common stock will also be paid on shares issued in connection with such conversion after such issuance.
Our stockholders will experience dilution in their ownership percentage if they opt out of our dividend reinvestment plan.
All distributions in cash payable to stockholders that are participants in our dividend reinvestment plan are automatically reinvested in shares of our common stock. As a result, our stockholders that opt out of our dividend reinvestment plan will experience dilution in their ownership percentage of our common stock over time.
Our distribution proceeds may exceed our earnings. Therefore, portions of the distributions that we make may represent a return of capital to stockholders, which will lower their tax basis in their shares.
The tax treatment and characterization of our distributions may vary significantly from time to time due to the nature of our investments. The ultimate tax characterization of our distributions made during a taxable year generally will not finally be determined until after the end of that taxable year. We may make distributions during a taxable year that exceed our investment company taxable income, determined without regard to any deduction for dividends paid, and net capital gains for that taxable year. In such a situation, the amount by which our total distributions exceed investment company taxable income, determined without regard to any deduction for dividends paid, and net capital gains generally would be treated as a return of capital up to the amount of a stockholder’s tax basis in the shares, with any amounts exceeding such tax basis generally treated as a gain from the sale or exchange of such shares. A return of capital generally is a return of a stockholder’s investment rather than a return of earnings or gains derived from our investment
61
activities. Moreover, we may pay all or a substantial portion of our distributions from the proceeds of the sale of shares of our common stock or from borrowings in anticipation of future cash flow, which could constitute a return of stockholders’ capital and will lower such stockholders’ tax basis in our shares, which may result in increased tax liability to stockholders when they sell such shares. The tax liability to stockholders upon the sale of shares may increase even if such shares are sold at a loss.
Our common stock price has been and continues to be volatile and may decrease substantially.
As with any company, the price of our common stock will fluctuate with market conditions and other factors, which include, but are not limited to, the following:
|
|
• |
price and volume fluctuations in the overall stock market from time to time; |
|
|
• |
significant volatility in the market price and trading volume of securities of RICs, business development companies or other financial services companies; |
|
|
• |
any inability to deploy or invest our capital; |
|
|
• |
fluctuations in interest rates; |
|
|
• |
any shortfall in revenue or net income or any increase in losses from levels expected by investors or securities analysts; |
|
|
• |
the financial performance of specific industries in which we invest in on a recurring basis; |
|
|
• |
announcement of strategic developments, acquisitions, and other material events by us or our competitors, or operating performance of companies comparable to us; |
|
|
• |
changes in regulatory policies or tax guidelines with respect to RICs, SBICs or business development companies; |
|
|
• |
losing our ability to either qualify or be subject to U.S. federal income tax as a RIC; |
|
|
• |
actual or anticipated changes in our earnings or fluctuations in our operating results, or changes in the expectations of securities analysts; |
|
|
• |
changes in the value of our portfolio of investments; |
|
|
• |
realized losses in investments in our portfolio companies; |
|
|
• |
general economic conditions and trends; |
|
|
• |
inability to access the capital markets; |
|
|
• |
loss of a major funded source; or |
|
|
• |
departure of key personnel. |
In the past, following periods of volatility in the market price of a company’s securities, securities class action litigation has often been brought against that company. Due to the potential volatility of our stock price, we may be the target of securities litigation in the future. Securities litigation could result in substantial costs and could divert management’s attention and resources from our business.
We may be unable to invest a significant portion of the net proceeds from an offering or from exiting an investment or other capital on acceptable terms, which could harm our financial condition and operating results.
Delays in investing the net proceeds raised in an offering or from exiting an investment or other capital may cause our performance to be worse than that of other fully invested business development companies or other lenders or investors pursuing comparable investment strategies. We cannot assure you that we will be able to identify any investments that meet our investment objective or that any investment that we make will produce a positive return. We may be unable to invest the net proceeds of any offering or from exiting an investment or other capital on acceptable terms within the time period that we anticipate or at all, which could harm our financial condition and operating results.
62
We anticipate that, depending on market conditions and the amount of the capital, it may take us a substantial period of time to invest substantially all the capital in securities meeting our investment objective. During this period, we will invest the capital primarily in cash equivalents, U.S. government securities and other high-quality debt investments that mature in one year or less or use the net proceeds from such offerings to reduce then-outstanding debt obligations, which may produce returns that are significantly lower than the returns which we expect to achieve when our portfolio is fully invested in securities meeting our investment objective. As a result, any distributions that we pay during such period may be substantially lower than the distributions that we may be able to pay when our portfolio is fully invested in securities meeting our investment objective. In addition, until such time as the net proceeds of any offering or from exiting an investment or other capital are invested in new securities meeting our investment objective, the market price for our securities may decline. Thus, the initial return on your investment may be lower than when, if ever, our portfolio is fully invested in securities meeting our investment objective.
Your interest in us may be diluted if you do not fully exercise your subscription rights in any rights offering. In addition, if the subscription price is less than our NAV per share, then you will experience an immediate dilution of the aggregate NAV of your shares.
In the event we issue subscription rights, stockholders who do not fully exercise their subscription rights should expect that they will, at the completion of a rights offering, own a smaller proportional interest in us than would otherwise be the case if they fully exercised their rights. We cannot state precisely the amount of any such dilution in share ownership because we do not know at this time what proportion of the shares will be purchased as a result of such rights offering.
In addition, if the subscription price is less than the NAV per share of our common stock, then our stockholders would experience an immediate dilution of the aggregate NAV of their shares as a result of the offering. The amount of any decrease in NAV is not predictable because it is not known at this time what the subscription price and NAV per share will be on the expiration date of a rights offering or what proportion of the shares will be purchased as a result of such rights offering. Such dilution could be substantial.
The trading market or market value of our publicly issued debt securities may fluctuate.
Our publicly issued debt securities may or may not have, and may never develop, an established trading market. In addition to our creditworthiness, many factors may materially adversely affect the trading market for, and market value of, our publicly issued debt securities. These factors include, but are not limited to, the following:
|
|
• |
the time remaining to the maturity of these debt securities; |
|
|
• |
the outstanding principal amount of debt securities with terms identical to these debt securities; |
|
|
• |
the ratings assigned by national statistical ratings agencies; |
|
|
• |
the general economic environment; |
|
|
• |
the supply of debt securities trading in the secondary market, if any; |
|
|
• |
the redemption or repayment features, if any, of these debt securities; |
|
|
• |
the level, direction and volatility of market interest rates generally; and |
|
|
• |
market rates of interest higher or lower than rates borne by the debt securities. You should also be aware that there may be a limited number of buyers when you decide to sell your debt securities. This too may materially adversely affect the market value of the debt securities or the trading market for the debt securities. |
The 2022 Notes, 2025 Notes, 2033 Notes, and 2022 Convertible Notes are unsecured and therefore are effectively subordinated to any secured indebtedness we have currently incurred or may incur in the future.
The 2022 Notes, 2025 Notes, 2033 Notes, and 2022 Convertible Notes are not secured by any of our assets or any of the assets of our subsidiaries. As a result, while the 2022 Notes, 2025 Notes, 2033 Notes, and 2022 Convertible Notes remain senior in priority to our equity securities, they are effectively subordinated to any secured indebtedness we or our subsidiaries have currently incurred and may incur in the future (or any indebtedness that is initially unsecured to which we subsequently grant security) to the extent of the value of the assets securing such indebtedness. In any liquidation, dissolution, bankruptcy or other similar proceeding, the holders of any of our existing or future secured indebtedness and the secured indebtedness of our subsidiaries may assert rights against the assets pledged to secure that indebtedness in order to receive full payment of their indebtedness before the assets may be used to pay other creditors, including the holders of the 2022 Notes, 2025 Notes, 2033 Notes, and 2022 Convertible Notes.
63
The 2022 Notes, 2025 Notes, 2033 Notes, and 2022 Convertible Notes are structurally subordinated to the indebtedness and other liabilities of our subsidiaries.
The 2022 Notes, 2025 Notes, 2033 Notes, and 2022 Convertible Notes are obligations exclusively of Hercules Capital, Inc. and not of any of our subsidiaries. None of our subsidiaries are or act as guarantors of the 2022 Notes, 2025 Notes, 2033 Notes, and 2022 Convertible Notes and the 2022 Notes, 2025 Notes, 2033 Notes, and 2022 Convertible Notes are not required to be guaranteed by any subsidiaries we may acquire or create in the future. Our secured indebtedness with respect to the SBA debentures is held through our SBIC subsidiary. The assets of any such subsidiary are not directly available to satisfy the claims of our creditors, including holders of the 2022 Notes, 2025 Notes, 2033 Notes, and 2022 Convertible Notes.
Except to the extent we are a creditor with recognized claims against our subsidiaries, all claims of creditors (including holders of preferred stock, if any, of our subsidiaries) will have priority over our equity interests in such subsidiaries (and therefore the claims of our creditors, including holders of the 2022 Notes, 2025 Notes, 2033 Notes, and 2022 Convertible Notes) with respect to the assets of such subsidiaries. Even if we are recognized as a creditor of one or more of our subsidiaries, our claims would still be subordinated to any security interests in the assets of any such subsidiary and to any indebtedness or other liabilities of any such subsidiary senior to our claims. As a result of not having a direct claim against any of our subsidiaries, the 2022 Notes, 2025 Notes, 2033 Notes, and 2022 Convertible Notes are structurally subordinated to all indebtedness and other liabilities (including trade payables) of our subsidiaries and any subsidiaries that we may in the future acquire or establish as financing vehicles or otherwise. In addition, our subsidiaries may incur substantial additional indebtedness in the future, all of which would be structurally senior to the 2022 Notes, 2025 Notes, 2033 Notes, and 2022 Convertible Notes.
The respective indentures under which the 2022 Notes, 2025 Notes, 2033 Notes, and 2022 Convertible Notes were issued contain limited protections for the holders of the 2022 Notes, 2025 Notes, 2033 Notes, and 2022 Convertible Notes.
The indenture under which 2022 Notes, 2025 Notes, 2033 Notes, and 2022 Convertible Notes were issued offers limited protections to the holders of the 2022 Notes, 2025 Notes, 2033 Notes, and 2022 Convertible Notes. The terms of the respective indentures and the 2022 Notes, 2025 Notes, 2033 Notes, and 2022 Convertible Notes do not restrict our or any of our subsidiaries’ ability to engage in, or otherwise be a party to, a variety of corporate transactions, circumstances or events that could have an adverse impact on an investment in the 2022 Notes, 2025 Notes, 2033 Notes, or 2022 Convertible Notes. In particular, the terms of the respective indentures and the 2022 Notes, 2025 Notes, 2033 Notes, and 2022 Convertible Notes do not place any restrictions on our or our subsidiaries’ ability to:
|
|
• |
|
issue securities or otherwise incur additional indebtedness or other obligations, including (1) any indebtedness or other obligations that would be equal in right of payment to the 2022 Notes, 2025 Notes, 2033 Notes, or 2022 Convertible Notes, (2) any indebtedness or other obligations that would be secured and therefore rank effectively senior in right of payment to the 2022 Notes, 2025 Notes, 2033 Notes, or 2022 Convertible Notes to the extent of the values of the assets securing such debt, (3) indebtedness of ours that is guaranteed by one or more of our subsidiaries and which therefore would rank structurally senior to the 2022 Notes, 2025 Notes, 2033 Notes, or 2022 Convertible Notes and (4) securities, indebtedness or other obligations issued or incurred by our subsidiaries that would be senior in right of payment to our equity interests in our subsidiaries and therefore would rank structurally senior in right of payment to the 2022 Notes, 2025 Notes, 2033 Notes, or 2022 Convertible Notes with respect to the assets of our subsidiaries, in each case other than an incurrence of indebtedness or other obligation that would cause a violation of Section 18(a)(1)(A) as modified by Section 61(a)(1) of the 1940 Act or any successor provisions, whether or not we continue to be subject to such provisions of the 1940 Act, but giving effect to any exemptive relief granted to us by the SEC (currently, these provisions generally prohibit us from making additional borrowings, including through the issuance of additional debt or the sale of additional debt securities, unless our asset coverage, as defined in the 1940 Act, equals at least 150% thereafter after such borrowings); |
|
|
• |
|
pay distributions on, or purchase or redeem or make any payments in respect of, capital stock or other securities ranking junior in right of payment to the 2022 Notes, 2025 Notes, 2033 Notes, or 2022 Convertible Notes, in each case other than distributions, purchases, redemptions or payments that would cause a violation of Section 18(a)(1)(B) as modified by Section 61(a)(1) of the 1940 Act or any successor provisions, giving effect to (i) any exemptive relief granted to us by the SEC and (ii) no-action relief granted by the SEC to another business development company (or to us if we determine to seek such similar no-action or other relief) permitting the business development company to declare any cash distribution notwithstanding the prohibition contained in Section 18(a)(1)(B) as modified by Section 61(a)(1) of the 1940 Act in order to maintain the business development company’s status as a RIC under Subchapter M of the Code (currently, these provisions generally prohibit us from declaring any cash dividend or distribution upon any class of our capital stock, or purchasing any such capital stock if our asset coverage, as defined in the 1940 Act, is below 150% at the time of the declaration of the dividend or distribution or the purchase and after deducting the amount of such dividend, distribution or purchase); |
|
|
• |
|
sell assets (other than certain limited restrictions on our ability to consolidate, merge or sell all or substantially all of our assets); |
|
|
• |
|
enter into transactions with affiliates; |
64
|
|
• |
|
create liens (including liens on the shares of our subsidiaries) or enter into sale and leaseback transactions; |
|
|
• |
|
make investments; or |
|
|
• |
|
create restrictions on the payment of distributions or other amounts to us from our subsidiaries. |
In addition, the indenture and the 2025 Notes and 2033 Notes do not require us to purchase the 2025 Notes or 2033 Notes in connection with a change of control or any other event.
Furthermore, the terms of the respective indentures and the 2022 Notes, 2025 Notes, 2033 Notes, and 2022 Convertible Notes do not protect their respective holders in the event that we experience changes (including significant adverse changes) in our financial condition, results of operations or credit ratings, as they do not require that we or our subsidiaries adhere to any financial tests or ratios or specified levels of net worth, revenues, income, cash flow or liquidity, except as required under the 1940 Act.
Our ability to recapitalize, incur additional debt and take a number of other actions that are not limited by the terms of the 2022 Notes, 2025 Notes, 2033 Notes, and 2022 Convertible Notes may have important consequences for their holders, including making it more difficult for us to satisfy our obligations with respect to the 2022 Notes, 2025 Notes, 2033 Notes, and 2022 Convertible Notes or negatively affecting their trading value.
Certain of our current debt instruments include more protections for their respective holders than the indenture and 2022 Notes, 2025 Notes, 2033 Notes, and 2022 Convertible Notes. See “—In addition to regulatory requirements that restrict our ability to raise capital, our 2022 Notes, 2025 Notes, 2033 Notes, 2022 Convertible Notes, and Credit Facilities contain various covenants which, if not complied with, could require accelerated repayment under the facility or require us to repurchase the 2022 Notes, 2025 Notes, 2033 Notes, or 2022 Convertible Notes thereby materially and adversely affecting our liquidity, financial condition, results of operations and ability to pay distributions.” In addition, other debt we issue or incur in the future could contain more protections for its holders than the respective indentures and the 2022 Notes, 2025 Notes, 2033 Notes, and 2022 Convertible Notes, including additional covenants and events of default. The issuance or incurrence of any such debt with incremental protections could affect the market for and trading levels and prices of the 2022 Notes, 2025 Notes, 2033 Notes, and 2022 Convertible Notes.
An active trading market for the 2025 Notes or 2033 Notes may not develop or be sustained, which could limit the market price of the 2025 Notes or 2033 Notes or your ability to sell them.
Although the 2025 Notes and 2033 Notes are listed on the NYSE under the symbols “HCXZ” and “HCXY,” respectively, we cannot provide any assurances that an active trading market will develop or be sustained for the 2025 Notes or 2033 Notes or that the 2025 Notes or 2033 Notes will be able to be sold. At various times, the 2025 Notes or 2033 Notes may trade at a discount from their initial offering price depending on prevailing interest rates, the market for similar securities, our credit ratings, general economic conditions, our financial condition, performance and prospects and other factors. To the extent an active trading market is not sustained, the liquidity and trading price for the 2025 Notes or 2033 Notes may be harmed.
If we default on our obligations to pay our other indebtedness, we may not be able to make payments on the 2022 Notes, 2025 Notes, 2033 Notes, 2022 Convertible Notes, 2027 Asset-Backed Notes, or 2028 Asset-Backed Notes.
Any default under the agreements governing our indebtedness, including a default under the Wells Facility, the Union Bank Facility, 2022 Notes, 2025 Notes, 2033 Notes, 2022 Convertible Notes, 2027 Asset-Backed Notes, 2028 Asset-Backed Notes or other indebtedness to which we may be a party, that is not waived by the required lenders or holders, and the remedies sought by the holders of such indebtedness, could make us unable to pay principal, premium, if any, and interest on any of our indebtedness, including the 2022 Notes, 2025 Notes, 2033 Notes, 2022 Convertible Notes, 2027 Asset-Backed Notes, or 2028 Asset-Backed Notes and substantially decrease the market value of the 2022 Notes, 2025 Notes, 2033 Notes, 2022 Convertible Notes, 2027 Asset-Backed Notes, and 2028 Asset-Backed Notes. If we are unable to generate sufficient cash flow and are otherwise unable to obtain funds necessary to meet required payments of principal, premium, if any, and interest on our indebtedness, or if we otherwise fail to comply with the various covenants, including financial and operating covenants, in the instruments governing our indebtedness, we could be in default under the terms of the agreements governing such indebtedness. In the event of such default, the holders of such indebtedness could elect to declare all the funds borrowed thereunder to be due and payable, together with accrued and unpaid interest, the lenders under the Wells Facility and the Union Bank Facility or other debt we may incur in the future could elect to terminate their commitments, cease making further loans and institute foreclosure proceedings against our assets, and we could be forced into bankruptcy or liquidation. If our operating performance declines, we may in the future need to seek to obtain waivers from the required lenders under the Wells Facility or Union Bank Facility or the required holders of our 2022 Notes, 2025 Notes, 2033 Notes, 2022 Convertible Notes, 2027 Asset-Backed Notes, 2028 Asset-Backed Notes or other debt that we may incur in the future to avoid being in default. If we breach our covenants under the Wells Facility, Union Bank Facility, 2022 Notes, 2025 Notes, 2033 Notes, 2022 Convertible Notes, 2027 Asset-Backed Notes, 2028 Asset-Backed Notes or other debt and seek a waiver, we may not be able to obtain a waiver from the required lenders or holders. If this occurs, we would be in default under the Wells Facility, Union Bank Facility, 2022 Notes, 2025 Notes, 2033 Notes, 2022 Convertible Notes, 2027 Asset-Backed Notes, 2028 Asset-Backed Notes or other debt, the
65
lenders or holders could exercise their rights as described above, and we could be forced into bankruptcy or liquidation. If we are unable to repay debt, lenders having secured obligations, including the lenders under the Wells Facility and the Union Bank Facility, could proceed against the collateral securing the debt. Because the Wells Facility and the Union Bank Facility have, and any future credit facilities will likely have, customary cross-default provisions, if the indebtedness under the 2022 Notes, 2025 Notes, 2033 Notes, 2022 Convertible Notes, 2027 Asset-Backed Notes, 2028 Asset-Backed Notes, Wells Facility, Union Bank Facility or under any future credit facility is accelerated, we may be unable to repay or finance the amounts due.
None.
Neither we nor any of our subsidiaries own any real estate or other physical properties materially important to our operation or any of our subsidiaries. Currently, we lease approximately 14,500 square feet of office space in Palo Alto, CA for our corporate headquarters. We also lease office space in Boston, MA, New York, NY, Washington, DC, Hartford, CT, Westport, CT, Chicago, IL, and San Diego, CA.
We may, from time to time, be involved in litigation arising out of our operations in the normal course of business or otherwise. Furthermore, third parties may try to seek to impose liability on us in connection with the activities of our portfolio companies. While the outcome of any current legal proceedings cannot at this time be predicted with certainty, we do not expect any current matters will materially affect our financial condition or results of operations; however, there can be no assurance whether any pending legal proceedings will have a material adverse effect on our financial condition or results of operations in any future reporting period.
Not applicable.
66
|
Item 5. |
Market for Registrant’s Common Equity, Related Stockholder Matters and Issuer Purchases of Equity Securities |
PRICE RANGE OF COMMON STOCK
Our common stock is traded on the NYSE under the symbol “HTGC.” As of February 14, 2018, we had approximately 61,003 stockholders of record. Most of the shares of our common stock are held by brokers and other institutions on behalf of stockholders. There are currently approximately 55 additional beneficial holders of our common stock.
Shares of business development companies may trade at a market price that is less than the NAV per share. The possibilities that our shares of common stock will trade at a discount from NAV or at premiums that are unsustainable over the long term are separate and distinct from the risk that our NAV will decrease. At times, our shares of common stock have traded at a premium to NAV or at a significant discount to the NAV per share.
SALES OF UNREGISTERED SECURITIES
During 2018, 2017 and 2016, the Board of Directors elected to receive approximately $500,000, $250,000 and $250,000, respectively, of their compensation in the form of common stock and we issued 38,245, 19,515 and 18,600 shares, respectively, to the directors based on the closing prices of the common stock on the specified election dates.
During 2018, 2017 and 2016, we issued 159,560, 163,584, and 144,308 shares, respectively, of common stock to shareholders in connection with the dividend reinvestment plan. These issuances were not subject to the registration requirements of the Securities Act of 1933, as amended, or the Securities Act. The aggregate value of the shares of our common stock issued under our dividend reinvestment plan during the years ended December 31, 2018, 2017 and 2016 were approximately $2.0 million, $2.2 million and $1.8 million, respectively.
EQUITY COMPENSATION PLAN INFORMATION
See “Item 12. Security Ownership of Certain Beneficial Owners and Management and Related Stockholder Matters.”
ISSUER PURCHASES OF EQUITY SECURITIES
On December 17, 2018, our Board of Directors authorized a stock repurchase plan permitting us to repurchase up to $25.0 million of our common stock. We may repurchase shares of our common stock in the open market, including block purchases, at prices that may be above or below the NAV as reported in the most recently published financial statements, in accordance with the guidelines specified in Rule 10b-18 and Rule 10b5-1 of the Exchange Act. We expect that the share repurchase program will be in effect until June 18, 2019, or until the approved dollar amount has been used to repurchase shares.
During the three months ended December 31, 2018, we made the following repurchases pursuant to the repurchase plan:
|
(in thousands, except share and per share data) |
|
|
|
|
|
|
|
|
|
|
|
|
|
|
|
|
|
Period |
|
Total Number of Shares Purchased |
|
|
Average Price Paid Per Share |
|
|
Total Number of Shares Purchased as Part of Publicly Announced Plan(1) |
|
|
Maximum Remaining Dollar Value that May Yet Be Purchased Under Plan(1) |
|
||||
|
October 1, 2018 - October 31, 2018 |
|
|
— |
|
|
$ |
— |
|
|
|
— |
|
|
$ |
— |
|
|
November 1, 2018 - November 30, 2018 |
|
|
— |
|
|
|
— |
|
|
|
— |
|
|
|
— |
|
|
December 1, 2018 - December 31, 2018 |
|
|
376,466 |
|
|
|
10.77 |
|
|
|
376,466 |
|
|
|
20,944 |
|
|
Total |
|
|
376,466 |
|
|
$ |
10.77 |
|
|
|
376,466 |
|
|
$ |
20,944 |
|
|
|
(1) |
Note that all repurchase activity per the table above was made pursuant to the stock repurchase plan authorized by our Board of Directors on December 17, 2018. The plan permits us to repurchase up to $25.0 million of our common stock. |
In addition, during the three months ended December 31, 2018, 18,956 shares of our common stock were delivered to us at an average price per share of $12.72 in satisfaction of tax withholding obligations of holders of restricted shares issued under the 2004 Plan and/or the Director Plan that vested during the period.
We anticipate that the manner, timing, and amount of any share purchases will be determined by management based upon the evaluation of market conditions, stock price, and additional factors in accordance with regulatory requirements. Pursuant to the 1940
67
Act, we are required to notify shareholders when such a program is initiated or implemented. The repurchase program does not require us to acquire any specific number of shares and may be extended, modified, or discontinued at any time.
DISTRIBUTION POLICY
In order to be subject to tax as a RIC, we must distribute to our stockholders, in respect of each taxable year, dividends for U.S. federal income tax purposes of an amount generally at least equal to the Annual Distribution Requirement. Upon satisfying this requirement in respect of a taxable year, we generally will not be subject to corporate taxes on any income we distribute to our stockholders as dividends for U.S. federal income tax purposes.
However, as a RIC we will be subject to a 4% nondeductible U.S. federal excise tax on certain undistributed income and gains unless we make distributions treated as dividends for U.S. federal income tax purposes in a timely manner to our stockholders in respect of each calendar year of an amount at least equal to the Excise Tax Avoidance Requirement. We will not be subject to this excise tax on any amount on which we incurred U.S. federal corporate income tax (such as the tax imposed on a RIC’s retained net capital gains).
Depending on the level of taxable income earned in a taxable year, we may choose to carry over taxable income in excess of current taxable year distributions treated as dividends for U.S. federal income tax purposes from such taxable income into the next taxable year and incur a 4% excise tax on such taxable income, as required. The maximum amount of excess taxable income that may be carried over for distribution in the next taxable year under the Code is the total amount of distributions treated as dividends for U.S. federal income tax purposes paid in the following taxable year, subject to certain declaration and payment guidelines. To the extent we choose to carry over taxable income into the next taxable year, distributions declared and paid by us in a taxable year may differ from our taxable income for that taxable year as such distributions may include the distribution of current taxable year taxable income, the distribution of prior taxable year taxable income carried over into and distributed in the current taxable year, or returns of capital.
We can offer no assurance that we will achieve results that will permit the payment of any cash distributions and, if we issue senior securities, we will be prohibited from making distributions if doing so causes us to fail to maintain the asset coverage ratios stipulated by the 1940 Act or if distributions are limited by the terms of any of our borrowings. Our ability to make distributions will be limited by the asset coverage requirements under the 1940 Act. See “Item 1. Business— Regulation.”
On February 13, 2019, the Board of Directors declared a cash distribution of $0.31 per share to be paid on March 11, 2019 to shareholders of record as of March 4, 2019. This distribution represents our fifty-fourth consecutive distribution since our IPO, bringing the total cumulative distribution to date to $15.28 per share.
Our Board of Directors maintains a variable distribution policy with the objective of distributing four quarterly distributions in an amount that approximates 90 - 100% of our taxable quarterly income or potential annual income for a particular taxable year. In addition, at the end of our taxable year, our Board of Directors may choose to pay an additional special distribution, or fifth distribution, so that we may distribute approximately all of our annual taxable income in the taxable year in which it was earned or may elect to maintain the option to spill over our excess taxable income into the following taxable year as part of any future distribution payments.
Distributions in excess of our current and accumulated earnings and profits would generally be treated first as a return of capital to the extent of a stockholder’s tax basis in our shares, and any distributions paid in excess of a stockholder’s tax basis in our shares would generally be treated as a capital gain. The determination of the tax attributes of our distributions is made annually as of the end of our taxable year and is generally based upon our taxable income for the full taxable year and distributions paid for the full taxable year. Of the distributions declared during the fiscal years ended December 31, 2018, 2017, and 2016, 100% were distributions derived from our current and accumulated earnings and profits. There can be no certainty to stockholders that this determination is representative of the tax attributes of the 2019 distributions that we anticipate would be made to stockholders.
We maintain an “opt-out” dividend reinvestment plan for our common stockholders. As a result, if we declare a distribution, cash distributions will be automatically reinvested in additional shares of our common stock unless the stockholder specifically “opts out” of the dividend reinvestment plan and chooses to receive cash distributions. During 2018, 2017, and 2016, we issued 159,560, 163,584 and 144,308 shares, respectively, of common stock to shareholders in connection with the dividend reinvestment plan.
68
The following stock performance graph compares the cumulative stockholder return assuming that, on December 31, 2013, a person invested $100 in each of our common stock, the NYSE Composite Index, the NASDAQ Financial 100 Index, and the Wells Fargo BDC Index. The graph measures total shareholder return, which takes into account both changes in stock price and distributions. It assumes that distributions paid are reinvested in like securities.
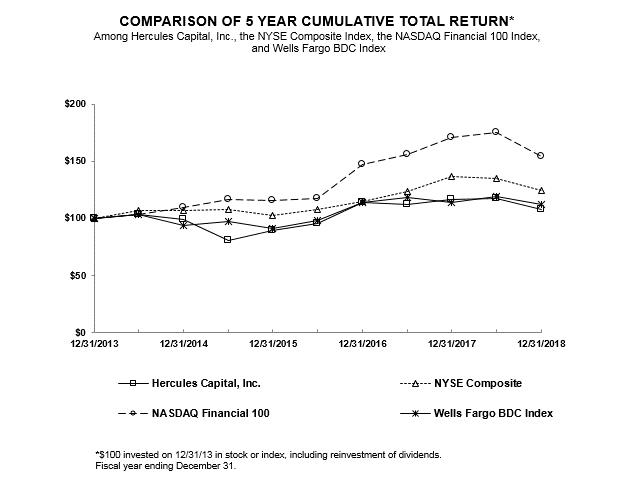
Copyright© 2018 S&P, a division of The McGraw-Hill Companies Inc. All rights reserved.
This graph and other information furnished under Part II. Item 5 of the Form 10-K shall not be deemed to be “soliciting material” or to be “filed” with the SEC or subject to Regulation 14A or 14C, or to the liabilities of Section 18 of the Exchange Act. The stock price performance included in the above graph is not necessarily indicative of future stock price performance.
69
Selected Consolidated Financial Data
The following consolidated financial data is derived from our audited consolidated financial statements. The selected consolidated financial data should be read in conjunction with “Management’s Discussion and Analysis of Financial Condition and Results of Operations” and the consolidated financial statements and related notes included elsewhere herein. Historical data is not necessarily indicative of results to be expected for any future period.
|
|
|
For the Year Ended December 31, |
|
|
|||||||||||||||||
|
(in thousands, except per share amounts) |
|
2018 |
|
|
2017 |
|
|
2016 |
|
|
2015 |
|
|
2014 |
|
|
|||||
|
Balance sheet data: |
|
|
|
|
|
|
|
|
|
|
|
|
|
|
|
|
|
|
|
|
|
|
Investments, at value |
|
$ |
1,880,373 |
|
|
$ |
1,542,214 |
|
|
$ |
1,423,942 |
|
|
$ |
1,200,638 |
|
|
$ |
1,020,737 |
|
|
|
Cash and cash equivalents |
|
|
34,212 |
|
|
|
91,309 |
|
|
|
13,044 |
|
|
|
95,196 |
|
|
|
227,116 |
|
|
|
Total assets |
|
|
1,945,191 |
|
|
|
1,654,715 |
|
|
|
1,464,204 |
|
|
|
1,334,761 |
|
|
|
1,299,223 |
|
|
|
Total liabilities |
|
|
989,747 |
|
|
|
813,748 |
|
|
|
676,260 |
|
|
|
617,627 |
|
|
|
640,359 |
|
|
|
Total net assets |
|
|
955,444 |
|
|
|
840,967 |
|
|
|
787,944 |
|
|
|
717,134 |
|
|
|
658,864 |
|
|
|
|
|
|
|
|
|
|
|
|
|
|
|
|
|
|
|
|
|
|
|
|
|
|
Other Data: |
|
|
|
|
|
|
|
|
|
|
|
|
|
|
|
|
|
|
|
|
|
|
Total return (3) |
|
|
(7.56 |
%) |
|
|
1.47 |
% |
|
|
26.87 |
% |
|
|
(9.70 |
%) |
|
|
(1.75 |
%) |
|
|
Total debt investments, at value |
|
|
1,733,492 |
|
|
|
1,415,984 |
|
|
|
1,328,803 |
|
|
|
1,110,209 |
|
|
|
923,906 |
|
|
|
Total warrant investments, at value |
|
|
26,669 |
|
|
|
36,869 |
|
|
|
27,485 |
|
|
|
22,987 |
|
|
|
25,098 |
|
|
|
Total equity investments, at value |
|
|
120,212 |
|
|
|
89,361 |
|
|
|
67,654 |
|
|
|
67,442 |
|
|
|
71,733 |
|
|
|
Unfunded Commitments (2) |
|
|
138,982 |
|
|
|
73,604 |
|
|
|
59,683 |
|
|
|
75,402 |
|
|
|
147,689 |
|
|
|
Net asset value per share (1) |
|
$ |
9.90 |
|
|
$ |
9.96 |
|
|
$ |
9.90 |
|
|
$ |
9.94 |
|
|
$ |
10.18 |
|
|
|
(1) |
Based on common shares outstanding at period end. |
|
(2) |
Amount represents unfunded commitments, including undrawn revolving facilities, which are available at the request of the portfolio company. Amount excludes unfunded commitments which are unavailable due to the borrower having not met certain milestones. |
|
(3) |
The total return equals the change in the ending market value over the beginning of the period price per share plus distributions paid per share during the period, divided by the beginning price assuming the distribution is reinvested on the date of the issuance. The total return does not reflect any sales load that must be paid by investors. |
|
|
|
For the Year Ended December 31, |
|
|
|||||||||||||||||
|
(in thousands, except per share amounts) |
|
2018 |
|
|
2017 |
|
|
2016 |
|
|
2015 |
|
|
2014 |
|
|
|||||
|
Investment income: |
|
|
|
|
|
|
|
|
|
|
|
|
|
|
|
|
|
|
|
|
|
|
Interest |
|
$ |
190,636 |
|
|
$ |
172,196 |
|
|
$ |
158,727 |
|
|
$ |
140,266 |
|
|
$ |
126,618 |
|
|
|
Fees |
|
|
17,117 |
|
|
|
18,684 |
|
|
|
16,324 |
|
|
|
16,866 |
|
|
|
17,047 |
|
|
|
Total investment income |
|
|
207,753 |
|
|
|
190,880 |
|
|
|
175,051 |
|
|
|
157,132 |
|
|
|
143,665 |
|
|
|
Operating expenses: |
|
|
|
|
|
|
|
|
|
|
|
|
|
|
|
|
|
|
|
|
|
|
Interest |
|
|
39,435 |
|
|
|
37,857 |
|
|
|
32,016 |
|
|
|
30,834 |
|
|
|
28,041 |
|
|
|
Loan fees |
|
|
7,260 |
|
|
|
8,728 |
|
|
|
5,042 |
|
|
|
6,055 |
|
|
|
5,919 |
|
|
|
General and administrative: |
|
|
15,488 |
|
|
|
16,105 |
|
|
|
16,106 |
|
|
|
16,658 |
|
|
|
10,209 |
|
|
|
Employee Compensation: |
|
|
|
|
|
|
|
|
|
|
|
|
|
|
|
|
|
|
|
|
|
|
Compensation and benefits |
|
|
25,062 |
|
|
|
24,555 |
|
|
|
22,500 |
|
|
|
20,713 |
|
|
|
16,604 |
|
|
|
Stock-based compensation |
|
|
11,779 |
|
|
|
7,191 |
|
|
|
7,043 |
|
|
|
9,370 |
|
|
|
9,561 |
|
|
|
Total employee compensation |
|
|
36,841 |
|
|
|
31,746 |
|
|
|
29,543 |
|
|
|
30,083 |
|
|
|
26,165 |
|
|
|
Total operating expenses |
|
|
99,024 |
|
|
|
94,436 |
|
|
|
82,707 |
|
|
|
83,630 |
|
|
|
70,334 |
|
|
|
Other income (loss) |
|
|
— |
|
|
|
— |
|
|
|
8,000 |
|
|
|
(1 |
) |
|
|
(1,581 |
) |
|
|
Net investment income |
|
|
108,729 |
|
|
|
96,444 |
|
|
|
100,344 |
|
|
|
73,501 |
|
|
|
71,750 |
|
|
|
Net realized gain (loss) on investments |
|
|
(11,087 |
) |
|
|
(26,711 |
) |
|
|
4,576 |
|
|
|
5,147 |
|
|
|
20,112 |
|
|
|
Net change in unrealized appreciation (depreciation) on investments |
|
|
(21,146 |
) |
|
|
9,265 |
|
|
|
(36,217 |
) |
|
|
(35,732 |
) |
|
|
(20,674 |
) |
|
|
Total net realized and unrealized gain (loss) |
|
|
(32,233 |
) |
|
|
(17,446 |
) |
|
|
(31,641 |
) |
|
|
(30,585 |
) |
|
|
(562 |
) |
|
|
Net increase in net assets resulting from operations |
|
$ |
76,496 |
|
|
$ |
78,998 |
|
|
$ |
68,703 |
|
|
$ |
42,916 |
|
|
$ |
71,188 |
|
|
|
Change in net assets per common share (basic) |
|
$ |
0.83 |
|
|
$ |
0.95 |
|
|
$ |
0.91 |
|
|
$ |
0.60 |
|
|
$ |
1.12 |
|
|
|
Distributions declared per common share: |
|
$ |
1.26 |
|
|
$ |
1.24 |
|
|
$ |
1.24 |
|
|
$ |
1.24 |
|
|
$ |
1.24 |
|
|
70
FORWARD-LOOKING STATEMENTS
The matters discussed in this report, as well as in future oral and written statements by management of Hercules Capital, Inc. that are forward-looking statements are based on current management expectations that involve substantial risks and uncertainties which could cause actual results to differ materially from the results expressed in, or implied by, these forward-looking statements. Forward-looking statements relate to future events or our future financial performance. We generally identify forward-looking statements by terminology such as “may,” “will,” “should,” “expects,” “plans,” “anticipates,” “could,” “intends,” “target,” “projects,” “contemplates,” “believes,” “estimates,” “predicts,” “potential” or “continue” or the negative of these terms or other similar expressions. Important assumptions include our ability to originate new investments, achieve certain margins and levels of profitability, the availability of additional capital, and the ability to maintain certain debt to asset ratios. In light of these and other uncertainties, the inclusion of a projection or forward-looking statement in this report should not be regarded as a representation by us that our plans or objectives will be achieved. The forward-looking statements contained in this report include statements as to:
|
|
• |
our current and future management structure; |
|
|
• |
our future operating results; |
|
|
• |
our business prospects and the prospects of our prospective portfolio companies; |
|
|
• |
the impact of investments that we expect to make; |
|
|
• |
our informal relationships with third parties including in the venture capital industry; |
|
|
• |
the expected market for venture capital investments and our addressable market; |
|
|
• |
the dependence of our future success on the general economy and its impact on the industries in which we invest; |
|
|
• |
our ability to access debt markets and equity markets; |
|
|
• |
the ability of our portfolio companies to achieve their objectives; |
|
|
• |
our expected financings and investments; |
|
|
• |
our regulatory structure and tax status; |
|
|
• |
our ability to operate as a business development company, a SBIC and a RIC; |
|
|
• |
the adequacy of our cash resources and working capital; |
|
|
• |
the timing of cash flows, if any, from the operations of our portfolio companies; |
|
|
• |
the timing, form and amount of any distributions; |
|
|
• |
the impact of fluctuations in interest rates on our business; |
|
|
• |
the valuation of any investments in portfolio companies, particularly those having no liquid trading market; and |
|
|
• |
our ability to recover unrealized losses. |
For a discussion of factors that could cause our actual results to differ from forward-looking statements contained in this report, please see the discussion under “Item 1A. Risk Factors.” You should not place undue reliance on these forward-looking statements. The forward-looking statements made in this report relate only to events as of the date on which the statements are made. We undertake no obligation to update any forward-looking statement to reflect events or circumstances occurring after the date of this report.
The following discussion should be read in conjunction with our consolidated financial statements and related notes and other financial information appearing elsewhere in this report. In addition to historical information, the following discussion and other parts of this report contain forward-looking information that involves risks and uncertainties. Our actual results could differ materially from those anticipated by such forward-looking information due to the factors discussed under “Item 1A—Risk Factors” and “Forward-Looking Statements” of this Item 7.
71
We are a specialty finance company focused on providing senior secured loans to high-growth, innovative venture capital-backed companies in a variety of technology, life sciences and sustainable and renewable technology industries. We source our investments through our principal office located in Palo Alto, CA, as well as through our additional offices in Boston, MA, New York, NY, Washington, DC, Hartford, CT, Westport, CT, Chicago, IL, and San Diego, CA.
Our goal is to be the leading structured debt financing provider for venture capital-backed companies in technology-related industries requiring sophisticated and customized financing solutions. Our strategy is to evaluate and invest in a broad range of technology-related industries including technology, drug discovery and development, biotechnology, life sciences, healthcare, and sustainable and renewable technology and to offer a full suite of growth capital products. We invest primarily in structured debt with warrants and, to a lesser extent, in senior debt and equity investments. We invest primarily in private companies but also have investments in public companies.
We use the term “structured debt with warrants” to refer to any debt investment, such as a senior or subordinated secured loan, that is coupled with an equity component, including warrants, options or other rights to purchase common or preferred stock. Our structured debt with warrants investments typically are secured by some or all of the assets of the portfolio company. We also provide “unitranche” loans, which are loans that combine both senior and mezzanine debt, generally in a first lien position.
Our investment objective is to maximize our portfolio total return by generating current income from our debt investments and capital appreciation from our warrant and equity-related investments. Our primary business objectives are to increase our net income, net operating income and NAV by investing in structured debt with warrants and equity of venture capital-backed companies in technology-related industries with attractive current yields and the potential for equity appreciation and realized gains. Our equity ownership in our portfolio companies may exceed 25% of the voting securities of such companies, which represents a controlling interest under the 1940 Act. In some cases, we receive the right to make additional equity investments in our portfolio companies in connection with future equity financing rounds. Capital that we provide directly to venture capital-backed companies in technology-related industries is generally used for growth and general working capital purposes as well as in select cases for acquisitions or recapitalizations.
We also make investments in qualifying small businesses through HT III, which is our wholly-owned SBIC. HT III holds approximately $307.5 million in assets, which accounted for approximately 14.3% of our total assets, prior to consolidation at December 31, 2018. At December 31, 2018, with our net investment of $74.5 million, HT III has the capacity to issue $149.0 million of SBA-guaranteed debentures, which is subject to SBA approval. At December 31, 2018, we have issued $149.0 million in SBA-guaranteed debentures in our SBIC subsidiary.
We have qualified as and have elected to be treated for tax purposes as a RIC under Subchapter M of the Code. Pursuant to this election, we generally will not be subject to corporate-level taxes on any income and gains that we distribute as dividends for federal income tax purposes to our stockholders. However, our qualification and election to be treated as a RIC requires that we comply with provisions contained in Subchapter M of the Code. For example, as a RIC we must earn 90% or more of our gross income during each taxable year from qualified sources, typically referred to as “good income,” as well as satisfy certain quarterly asset diversification and annual income distribution requirements.
We are an internally managed, non-diversified, closed-end investment company that has elected to be regulated as a business development company under the 1940 Act. As a business development company, we are required to comply with certain regulatory requirements. For instance, we generally have to invest at least 70% of our total assets in “qualifying assets,” which includes securities of private U.S. companies, cash, cash equivalents and high-quality debt investments that mature in one year or less.
Our portfolio is comprised of, and we anticipate that our portfolio will continue to be comprised of, investments primarily in technology related companies at various stages of their development. Consistent with requirements under the 1940 Act, we invest primarily in United-States based companies and to a lesser extent in foreign companies.
We regularly engage in discussions with third parties with respect to various potential transactions. We may acquire an investment or a portfolio of investments or an entire company or sell a portion of our portfolio on an opportunistic basis. We, our subsidiaries or our affiliates may also agree to manage certain other funds that invest in debt, equity or provide other financing or services to companies in a variety of industries for which we may earn management or other fees for our services. We may also invest in the equity of these funds, along with other third parties, from which we would seek to earn a return and/or future incentive allocations. Some of these transactions could be material to our business. Consummation of any such transaction will be subject to completion of due diligence, finalization of key business and financial terms (including price) and negotiation of final definitive documentation as well as a number of other factors and conditions including, without limitation, the approval of our board of directors and required regulatory or third-party consents and, in certain cases, the approval of our stockholders. Accordingly, there can be no
72
assurance that any such transaction would be consummated. Any of these transactions or funds may require significant management resources either during the transaction phase or on an ongoing basis depending on the terms of the transaction.
Reduced Asset Coverage Requirements
The SBCAA, which was signed into law in March 2018, decreased the minimum asset coverage ratio in Section 61(a) of the 1940 Act for business development companies from 200% to 150% (subject to either stockholder approval or approval of both a majority of the board of directors and a majority of directors who are not interested persons). On September 4, 2018 and December 6, 2018, our Board of Directors, including a “required majority” (as such term is defined in Section 57(o) of the 1940 Act) and our stockholders, respectively, approved the application to us of the 150% minimum asset coverage ratio set forth in Section 61(a)(2) of the 1940 Act. As a result, effective December 7, 2018, the asset coverage ratio under the 1940 Act applicable to us decreased from 200% to 150%, permitting us to incur additional leverage.
Portfolio and Investment Activity
The total fair value of our investment portfolio was approximately $1.9 billion at December 31, 2018 as compared to approximately $1.5 billion at December 31, 2017. The fair value of our debt investment portfolio at December 31, 2018 was approximately $1.7 billion, compared to a fair value of approximately $1.4 billion at December 31, 2017. The fair value of the equity portfolio at December 31, 2018 was approximately $120.2 million, compared to a fair value of approximately $89.4 million at December 31, 2017. The fair value of the warrant portfolio at December 31, 2018 was approximately $26.7 million, compared to a fair value of approximately $36.8 million at December 31, 2017.
Portfolio Activity
Our investments in portfolio companies take a variety of forms, including unfunded contractual commitments and funded investments. From time to time, unfunded contractual commitments depend upon a portfolio company reaching certain milestones before the debt commitment is available to the portfolio company, which is expected to affect our funding levels. These commitments are subject to the same underwriting and ongoing portfolio maintenance as the on-balance sheet financial instruments that we hold. Debt commitments generally fund over the two succeeding quarters from close. Not all debt commitments represent future cash requirements. Similarly, unfunded contractual commitments may expire without being drawn and thus do not represent future cash requirements.
Prior to entering into a contractual commitment, we generally issue a non-binding term sheet to a prospective portfolio company. Non-binding term sheets are subject to completion of our due diligence and final investment committee approval process, as well as the negotiation of definitive documentation with the prospective portfolio companies. These non-binding term sheets generally convert to contractual commitments in approximately 90 days from signing. Not all non-binding term sheets are expected to close and do not necessarily represent future cash requirements.
Our portfolio activity for the years ended December 31, 2018 and 2017 was comprised of the following:
|
(in millions) |
|
December 31, 2018 |
|
|
December 31, 2017 |
|
||
|
Debt Commitments (1) |
|
|
|
|
|
|
|
|
|
New portfolio company |
|
$ |
969.2 |
|
|
$ |
773.2 |
|
|
Existing portfolio company |
|
|
184.0 |
|
|
|
98.8 |
|
|
Total |
|
$ |
1,153.2 |
|
|
$ |
872.0 |
|
|
Funded and Restructured Debt Investments (2) |
|
|
|
|
|
|
|
|
|
New portfolio company |
|
$ |
641.6 |
|
|
$ |
578.9 |
|
|
Existing portfolio company |
|
|
258.2 |
|
|
|
175.9 |
|
|
Total |
|
$ |
899.8 |
|
|
$ |
754.8 |
|
|
Funded Equity Investments |
|
|
|
|
|
|
|
|
|
New portfolio company |
|
|
53.4 |
|
|
$ |
7.1 |
|
|
Existing portfolio company |
|
|
7.6 |
|
|
|
2.9 |
|
|
Total |
|
$ |
61.0 |
|
|
$ |
10.0 |
|
|
Unfunded Contractual Commitments (3) |
|
|
|
|
|
|
|
|
|
Total |
|
$ |
139.0 |
|
|
$ |
73.6 |
|
|
Non-Binding Term Sheets |
|
|
|
|
|
|
|
|
|
New portfolio company |
|
$ |
55.5 |
|
|
$ |
122.0 |
|
|
Existing portfolio company |
|
|
— |
|
|
|
— |
|
|
Total |
|
$ |
55.5 |
|
|
$ |
122.0 |
|
|
(1) |
Includes restructured loans and renewals in addition to new commitments. |
|
(2) |
Funded amounts include borrowings on revolving facilities. |
|
(3) |
Amount represents unfunded commitments, including undrawn revolving facilities, which are available at the request of the portfolio company. Amount excludes unfunded commitments which are unavailable due to the borrower having not met certain milestones. |
73
We receive principal payments on our debt investment portfolio based on scheduled amortization of the outstanding balances. In addition, we receive principal repayments for some of our loans prior to their scheduled maturity date. The frequency or volume of these early principal repayments may fluctuate significantly from period to period. During the year ended December 31, 2018, we received approximately $576.7 million in aggregate principal repayments. Of the approximately $576.7 million of aggregate principal repayments, approximately $90.1 million were scheduled principal payments, and approximately $486.6 million were early principal repayments related to 36 portfolio companies. Of the approximately $486.6 million early principal repayments, approximately $69.3 million were early repayments due to M&A transactions for five portfolio companies.
Total portfolio investment activity (inclusive of unearned income and excluding activity related to taxes payable and escrow receivables) as of and for each of the years ended December 31, 2018 and 2017 was as follows:
|
(in millions) |
|
December 31, 2018 |
|
|
December 31, 2017 |
|
||
|
|
$ |
1,542.2 |
|
|
$ |
1,423.9 |
|
|
|
New fundings and restructures |
|
|
960.7 |
|
|
|
764.8 |
|
|
Warrants not related to current period fundings |
|
|
0.1 |
|
|
|
0.6 |
|
|
Principal payments received on investments |
|
|
(90.1 |
) |
|
|
(119.5 |
) |
|
Early payoffs |
|
|
(486.6 |
) |
|
|
(505.6 |
) |
|
Accretion of loan discounts and paid-in-kind principal |
|
|
34.9 |
|
|
|
36.5 |
|
|
Net acceleration of loan discounts and loan fees due to early payoff or restructure |
|
|
(13.5 |
) |
|
|
(8.1 |
) |
|
New loan fees |
|
|
(13.8 |
) |
|
|
(9.8 |
) |
|
Sale of investments |
|
|
(5.9 |
) |
|
|
(11.0 |
) |
|
Loss on investments due to write offs |
|
|
(25.1 |
) |
|
|
(39.6 |
) |
|
Net change in unrealized appreciation (depreciation) |
|
|
(22.5 |
) |
|
|
10.0 |
|
|
Ending portfolio |
|
$ |
1,880.4 |
|
|
$ |
1,542.2 |
|
As of December 31, 2018, we held warrants or equity positions in four companies that have filed registration statements on Form S-1 with the SEC in contemplation of potential IPOs. Three companies filed confidentially under the Jumpstart Our Business Startups Act of 2012, or the JOBS Act. There can be no assurance that companies that have yet to complete their IPO will do so in a timely manner or at all.
Changes in Portfolio
We generate revenue in the form of interest income, primarily from our investments in debt securities and commitment and facility fees. Interest income is recognized in accordance with the contractual terms of the loan agreement to the extent that such amounts are expected to be collected. Fees generated in connection with our debt investments are recognized over the life of the loan or, in some cases, recognized as earned. In addition, we generate revenue in the form of capital gains, if any, on warrants or other equity-related securities that we acquire from our portfolio companies. Our investments generally range from $12.0 million to $40.0 million, although we may make investments in amounts above or below that range. As of December 31, 2018, our debt investments have a term of between two and seven years and typically bear interest at a rate ranging from approximately 5.5% to approximately 15.7%. In addition to the cash yields received on our debt investments, in some instances, our debt investments may also include any of the following: exit fees, balloon payment fees, commitment fees, success fees, PIK provisions or prepayment fees which may be required to be included in income prior to receipt.
Interest on debt securities is generally payable monthly, with amortization of principal typically occurring over the term of the investment. In addition, our loans may include an interest-only period ranging from three to eighteen months or longer. In limited instances in which we choose to defer amortization of the loan for a period of time from the date of the initial investment, the principal amount of the debt securities and any accrued but unpaid interest become due at the maturity date.
Loan origination and commitment fees received in full at the inception of a loan are deferred and amortized into fee income as an enhancement to the related loan’s yield over the contractual life of the loan. We recognize nonrecurring fees amortized over the remaining term of the loan commencing in the quarter relating to specific loan modifications. We had approximately $36.3 million of unamortized fees at December 31, 2018, of which approximately $31.1 million was included as an offset to the cost basis of our current debt investments and approximately $5.2 million was deferred contingent upon the occurrence of a funding or milestone. At December 31, 2017, we had approximately $33.3 million of unamortized fees, of which approximately $29.3 million was included as an offset to the cost basis of our current debt investments and approximately $4.0 million was deferred contingent upon the occurrence of a funding or milestone.
74
Loan exit fees to be paid at the termination of the loan are accreted into interest income over the contractual life of the loan. At December 31, 2018, we had approximately $25.6 million in exit fees receivable, of which approximately $23.3 million was included as a component of the cost basis of our current debt investments and approximately $2.3 million was a deferred receivable related to expired commitments. At December 31, 2017, we had approximately $27.5 million in exit fees receivable, of which approximately $23.9 million was included as a component of the cost basis of our current debt investments and approximately $3.6 million was a deferred receivable related to expired commitments.
We have debt investments in our portfolio that contain a PIK provision. The PIK interest, computed at the contractual rate specified in each loan agreement, is recorded as interest income and added to the principal balance of the loan on specified capitalization dates. To maintain our ability to be subject to tax as a RIC, this non-cash source of income must be distributed to stockholders with other sources of income in the form of dividend distributions even though we have not yet collected the cash. Amounts necessary to pay these distributions may come from available cash or the liquidation of certain investments. We recorded approximately $9.4 million and $10.0 million in PIK income in the years ended December 31, 2018 and December 31, 2017, respectively.
The core yield on our debt investments, which excludes the effects of fee and income accelerations attributed to early payoffs, restructuring, loan modifications and other one-time events and includes income from expired commitments, was 12.6% and 12.4% during the years ended December 31, 2018 and 2017, respectively. The effective yield on our debt investments, which includes the effects of fee and income accelerations attributed to early payoffs, restructuring, loan modifications and other one-time events, was 13.7% and 14.2% for the years ended December 31, 2018 and 2017, respectively. The effective yield is derived by dividing total investment income by the weighted average earning investment portfolio assets outstanding during the year, excluding non-interest earning assets such as warrants and equity investments. Both the core yield and effective yield may be higher than what our common stockholders may realize as the core yield and effective yield do not reflect our expenses and any sales load paid by our common stockholders. The total yield on our investment portfolio was 12.2% and 12.7% for the years ended December 31, 2018 and 2017, respectively. The total yield is derived by dividing total investment income by the weighted average investment portfolio assets outstanding during the year, including non-interest earning assets such as warrants and equity investments at amortized cost.
The total return for our investors was approximately -7.6% and 1.5% during the years ended December 31, 2018 and 2017, respectively. The total return equals the change in the ending market value over the beginning of the period price per share plus distributions paid per share during the period, divided by the beginning price assuming the distribution is reinvested on the date of the distribution. The total return does not reflect any sales load that must be paid by investors. See “Note 9 – Financial Highlights” included in the notes to our consolidated financial statements appearing elsewhere in this report.
Portfolio Composition
Our portfolio companies are primarily privately held companies and public companies which are active in the drug discovery & development, software, internet consumer & business services, media/content/info, sustainable and renewable technology, medical devices & equipment, drug delivery, healthcare services, specialty pharmaceuticals, information services, consumer & business products, surgical devices, semiconductors, electronics & computer hardware, communications & networking, biotechnology tools, diagnostic and diversified financial services industry sectors. These sectors are characterized by high margins, high growth rates, consolidation and product and market extension opportunities. Value for companies in these sectors is often vested in intangible assets and intellectual property.
As of December 31, 2018, approximately 87.8% of the fair value of our portfolio was composed of investments in five industries: 29.2% was composed of investments in the software industry, 28.7% was composed of investments in the drug discovery and development industry, 17.5% was composed of investments in the internet consumer and business services industry, 6.5% was composed of investments in the medical devices and equipment industry, and 5.9% was composed of investments in the sustainable and renewable technology industry.
75
The following table shows the fair value of our portfolio by industry sector at December 31, 2018 and December 31, 2017:
|
|
|
December 31, 2018 |
|
|
December 31, 2017 |
|
||||||||||
|
(in thousands) |
|
Investments at Fair Value |
|
|
Percentage of Total Portfolio |
|
|
Investments at Fair Value |
|
|
Percentage of Total Portfolio |
|
||||
|
Software |
|
$ |
548,952 |
|
|
|
29.2 |
% |
|
$ |
360,123 |
|
|
|
23.4 |
% |
|
Drug Discovery & Development |
|
|
539,977 |
|
|
|
28.7 |
% |
|
|
369,173 |
|
|
|
23.9 |
% |
|
Internet Consumer & Business Services |
|
|
329,512 |
|
|
|
17.5 |
% |
|
|
154,909 |
|
|
|
10.0 |
% |
|
Medical Devices & Equipment |
|
|
121,420 |
|
|
|
6.5 |
% |
|
|
94,595 |
|
|
|
6.1 |
% |
|
Sustainable and Renewable Technology |
|
|
110,303 |
|
|
|
5.9 |
% |
|
|
118,432 |
|
|
|
7.7 |
% |
|
Healthcare Services, Other |
|
|
60,142 |
|
|
|
3.2 |
% |
|
|
72,337 |
|
|
|
4.7 |
% |
|
Drug Delivery |
|
|
40,519 |
|
|
|
2.2 |
% |
|
|
91,214 |
|
|
|
5.9 |
% |
|
Diversified Financial Services |
|
|
39,491 |
|
|
|
2.1 |
% |
|
|
— |
|
|
|
0.0 |
% |
|
Information Services |
|
|
30,940 |
|
|
|
1.6 |
% |
|
|
24,618 |
|
|
|
1.6 |
% |
|
Media/Content/Info |
|
|
21,666 |
|
|
|
1.2 |
% |
|
|
152,998 |
|
|
|
9.9 |
% |
|
Electronics & Computer Hardware |
|
|
15,763 |
|
|
|
0.8 |
% |
|
|
9,982 |
|
|
|
0.6 |
% |
|
Biotechnology Tools |
|
|
6,279 |
|
|
|
0.3 |
% |
|
|
5,604 |
|
|
|
0.4 |
% |
|
Consumer & Business Products |
|
|
6,179 |
|
|
|
0.3 |
% |
|
|
19,792 |
|
|
|
1.3 |
% |
|
Communications & Networking |
|
|
4,871 |
|
|
|
0.3 |
% |
|
|
6,649 |
|
|
|
0.4 |
% |
|
Surgical Devices |
|
|
3,088 |
|
|
|
0.2 |
% |
|
|
13,161 |
|
|
|
0.9 |
% |
|
Semiconductors |
|
|
899 |
|
|
|
0.0 |
% |
|
|
10,406 |
|
|
|
0.7 |
% |
|
Diagnostic |
|
|
348 |
|
|
|
0.0 |
% |
|
|
720 |
|
|
|
0.1 |
% |
|
Specialty Pharmaceuticals |
|
|
24 |
|
|
|
0.0 |
% |
|
|
37,501 |
|
|
|
2.4 |
% |
|
Total |
|
$ |
1,880,373 |
|
|
|
100.0 |
% |
|
$ |
1,542,214 |
|
|
|
100.0 |
% |
Industry and sector concentrations vary as new loans are recorded and loans pay off. Loan revenue, consisting of interest, fees, and recognition of gains on equity and warrants or other equity-related interests, can fluctuate materially when a loan is paid off or a warrant or equity interest is sold. Revenue recognition in any given year can be highly concentrated in several portfolio companies.
For the years ended December 31, 2018 and 2017, our ten largest portfolio companies represented approximately 28.2% and 34.6% of the total fair value of our investments in portfolio companies, respectively. At December 31, 2018 and December 31, 2017, we had seven investments that represented 5% or more of our net assets. At December 31, 2018 and December 31, 2017, we had five and nine equity investments representing approximately 53.0% and 67.1%, respectively, of the total fair value of our equity investments, and each represented 5% or more of the total fair value of our equity investments. No single portfolio investment represents more than 10% of the fair value of our total investments as of December 31, 2018 and 2017.
As of December 31, 2018, approximately 97.3% of the debt investment portfolio was priced at floating interest rates or floating interest rates with a Prime or LIBOR-based interest rate floor. As a result, we believe we are well positioned to benefit should market interest rates continue to rise.
In most cases, we collateralize our investments by obtaining a first priority security interest in a portfolio company’s assets, which may include its intellectual property. In other cases, we may obtain a negative pledge covering a company’s intellectual property. As of December 31, 2018, approximately 85.3% of our debt investments were in a senior secured first lien position, with 48.5% secured by a first priority security in all of the assets of the portfolio company, including its intellectual property, 28.8% secured by a first priority security in all of the assets of the portfolio company and the portfolio company was prohibited from pledging or encumbering its intellectual property. 1.1% of our debt investments were senior secured by the equipment of the portfolio company, and 6.9% were in a first lien “last-out” senior secured position with security interest in all of the assets of the portfolio company, whereby the “last-out” loans will be subordinated to the “first-out” portion of the unitranche loan in a liquidation, sale or other disposition. Another 13.8% of our debt investments were secured by a second priority security interest in all of the portfolio company’s assets, and 0.9% were unsecured.
Our investments in senior secured debt with warrants have detachable equity enhancement features, typically in the form of warrants or other equity-related securities designed to provide us with an opportunity for capital appreciation. These features are treated as OID and are accreted into interest income over the term of the loan as a yield enhancement. Our warrant coverage generally ranges from 3% to 20% of the principal amount invested in a portfolio company, with a strike price generally equal to the most recent equity financing round. As of December 31, 2018, we held warrants in 129 portfolio companies, with a fair value of approximately $26.7 million. The fair value of our warrant portfolio decreased by approximately $10.1 million, as compared to a fair value of $36.8 million at December 31, 2017, primarily related a slight decrease in portfolio companies and valuation of the portfolio.
Our existing warrant holdings would require us to invest approximately $78.7 million to exercise such warrants as of December 31, 2018. Warrants may appreciate or depreciate in value depending largely upon the underlying portfolio company’s performance
76
and overall market conditions. Of the warrants that we have monetized since inception, we have realized multiples in the range of approximately 1.02x to 29.06x based on the historical rate of return on our investments. However, our warrants may not appreciate in value and, in fact, may decline in value. Accordingly, we may experience losses from our warrant portfolio.
Portfolio Grading
We use an investment grading system, which grades each debt investment on a scale of 1 to 5, to characterize and monitor our expected level of risk on the debt investments in our portfolio with 1 being the highest quality. See “Item 1. Business—Investment Process—Loan and Compliance Administration.” The following table shows the distribution of our outstanding debt investments on the 1 to 5 investment grading scale at fair value as of December 31, 2018 and 2017, respectively:
|
(in thousands) |
|
December 31, 2018 |
|
|
December 31, 2017 |
|
||||||||||||||
|
Investment Grading |
|
Number of Companies |
|
Debt Investments at Fair Value |
|
|
Percentage of Total Portfolio |
|
|
Number of Companies |
|
Debt Investments at Fair Value |
|
|
Percentage of Total Portfolio |
|
||||
|
1 |
|
13 |
|
$ |
311,597 |
|
|
|
18.0 |
% |
|
12 |
|
$ |
345,191 |
|
|
|
24.4 |
% |
|
2 |
|
43 |
|
|
885,123 |
|
|
|
51.1 |
% |
|
32 |
|
|
583,017 |
|
|
|
41.2 |
% |
|
3 |
|
25 |
|
|
474,926 |
|
|
|
27.3 |
% |
|
32 |
|
|
443,775 |
|
|
|
31.3 |
% |
|
4 |
|
7 |
|
|
60,267 |
|
|
|
3.5 |
% |
|
4 |
|
|
41,744 |
|
|
|
2.9 |
% |
|
5 |
|
2 |
|
|
1,579 |
|
|
|
0.1 |
% |
|
5 |
|
|
2,257 |
|
|
|
0.2 |
% |
|
|
|
90 |
|
$ |
1,733,492 |
|
|
|
100.0 |
% |
|
85 |
|
$ |
1,415,984 |
|
|
|
100.0 |
% |
As of December 31, 2018, our debt investments had a weighted average investment grading of 2.18 on a cost basis, as compared to 2.17 at December 31, 2017. Our policy is to lower the grading on our portfolio companies as they approach the point in time when they will require additional equity capital. Additionally, we may downgrade our portfolio companies if they are not meeting our financing criteria or are underperforming relative to their respective business plans. Various companies in our portfolio will require additional funding in the near term or have not met their business plans and therefore have been downgraded until their funding is complete or their operations improve. The slight increase in weighted average investment grading at December 31, 2018 from December 31, 2017 is primarily due to an overall decrease in positions with a credit rating of 1.
At December 31, 2018, we had two debt investments on non-accrual with a cumulative investment cost of approximately $2.7 million and zero fair value. At December 31, 2017, we had five debt investments on non-accrual with a cumulative investment cost and fair value of approximately $14.8 million and $340,000, respectively. The decrease in the cumulative cost and fair value of debt investments on non-accrual between December 31, 2018 and December 31, 2017 is the result of the liquidation of two debt investments that were on non-accrual at December 31, 2017, which resulted in a realized loss of approximately $10.3 million, slightly offset by a loan repayment in full from one debt investment.
Results of Operations
Comparison of periods ended December 31, 2018 and 2017
Investment Income
Interest Income
Total investment income for the year ended December 31, 2018 was approximately $207.8 million as compared to approximately $190.9 million for the year ended December 31, 2017.
Interest income for the year ended December 31, 2018 totaled approximately $190.6 million as compared to approximately $172.2 million for the year ended December 31, 2017. The increase in interest income for the year ended December 31, 2018 as compared to the year ended December 31, 2017 is primarily attributable to debt investment portfolio growth and an increase in the weighted average principal outstanding between the periods, the acceleration of income due to early repayments and other one-time events during the period and changes in various interest rates, including LIBOR and Prime rates, to the extent our debt investments include variable interest rates. As of December 31, 2018, approximately, 97.3% of the loans in our portfolio had variable rates based on floating Prime or LIBOR rates with a floor, compared to 96.4% as of December 31, 2017.
Of the $190.6 million in interest income for the year ended December 31, 2018, approximately $184.1 million represents recurring income from the contractual servicing of our loan portfolio and approximately $6.5 million represents income related to the acceleration of income due to early loan repayments and other one-time events during the period. Income from the contractual servicing of our loan portfolio and the acceleration of interest income due to early loan repayments and other one-time events represented $160.3 million and $11.9 million, respectively, of the $172.2 million interest income for the year ended December 31, 2017.
77
The following table shows the PIK-related activity, for the years ended December 31, 2018 and 2017, at cost:
|
|
|
Year Ended December 31, |
|
|||||
|
(in thousands) |
|
2018 |
|
|
2017 |
|
||
|
Beginning PIK interest receivable balance |
|
$ |
15,487 |
|
|
$ |
9,930 |
|
|
PIK interest income during the period |
|
|
9,406 |
|
|
|
9,960 |
|
|
PIK accrued (capitalized) to principal |
|
|
(1,630 |
) |
|
|
129 |
|
|
Payments received from PIK loans |
|
|
(10,546 |
) |
|
|
(2,349 |
) |
|
Realized loss |
|
|
— |
|
|
|
(2,183 |
) |
|
Ending PIK interest receivable balance |
|
$ |
12,717 |
|
|
$ |
15,487 |
|
The decrease in PIK interest income during the year ended December 31, 2018 as compared to the year ended December 31, 2017 is due to a lower average principal outstanding for loans which bear PIK interest. PIK receivable for both December 31, 2018 and December 31, 2017 represents approximately 1% of total debt investments.
Fee Income
Fee income from commitment, facility and loan related fees for the year ended December 31, 2018 totaled approximately $17.1 million as compared to approximately $18.7 million for the year ended December 31, 2017. The decrease in fee income is primarily attributable to a decrease in the acceleration of unamortized fees due to early repayments and one-time fees during the period.
Of the $17.1 million in fee income from commitment, facility and loan related fees for the year ended December 31, 2018, approximately $7.0 million represents income from recurring fee amortization and approximately $10.1 million represents income related to the acceleration of unamortized fees during the period. Income from recurring fee amortization and the acceleration of unamortized fees due to early loan repayments represented $6.4 million and $12.3 million, respectively, of the $18.7 million income for the year ended December 31, 2017.
In certain investment transactions, we may earn income from advisory services; however, we had no income from advisory services in the years ended December 31, 2018 and 2017, respectively.
Operating Expenses
Our operating expenses are comprised of interest and fees on our borrowings, general and administrative expenses and employee compensation and benefits. Operating expenses totaled approximately $99.0 million and $94.4 million during the years ended December 31, 2018 and 2017, respectively.
Interest and Fees on our Borrowings
Interest and fees on our borrowings totaled approximately $46.7 million and $46.6 million for the years ended December 31, 2018 and 2017, respectively. Interest and fee expense for the year ended December 31, 2018 as compared to December 31, 2017 increased primarily due to the issuance of our 2027 Asset-Backed Notes in November 2018, 2033 Notes in September 2018, and 2025 Notes in April 2018, as well as increased average borrowings under our credit facilities, and acceleration of amortized fees from early redemption of the 2024 notes, offset by the partial redemptions of our 2024 Notes and amortization of our fixed-rate asset backed notes due 2021, or the 2021 Asset-Backed Notes.
We had a weighted average cost of debt, comprised of interest and fees, of approximately 5.6% and 5.9% for the years ended December 31, 2018 and 2017, respectively. The slight decrease between comparative periods was primarily driven by a reduction in the weighted average principal outstanding on our higher yielding debt instruments compared to the prior period, specifically the impact of redemptions on our 2024 Notes and amortization of our 2021 Asset-Backed Notes along with lower interest rates due to the issuance of the 2027 Asset-Backed Notes.
General and Administrative Expenses
General and administrative expenses include legal fees, consulting fees, accounting fees, printer fees, insurance premiums, rent, expenses associated with the workout of underperforming investments and various other expenses. Our general and administrative expenses were $15.5 million and $16.1 million for the years ended December 31, 2018 and 2017, respectively. This decrease in general and administrative expenses is primarily due to a decrease in workout related costs and corporate legal fees.
78
Employee compensation and benefits totaled approximately $25.1 million for the year ended December 31, 2018 as compared to approximately $24.6 million for the year ended December 31, 2017. The increase between comparative periods was primarily due to changes in variable incentive compensation related to the achievement of origination and strategic corporate objectives.
Employee stock-based compensation totaled approximately $11.8 million for the year ended December 31, 2018 as compared to approximately $7.2 million for the year ended December 31, 2017. The increase between comparative periods was primarily related to the number and amount of restricted stock awards vesting along with long-term retention performance stock units and separate cash bonus awards granted to senior personnel on May 2, 2018.
Net Investment Realized Gains and Losses and Net Unrealized Appreciation and Depreciation
Realized gains or losses are measured by the difference between the net proceeds from the repayment or sale and the cost basis of an investment without regard to unrealized appreciation or depreciation previously recognized, and includes investments written off during the period, net of recoveries. Net change in unrealized appreciation or depreciation primarily reflects the change in portfolio investment values during the reporting period, including the reversal of previously recorded unrealized appreciation or depreciation when gains or losses are realized.
A summary of realized gains and losses for the years ended December 31, 2018 as and 2017 is as follows:
|
|
|
Year Ended December 31, |
|
|||||
|
(in thousands) |
|
2018 |
|
|
2017 |
|
||
|
Realized gains |
|
$ |
14,050 |
|
|
$ |
14,163 |
|
|
Realized losses |
|
|
(25,137 |
) |
|
|
(40,874 |
) |
|
Net realized gains (losses) |
|
$ |
(11,087 |
) |
|
$ |
(26,711 |
) |
During the year ended December 31, 2018, we recognized net realized losses of approximately $11.1 million on the portfolio. These net realized losses included gross realized losses of approximately $25.1 million, primarily from the liquidation or write-off of our debt, equity or warrant investments. These losses were partially offset by gross realized gains of approximately $14.0 million, primarily from the sale of our investments during the period.
During the year ended December 31, 2017, we recognized net realized losses of approximately $26.7 million on the portfolio. These net realized losses included gross realized losses of approximately $40.9 million, primarily from the liquidation or write-off of our debt, equity or warrant investments. These losses were offset by gross realized gains of approximately $14.2 million, primarily from the sale of our investments during the period.
The net unrealized appreciation and depreciation of our investments is based on the fair value of each investment determined in good faith by our Board of Directors. The following table summarizes the change in net unrealized appreciation or depreciation of investments for the years ended December 31, 2018, and 2017:
|
|
|
Year Ended December 31, |
|
|||||
|
(in thousands) |
|
2018 |
|
|
2017 |
|
||
|
Gross unrealized appreciation on portfolio investments |
|
$ |
60,648 |
|
|
$ |
130,272 |
|
|
Gross unrealized depreciation on portfolio investments |
|
|
(110,768 |
) |
|
|
(148,345 |
) |
|
Reversal of prior period net unrealized appreciation (depreciation) upon a realization event |
|
|
27,584 |
|
|
|
28,042 |
|
|
Net unrealized appreciation (depreciation) on debt, equity, and warrant investments |
|
|
(22,536 |
) |
|
|
9,969 |
|
|
Other net unrealized appreciation (depreciation) |
|
|
1,390 |
|
|
|
(704 |
) |
|
Total net unrealized appreciation (depreciation) on investments |
|
$ |
(21,146 |
) |
|
$ |
9,265 |
|
During the year ended December 31, 2018, we recorded approximately $21.1 million of net unrealized depreciation, of which $22.5 million is net unrealized depreciation from our debt, equity and warrant investments. We recorded $4.6 million of net unrealized appreciation on our debt investments, which was primarily related to $25.7 million of unrealized appreciation due to loan repayments and the reversal of unrealized depreciation upon write-off. This unrealized appreciation was partially offset by $21.1 million of unrealized depreciation on the debt portfolio, including $17.1 million of unrealized depreciation on collateral-based impairments during the period.
We recorded $24.8 million of net unrealized depreciation on our equity investments and $2.3 million of net unrealized depreciation on our warrant investments during the year ended December 31, 2018. This net unrealized depreciation of $27.1 million was primarily attributable to $29.0 million of unrealized depreciation on the equity and warrant portfolio partially offset by the $1.9 million reversal of unrealized depreciation upon acquisition or liquidation of our equity and warrants investments.
79
During the year ended December 31, 2017, we recorded approximately $9.3 million of net unrealized appreciation, of which $10.0 million is net unrealized appreciation from our debt, equity and warrant investments. We recorded $32.1 million of net unrealized appreciation on our debt investments, which primarily relates to the reversal of $53.7 million of prior period collateral-based impairments and the reversal of $31.0 million of prior period unrealized depreciation upon payoff or liquidation of our debt investments, offset by $49.6 million of unrealized depreciation for collateral-based impairments during the period.
We recorded $32.8 million of net unrealized depreciation on our equity investments for the year ended December 31, 2017, which primarily relates to $51.9 million of unrealized depreciation for collateral-based impairments, offset by $9.7 million and $6.6 million of unrealized appreciation on our public and private equity portfolios, respectively, related to portfolio company and industry performance.
Finally, for the year ended December 31, 2017, we recorded $10.7 million of unrealized appreciation on our warrant investments, which primarily relates to $9.4 million and $5.2 million of unrealized appreciation on our private and public portfolio companies, respectively, related to portfolio company and industry performance. This unrealized appreciation was offset by the reversal of $3.4 million of unrealized appreciation upon being recognized as a gain or loss due to the acquisition or liquidation of our warrant investments.
Income and Excise Taxes
We account for income taxes in accordance with the provisions of ASC Topic 740, Income Taxes, under which income taxes are provided for amounts currently payable and for amounts deferred based upon the estimated future tax effects of differences between the financial statements and tax basis of assets and liabilities given the provisions of the enacted tax law. Valuation allowances may be used to reduce deferred tax assets to the amount likely to be realized. Based upon our previous election and anticipated continued qualification to be subject to taxation as a RIC, we are typically not subject to a material level of federal income taxes. We intend to distribute 100% of our spillover earnings from ordinary income for our taxable year ended December 31, 2018 to our stockholders during 2019.
Net Change in Net Assets Resulting from Operations and Earnings Per Share
For the years ended December 31, 2018 and 2017, we had a net increase in net assets resulting from operations totaling approximately $76.5 million and approximately $79.0 million, respectively.
The basic and fully diluted net change in net assets per common share for the year ended December 31, 2018 was $0.83, whereas the basic and fully diluted net change in net assets per common share for the year ended December 31, 2017 was $0.95.
For the purpose of calculating diluted earnings per share for year ended December 31, 2018, the dilutive effect of the 2022 Convertible Notes, outstanding options and restricted stock units under the treasury stock method was considered. The effect of the 2022 Convertible Notes was excluded from these calculations for the year ended December 31, 2018 as our share price was less than the conversion price in effect which results in anti-dilution.
Comparison of periods ended December 31, 2017 and 2016
Investment Income
Interest Income
Total investment income for the year ended December 31, 2017 was approximately $190.9 million as compared to approximately $175.1 million for the year ended December 31, 2016.
Interest income for the year ended December 31, 2017 totaled approximately $172.2 million as compared to approximately $158.7 million for the year ended December 31, 2016. The increase in interest income for the year ended December 31, 2017 as compared to the year ended December 31, 2016 is primarily attributable to debt investment portfolio growth and an increase in the weighted average principal outstanding between the periods, the acceleration of income due to early repayments and other one-time events during the period and changes in various interest rates, including LIBOR and Prime rates, to the extent our debt investments include variable interest rates. As of December 31, 2017, approximately, 96.4% of the loans in our portfolio had variable rates based on floating Prime or LIBOR rates with a floor.
80
Of the $172.2 million in interest income for the year ended December 31, 2017, approximately $160.3 million represents recurring income from the contractual servicing of our loan portfolio and approximately $11.9 million represents income related to the acceleration of income due to early loan repayments and other onetime events during the period. Income from the contractual servicing of our loan portfolio and the acceleration of interest income due to early loan repayments and other one-time events represented $152.1 million and $6.6 million, respectively, of the $158.7 million interest income for the year ended December 31, 2016.
The following table shows the PIK-related activity, for the years ended December 31, 2017 and 2016, at cost:
|
|
|
Year Ended December 31, |
|
|||||
|
(in thousands) |
|
2017 |
|
|
2016 |
|
||
|
Beginning PIK interest receivable balance |
|
$ |
9,930 |
|
|
$ |
5,149 |
|
|
PIK interest income during the period |
|
|
9,960 |
|
|
|
7,825 |
|
|
PIK accrued (capitalized) to principal |
|
|
129 |
|
|
|
(2,146 |
) |
|
Payments received from PIK loans |
|
|
(2,349 |
) |
|
|
(632 |
) |
|
Realized loss |
|
|
(2,183 |
) |
|
|
(266 |
) |
|
Ending PIK interest receivable balance |
|
$ |
15,487 |
|
|
$ |
9,930 |
|
The increase in PIK interest income during the year ended December 31, 2017 as compared to the year ended December 31, 2016 is due to overall portfolio growth, or more specifically, an increase in the weighted average principal outstanding for loans which bear PIK interest. PIK receivable represents approximately 1% of total debt investments as of December 31, 2017 and December 31, 2016, respectively.
Fee Income
Income from commitment, facility and loan related fees for the year ended December 31, 2017 totaled approximately $18.7 million as compared to approximately $16.3 million for the year ended December 31, 2016. The increase in fee income is primarily attributable to an increase in the acceleration of unamortized fees due to early repayments and one-time fees during the period.
Of the $18.7 million in income from commitment, facility and loan related fees for the year ended December 31, 2017, approximately $6.4 million represents income from recurring fee amortization and approximately $12.3 million represents income related to the acceleration of unamortized fees during the period. Income from recurring fee amortization and the acceleration of unamortized fees due to early loan repayments represented $9.5 million and $6.8 million, respectively, of the $16.3 million income for the year ended December 31, 2016.
In certain investment transactions, we may earn income from advisory services; however, we had no income from advisory services in the years ended December 31, 2017 and 2016, respectively.
Operating Expenses
Our operating expenses are comprised of interest and fees on our borrowings, general and administrative expenses and employee compensation and benefits. Operating expenses totaled approximately $94.4 million and $82.7 million during the years ended December 31, 2017 and 2016, respectively.
Interest and Fees on our Borrowings
Interest and fees on our borrowings totaled approximately $46.6 million and $37.1 million for the years ended December 31, 2017 and 2016, respectively. Interest and fee expense for the year ended December 31, 2017 as compared to December 31, 2016 increased primarily due to higher weighted average principal balances outstanding due to the issuance of our 2022 Convertible Notes and 2022 Notes. The increase in interest and fee expense was partially offset by a reduction in the weighted average principal balance outstanding on our 2019 Notes, which were fully redeemed in February 2017, and on our 2021 Asset Backed Notes, which are amortizing. The increase was further offset by a partial redemption of our 2024 Notes in November 2017.
We had a weighted average cost of debt, comprised of interest and fees, of approximately 5.9% and 5.8% for the years ended December 31, 2017 and 2016, respectively. The slight increase between comparative periods was primarily driven by an increase in the weighted average principal outstanding compared to the prior period, specifically the issuance of our 2022 Convertible Notes and 2022 Notes, partially offset by the accelerations of unamortized deferred financing costs from the full and partial redemptions on our 2019 Notes, and 2024 Notes, and the principal amortization of our 2021 Asset Backed Notes, respectively, during the period.
81
General and Administrative Expenses
General and administrative expenses include legal fees, consulting fees, accounting fees, printer fees, insurance premiums, rent, expenses associated with the workout of underperforming investments and various other expenses. Our general and administrative expenses were $16.1 million for both the years ended December 31, 2017 and 2016, respectively.
Employee Compensation
Employee compensation and benefits totaled approximately $24.6 million for the year ended December 31, 2017 as compared to approximately $22.5 million for the year ended December 31, 2016. The increase between comparative periods was primarily due to changes in variable incentive compensation related to the achievement of origination and strategic corporate objectives.
Employee stock-based compensation totaled approximately $7.2 million for the year ended December 31, 2017 as compared to approximately $7.0 million for the year ended December 31, 2016. The increase between comparative periods was primarily related to the number and amount of restricted stock awards vesting.
Net Investment Realized Gains and Losses and Net Unrealized Appreciation and Depreciation
Realized gains or losses are measured by the difference between the net proceeds from the repayment or sale and the cost basis of an investment without regard to unrealized appreciation or depreciation previously recognized, and includes investments written off during the period, net of recoveries. Net change in unrealized appreciation or depreciation primarily reflects the change in portfolio investment values during the reporting period, including the reversal of previously recorded unrealized appreciation or depreciation when gains or losses are realized.
A summary of realized gains and losses for the years ended December 31, 2017 and 2016 is as follows:
|
|
|
Year Ended December 31, |
|
|||||
|
|
2017 |
|
|
2016 |
|
|||
|
Realized gains |
|
$ |
14,163 |
|
|
$ |
15,202 |
|
|
Realized losses |
|
|
(40,874 |
) |
|
|
(10,626 |
) |
|
Net realized gains (losses) |
|
$ |
(26,711 |
) |
|
$ |
4,576 |
|
During the year ended December 31, 2017, we recognized net realized losses of approximately $26.7 million on the portfolio. These net realized losses included gross realized losses of approximately $40.9 million, primarily from the liquidation or write off of our debt investments in five portfolio companies and our warrant and equity investments in twenty-one portfolio companies. These losses were offset by gross realized gains of approximately $14.2 million, primarily from the sale of investments in five portfolio companies.
During the year ended December 31, 2016, we recognized net realized gains of approximately $4.6 million on the portfolio. These net realized gains included gross realized gains of approximately $15.2 million, primarily from the sale of investments in six portfolio companies. These gains were partially offset by gross realized losses of approximately $10.6 million, primarily from the liquidation or write off of our warrant and equity investments in eight portfolio companies and our debt investments in five portfolio companies, including the settlement of our outstanding debt investment in one portfolio company.
The net unrealized appreciation and depreciation of our investments is based on the fair value of each investment determined in good faith by our Board of Directors. The following table summarizes the change in net unrealized appreciation or depreciation of investments for the years ended December 31, 2017 and 2016:
|
|
|
Year Ended December 31, |
|
|||||
|
(in thousands) |
|
2017 |
|
|
2016 |
|
||
|
Gross unrealized appreciation on portfolio investments |
|
$ |
130,272 |
|
|
$ |
75,264 |
|
|
Gross unrealized depreciation on portfolio investments |
|
|
(148,345 |
) |
|
|
(115,867 |
) |
|
Reversal of prior period net unrealized appreciation (depreciation) upon a realization event |
|
|
28,042 |
|
|
|
4,661 |
|
|
Net unrealized appreciation (depreciation) on debt, equity, and warrant investments |
|
|
9,969 |
|
|
|
(35,942 |
) |
|
Other net unrealized appreciation (depreciation) |
|
|
(704 |
) |
|
|
(275 |
) |
|
Total net unrealized appreciation (depreciation) on investments |
|
$ |
9,265 |
|
|
$ |
(36,217 |
) |
During the year ended December 31, 2017, we recorded approximately $9.3 million of net unrealized appreciation, of which $10.0 million is net unrealized appreciation from our debt, equity and warrant investments. We recorded $32.1 million of net unrealized appreciation on our debt investments, which primarily relates to the reversal of $53.7 million of prior period collateral-based impairments on four portfolio companies and the reversal of $31.0 million of prior period unrealized depreciation upon payoff
82
or liquidation of our debt investments, offset by $49.6 million of unrealized depreciation for collateral-based impairments on eight portfolio companies during the period. We recorded $32.8 million of net unrealized depreciation on our equity investments, which primarily relates to $51.9 million of unrealized depreciation for collateral-based impairments on two portfolio companies, offset by $9.7 million and $6.6 million of unrealized appreciation on our public and private equity portfolios, respectively, related to portfolio company and industry performance. Finally, we recorded $10.7 million of unrealized appreciation on our warrant investments, which primarily relates to $9.4 million and $5.2 million of unrealized appreciation on our private and public portfolio companies, respectively, related to portfolio company and industry performance. This unrealized appreciation was offset by the reversal of $3.4 million of unrealized appreciation upon being recognized as a gain or loss due to the acquisition or liquidation of our warrant investments.
During the year ended December 31, 2016, we recorded approximately $36.2 million of net unrealized depreciation, of which $35.9 million is net unrealized depreciation from our debt, equity and warrant investments. Of the $35.9 million, approximately $14.0 million is attributed to net unrealized depreciation on our debt investments which primarily relates to $50.0 million unrealized depreciation for collateral-based impairments on eight portfolio companies, offset by the reversal of prior period collateral based impairments of $17.3 million on six portfolio companies and the reversal of $13.1 million of prior period unrealized depreciation upon payoff or settling of our debt investments. Approximately $22.2 million is attributed to net unrealized depreciation on our equity investments which primarily relates to approximately $7.4 million of unrealized depreciation for collateral based impairments on two portfolio companies, $6.6 million of unrealized depreciation on our public equity portfolio, with the largest concentration in our investment in Box, Inc. and the reversal of $5.4 million of prior period net unrealized appreciation upon being realized as a gain for our sale of shares of Box, Inc. This unrealized depreciation was partially offset by approximately $245,000 of unrealized appreciation on our warrant investments, which primarily related to $4.8 million of unrealized appreciation on our private portfolio companies, offset by $2.9 million unrealized depreciation on our public portfolio companies related to individual portfolio company performance.
Income and Excise Taxes
We account for income taxes in accordance with the provisions of ASC Topic 740, Income Taxes, under which income taxes are provided for amounts currently payable and for amounts deferred based upon the estimated future tax effects of differences between the financial statements and tax basis of assets and liabilities given the provisions of the enacted tax law. Valuation allowances may be used to reduce deferred tax assets to the amount likely to be realized. Based upon our previous election and anticipated continued qualification to be subject to taxation as a RIC, we are typically not subject to a material level of federal income taxes. We distributed 100% of our spillover earnings, which consisted of ordinary income and long-term capital gains, from our taxable year ended December 31, 2017 to our stockholders during 2018.
Net Change in Net Assets Resulting from Operations and Earnings Per Share
For the years ended December 31, 2017 and 2016, we had a net increase in net assets resulting from operations totaling approximately $79.0 million and approximately $68.7 million, respectively.
The basic and fully diluted net change in net assets per common share for the year ended December 31, 2017 was $0.95, whereas the basic and fully diluted net change in net assets per common share for the year ended December 31, 2016 was $0.91.
For the purpose of calculating diluted earnings per share for year ended December 31, 2017, the dilutive effect of the 2022 Convertible Notes, outstanding options and restricted stock units under the treasury stock method was considered. The effect of the 2022 Convertible Notes was excluded from these calculations for the year ended December 31, 2017 as our share price was less than the conversion price in effect which results in anti-dilution.
Financial Condition, Liquidity and Capital Resources
Our liquidity and capital resources are derived from our SBA debentures, 2022 Notes, 2024 Notes, 2025 Notes, 2033 Notes, 2027 Asset-Backed Notes, 2022 Convertible Notes, Credit Facilities and cash flows from operations, including investment sales and repayments, and income earned. Our primary use of funds from operations includes investments in portfolio companies and payments of fees and other operating expenses we incur. We have used, and expect to continue to use, our borrowings and the proceeds from the turnover of our portfolio and from public and private offerings of securities to finance our investment objectives. We may also raise additional equity or debt capital through registered offerings off a shelf registration, At-The-Market, or ATM, and private offerings of securities, by securitizing a portion of our investments, or by borrowing from the SBA through our SBIC subsidiaries.
On August 16, 2013, we entered into an ATM equity distribution agreement, or the Prior Equity Distribution Agreement, with JMP Securities LLC, or JMP. On March 7, 2016, we renewed the Prior Equity Distribution Agreement and on December 21, 2016, we further amended the agreement to increase the total shares available under the program. The Prior Equity Distribution Agreement, as
83
amended, provided that we may offer and sell up to 12.0 million shares of our common stock from time to time through JMP, as our sales agent.
On September 7, 2017, we terminated the Prior Equity Distribution Agreement and entered into a new ATM equity distribution agreement, or the Equity Distribution Agreement, with JMP. As a result, the remaining shares that were available under the Prior Equity Distribution agreement are no longer available for issuance. The Equity Distribution Agreement provides that we may offer and sell up to 12.0 million shares of its common stock from time to time through JMP, as its sales agent. Sales of our common stock, if any, may be made in negotiated transactions or transactions that are deemed to be “at the market,” as defined in Rule 415 under the Securities Act, including sales made directly on the NYSE or similar securities exchange or sales made to or through a market maker other than on an exchange, at prices related to the prevailing market prices or at negotiated prices.
During the year ended December 31, 2018, we sold 5.1 million shares of common stock, which were issued under the Equity Distribution Agreement for a total accumulated net proceeds of approximately $63.3 million, including $1.5 million of offering expenses. As of December 31, 2018, approximately 5.3 million shares remain available for issuance and sale under the Equity Distribution Agreement. See “– Subsequent Events.”
Our 2016 Convertible Notes were fully settled on or before their contractual maturity date of April 15, 2016. Throughout the life of the 2016 Convertible Notes, holders of approximately $74.8 million of our 2016 Convertible Notes exercised their conversion rights. These 2016 Convertible Notes were settled with a combination of cash equal to the outstanding principal amount of the converted notes and approximately 1.6 million shares of our common stock, or $24.3 million.
On May 2, 2016, we closed an underwritten public offering of an additional $72.9 million in aggregate principal amount of our 2024 Notes. The $72.9 million in aggregate principal amount includes $65.4 million from the initial offering on April 21, 2016 and $7.5 million as a result of underwriters exercising a portion of their option to purchase up to an additional $9.8 million in aggregate principal to cover overallotments on April 29, 2016. On June 27, 2016, we closed an underwritten public offering of an additional $60.0 million in aggregate principal amount of the 2024 Notes. On June 30, 2016, the underwriters exercised their option to purchase up to an additional $9.0 million in aggregate principal to cover overallotments, resulting in total aggregate principal of $69.0 million from the offering. The 2024 Notes rank equally in right of payment and form a single series of notes.
On May 5, 2016, we, through a special purpose wholly-owned subsidiary, Hercules Funding III, as borrower, entered the Union Bank Facility. The Union Bank Facility replaced our credit facility, or the Prior Union Bank Facility, entered into on August 14, 2014 (as amended and restated from time to time) with MUFG Union Bank, N.A., or Union Bank, as the arranger and administrative agent, and the lenders party thereto from time to time. Any references to amounts related to the Union Bank Facility prior to May 5, 2016 were incurred and relate to the Prior Union Bank Facility.
On October 11, 2016, we entered into a debt distribution agreement, pursuant to which we may offer for sale, from time to time, up to $150.0 million in aggregate principal amount of 2024 Notes through FBR Capital Markets & Co. acting as our sales agent. Sales of the 2024 Notes, if any, may be made in negotiated transactions or transactions that are deemed to be “at the market offerings” as defined in Rule 415 under the Securities Act, including sales made directly on the NYSE, or similar securities exchange or sales made through a market maker other than on an exchange at prices related to prevailing market prices or at negotiated prices.
We did not sell any notes under the program during 2018. During the year ended December 31, 2017, we sold 225,457 shares of our 2024 Notes for approximately $5.6 million in aggregate principal amount. As of December 31, 2018, approximately $136.4 million in aggregate principal amount remains available for issuance and sale under the debt distribution agreement.
On January 25, 2017, we issued $230.0 million in aggregate principal amount of 2022 Convertible Notes, which amount includes the additional $30.0 million aggregate principal amount issued pursuant to the initial purchaser’s exercise in full of its overallotment option. The sale generated net proceeds of approximately $225.5 million, including $4.5 million of debt issuance costs. Aggregate issuances costs include the initial purchaser’s discount of approximately $5.2 million, offset by the reimbursement of $1.2 million by the initial purchaser.
On February 24, 2017, we redeemed the $110.4 million remaining outstanding balance of our 2019 Notes in full.
On October 23, 2017, we issued $150.0 million in aggregate principal amount of the 2022 Notes. The 2022 Notes were issued pursuant to an Indenture, dated September 7, 2017, or the 2022 Notes Indenture, between us and U.S. Bank, National Association, as trustee, or the 2022 Trustee. The sale of the 2022 Notes generated net proceeds of approximately $147.4 million, including a public offering discount of $826,500. Aggregate estimated offering expenses in connection with the transaction, including the underwriter’s discount and commissions of approximately $975,000, were approximately $1.8 million.
84
On November 23, 2017, we redeemed $75.0 million of the $258.5 million issued and outstanding aggregate principal amount of our 2024 Notes. On April 2, 2018, we redeemed an additional $100.0 million of the remaining outstanding aggregate principal amount of the 2024 Notes. Further, on December 7, 2018, our Board of Directors approved a full redemption, in two equal transactions, of $83.5 million of the outstanding aggregate principal amount of the 2024 Notes. The 2024 Notes were fully redeemed on January 14, 2019 and February 4, 2019.
On April 26, 2018, we issued $75.0 million in aggregate principal amount of the 2025 Notes pursuant to the Fifth Supplemental Indenture to the Base Indenture, dated April 26, 2018, or the 2025 Notes Indenture. The sale of the 2025 Notes generated net proceeds of approximately $72.4 million. Aggregate estimated offering expenses in connection with the transaction, including the underwriter’s discount and commissions were approximately $2.6 million.
On May 25, 2018, the Company entered into an amendment to the Union Bank Facility. The amendment amends certain provisions of the Union Bank Facility to increase the commitments thereunder from $75.0 million to $100.0 million.
On June 14, 2018, the Company closed its underwritten public offering of 6.9 million shares of common stock, including an over-allotment option to purchase an additional 900,000 shares of common stock, or the June 2018 Equity Offering. The offering generated net proceeds, before expenses, of $81.3 million, including the underwriting discount and commissions of $2.6 million.
On July 31, 2018, we entered into a further amendment to the Wells Facility to extend the maturity date and fully repay the pro-rata portion of outstanding balances of Alostar Bank of Commerce and Everbank Commercial Finance Inc., thereby resigning both as lenders and terminating their commitments thereunder.
On September 20, 2018, we issued $40.0 million in aggregate principal amount of the 2033 Notes pursuant to the Sixth Supplemental Indenture to the Base Indenture, dated September 24, 2018, or the 2033 Notes Indenture. The sale of the 2033 Notes generated net proceeds of approximately $38.8 million. Aggregate estimated offering expenses in connection with the transaction, including the underwriter’s discount and commissions were approximately $1.2 million.
On November 1, 2018, we issued $200.0 million in aggregate principal amount of the 2027 Asset-Backed Notes. The sale of the 2027 Asset-Backed Notes generated net proceeds of approximately $197.2 million. Aggregate estimated offering expenses in connection with the transaction, including the underwriter’s discount and commissions were approximately $2.8 million.
On December 17, 2018, our Board of Directors authorized a stock repurchase plan permitting us to repurchase up to $25.0 million of our common stock. We may repurchase shares of our common stock in the open market, including block purchases, at prices that may be above or below the NAV as reported in the most recently published financial statements, in accordance with the guidelines specified in Rule 10b-18 and Rule 10b5-1 of the Exchange Act. We expect that the share repurchase program will be in effect until June 18, 2019, or until the approved dollar amount has been used to repurchase shares. During the year ended December 31, 2018, we repurchased 376,466 shares of our common stock at an average price per share of $10.77 and a total cost of approximately $4.1 million. As of December 31, 2018, approximately $20.9 million of common stock remain eligible for repurchase under the stock repurchase plan. See “Item 5. Market for Registrant’s Common Equity, Related Stockholder Matters and Issuer Purchases of Equity Securities” for further information on the repurchases made during the period.
At December 31, 2018, we had $149.0 million of SBA debentures, $150.0 million of 2022 Notes, $83.5 million of 2024 Notes, $75.0 million of 2025 Notes, $40.0 million of 2033 Notes, $200.0 million of 2027 Asset-Backed Notes, and $230.0 million of 2022 Convertible Notes payable, along with $13.1 million of borrowings outstanding on the Wells Facility and $39.8 million of borrowings outstanding on the Union Bank Facility.
At December 31, 2018, we had $156.2 million in available liquidity, including $34.2 million in cash and cash equivalents. We had available borrowing capacity of $61.9 million under the Wells Facility and $60.2 million under the Union Bank Facility, subject to existing terms and advance rates and regulatory requirements. We primarily invest cash on hand in interest bearing deposit accounts.
At December 31, 2018, we had $74.5 million of capital outstanding in restricted accounts related to our SBIC that we may use to fund new investments in the SBIC. With our net investment of $74.5 million in HT III, we have the capacity to issue $149.0 million in SBA guaranteed debentures, subject to SBA approval. At December 31, 2018, we have issued $149.0 million in SBA guaranteed debentures in our SBIC subsidiary. On July 13, 2018, we completed repayment of the remaining outstanding HT II debentures and subsequently surrendered the SBA license with respect to HT II.
85
At December 31, 2018, we had approximately $11.6 million of restricted cash, which consists of collections of interest and principal payments on assets that are securitized. In accordance with the terms of the related securitized 2027 Asset-Backed Notes, based on current characteristics of the securitized debt investment portfolio, the restricted funds may be used to pay monthly interest and principal on the securitized debt and are not distributed to us or available for our general operations.
During the year ended December 31, 2018, we principally funded our operations from (i) cash receipts from interest and fee income from our investment portfolio (ii) cash proceeds from the realization of portfolio investments through the repayments of debt investments and the sale of debt and equity investments and (iii) debt and equity offerings along with borrowings on our credit facilities.
During the year ended December 31, 2018, our operating activities used $249.0 million of cash and cash equivalents, compared to $18.4 million used during the year ended December 31, 2017. The $230.6 million increase in cash used by operating activities is primarily due to an increase in investment purchases of $196.0 million, and a decrease in investment repayments of $47.5 million.
During the year ended December 31, 2018, our investing activities used $475,000 of cash, compared to $274,000 used during the year ended December 31, 2017. The $201,000 increase in cash used by investing activities was due to an increase in purchase of capital equipment.
During the year ended December 31, 2018, our financing activities provided $200.3 million of cash, compared to $92.3 million provided during the year ended December 31, 2017. The $108.0 million increase in cash provided by financing activities was primarily due to the issuance of $75.0 million of our 2025 Notes in April 2018, issuance of $40.0 million of our 2033 Notes in September 2018, issuance of $200.0 million of our 2027 Asset-Backed Notes in November 2018, increase in credit facilities borrowings of $345.1 million, and issuance of our common stock of $77.5 million, partially offset by the repayment of $100.0 million of our 2024 Notes in April 2018, increase in repayment of our credit facility borrowings of $287.1 million, and full retirement of our 2021 Asset-Backed Notes.
As of December 31, 2018, net assets totaled $955.4 million, with a NAV per share of $9.90. We intend to continue to operate in order to generate cash flows from operations, including income earned from investments in our portfolio companies. Our primary use of funds will be investments in portfolio companies and cash distributions to holders of our common stock.
The SBCAA, which was signed into law in March 2018, decreased the minimum asset coverage ratio in Section 61(a) of the 1940 Act for business development companies from 200% to 150% (subject to either stockholder approval or approval of both a majority of the board of directors and a majority of directors who are not interested persons). On September 4, 2018 and December 6, 2018, our Board of Directors, including a “required majority” (as such term is defined in Section 57(o) of the 1940 Act) and our stockholders, respectively, approved the application to us of the 150% minimum asset coverage ratio set forth in Section 61(a)(2) of the 1940 Act. As a result, effective December 7, 2018, the asset coverage ratio under the 1940 Act applicable to us decreased from 200% to 150%, permitting us to incur additional leverage. As of December 31, 2018, our asset coverage ratio under our regulatory requirements as a business development company was 214.6%, excluding our SBA debentures as a result of our exemptive order from the SEC that allows us to exclude all SBA leverage from our asset coverage ratio. As a result of the SEC exemptive order, our ratio of total assets on a consolidated basis to outstanding indebtedness may be less than 150%, which while providing increased investment flexibility, also may increase our exposure to risks associated with leverage. Total asset coverage when including our SBA debentures was 197.2% at December 31, 2018.
86
At December 31, 2018 and December 31, 2017, we had the following available borrowings and outstanding amounts:
|
|
|
December 31, 2018 |
|
|
December 31, 2017 |
|
||||||||||||||||||
|
(in thousands) |
|
Total Available |
|
|
Principal |
|
|
Carrying Value (1) |
|
|
Total Available |
|
|
Principal |
|
|
Carrying Value (1) |
|
||||||
|
SBA Debentures (2) |
|
$ |
149,000 |
|
|
$ |
149,000 |
|
|
$ |
147,655 |
|
|
$ |
190,200 |
|
|
$ |
190,200 |
|
|
$ |
188,141 |
|
|
2022 Notes |
|
|
150,000 |
|
|
|
150,000 |
|
|
|
147,990 |
|
|
|
150,000 |
|
|
|
150,000 |
|
|
|
147,572 |
|
|
2024 Notes |
|
|
83,510 |
|
|
|
83,510 |
|
|
|
81,852 |
|
|
|
183,510 |
|
|
|
183,510 |
|
|
|
179,001 |
|
|
2025 Notes |
|
|
75,000 |
|
|
|
75,000 |
|
|
|
72,590 |
|
|
|
— |
|
|
|
— |
|
|
|
— |
|
|
2033 Notes |
|
|
40,000 |
|
|
|
40,000 |
|
|
|
38,427 |
|
|
|
— |
|
|
|
— |
|
|
|
— |
|
|
2021 Asset-Backed Notes (3) |
|
|
— |
|
|
|
— |
|
|
|
— |
|
|
|
49,153 |
|
|
|
49,153 |
|
|
|
48,650 |
|
|
2027 Asset-Backed Notes |
|
|
200,000 |
|
|
|
200,000 |
|
|
|
197,265 |
|
|
|
— |
|
|
|
— |
|
|
|
— |
|
|
2022 Convertible Notes |
|
|
230,000 |
|
|
|
230,000 |
|
|
|
225,051 |
|
|
|
230,000 |
|
|
|
230,000 |
|
|
|
223,488 |
|
|
Wells Facility (4) |
|
|
75,000 |
|
|
|
13,107 |
|
|
|
13,107 |
|
|
|
120,000 |
|
|
|
— |
|
|
|
— |
|
|
Union Bank Facility (4) |
|
|
100,000 |
|
|
|
39,849 |
|
|
|
39,849 |
|
|
|
75,000 |
|
|
|
— |
|
|
|
— |
|
|
Total |
|
$ |
1,102,510 |
|
|
$ |
980,466 |
|
|
$ |
963,786 |
|
|
$ |
997,863 |
|
|
$ |
802,863 |
|
|
$ |
786,852 |
|
|
(1) |
Except for the Wells Facility and Union Bank Facility, all carrying values represent the principal amount outstanding less the remaining unamortized debt issuance costs and unaccreted discount, if any, associated with the loan as of the balance sheet date. See below for the amount of debt issuance cost associated with each borrowing. |
|
(2) |
At December 31, 2018, the total available borrowings under the SBA debentures were $149.0 million, which were available in HT III. On July 13, 2018, we completed repayment of the remaining outstanding HT II debentures and subsequently surrendered the SBA license with respect to HT II. At December 31, 2017, the total available borrowings under the SBA debentures were $190.2 million, of which $41.2 million was available in HT II and $149.0 million was available in HT III. |
|
(3) |
The 2021 Asset-Backed Notes were fully repaid as of October 16, 2018. |
|
(4) |
Availability subject to us meeting the borrowing base requirements. On July 31, 2018, the Wells Facility was reduced to $75.0 million as we fully repaid the pro-rata portion of outstanding balances of Alostar Bank of Commerce and Everbank Commercial Finance Inc. On May 25, 2018, we entered into an amendment to the Union Bank Facility to increase the commitments thereunder from $75.0 million to $100.0 million. See “Note 4 – Borrowings”. |
Debt issuance costs are fees and other direct incremental costs we incur in obtaining debt financing and are recognized as prepaid expenses and amortized over the life of the related debt instrument using the effective yield method or the straight-line method, which closely approximates the effective yield method. In accordance with ASC Subtopic 835-30 (“Interest – Imputation of Interest”), debt issuance costs are presented as a reduction to the associated liability balance on the Consolidated Statement of Assets and Liabilities, except for debt issuance costs associated with line-of-credit arrangements. Debt issuance costs, net of accumulated amortization, as of December 31, 2018 and December 31, 2017 were as follows:
|
(in thousands) |
|
December 31, 2018 |
|
|
December 31, 2017 |
|
||
|
SBA Debentures |
|
$ |
1,345 |
|
|
$ |
2,059 |
|
|
2022 Notes |
|
|
1,379 |
|
|
|
1,633 |
|
|
2024 Notes |
|
|
1,686 |
|
|
|
4,591 |
|
|
2025 Notes |
|
|
2,410 |
|
|
|
— |
|
|
2033 Notes |
|
|
1,573 |
|
|
|
— |
|
|
2021 Asset-Backed Notes (1) |
|
|
— |
|
|
|
503 |
|
|
2027 Asset-Backed Notes |
|
|
2,735 |
|
|
|
— |
|
|
2022 Convertible Notes |
|
|
2,823 |
|
|
|
3,715 |
|
|
Wells Facility (2) |
|
|
100 |
|
|
|
227 |
|
|
Union Bank Facility (2) |
|
|
165 |
|
|
|
379 |
|
|
Total |
|
$ |
14,216 |
|
|
$ |
13,107 |
|
|
(1) |
The 2021 Asset-Backed Notes were fully repaid as of October 16, 2018. |
|
(2) |
As the Wells Facility and Union Bank Facility are line-of-credit arrangements, the debt issuance costs associated with these instruments are presented separately as an asset on the Consolidated Statement of Assets and Liabilities in accordance with ASC Subtopic 835-30. |
Refer to “Note 4 – Borrowings” included in the notes to our consolidated financial statements appearing elsewhere in this report for a discussion of the contract terms, interest expense, and fees associated with each outstanding borrowing as of and for the year ended December 31, 2018.
87
In the normal course of business, we are party to financial instruments with off-balance sheet risk. These consist primarily of unfunded contractual commitments to extend credit, in the form of loans, to our portfolio companies. Unfunded contractual commitments to provide funds to portfolio companies are not reflected on our balance sheet. Our unfunded contractual commitments may be significant from time to time. A portion of these unfunded contractual commitments are dependent upon the portfolio company reaching certain milestones before the debt commitment becomes available. Furthermore, our credit agreements contain customary lending provisions which allow us relief from funding obligations for previously made commitments in instances where the underlying company experiences materially adverse events that affect the financial condition or business outlook for the company. These commitments will be subject to the same underwriting and ongoing portfolio maintenance as are the on-balance sheet financial instruments that we hold. Since these commitments may expire without being drawn upon, the total commitment amount does not necessarily represent future cash requirements. As such, our disclosure of unfunded contractual commitments includes only those which are available at the request of the portfolio company and unencumbered by milestones.
At December 31, 2018, we had approximately $139.0 million of unfunded commitments, including undrawn revolving facilities, which were available at the request of the portfolio company and unencumbered by milestones. We intend to use cash flow from normal and early principal repayments, and proceeds from borrowings and notes to fund these commitments.
We also had approximately $55.5 million of non-binding term sheets outstanding to four new companies, which generally convert to contractual commitments within approximately 90 days of signing. Non-binding outstanding term sheets are subject to completion of our due diligence and final investment committee approval process, as well as the negotiation of definitive documentation with the prospective portfolio companies. Not all non-binding term sheets are expected to close and do not necessarily represent future cash requirements.
The fair value of our unfunded commitments is considered to be immaterial as the yield determined at the time of underwriting is expected to be materially consistent with the yield upon funding, given that interest rates are generally pegged to market indices and given the existence of milestones, conditions and/or obligations imbedded in the borrowing agreements.
As of December 31, 2018, our unfunded contractual commitments available at the request of the portfolio company, including undrawn revolving facilities, and unencumbered by milestones are as follows:
|
(in thousands) |
|
|
|
|
|
Portfolio Company |
|
Unfunded Commitments (1) |
|
|
|
Thumbtack, Inc. |
|
$ |
25,000 |
|
|
Couchbase, Inc. |
|
|
20,000 |
|
|
Impossible Foods, Inc. |
|
|
20,000 |
|
|
Postmates, Inc. |
|
|
15,000 |
|
|
Businessolver.com, Inc. |
|
|
9,563 |
|
|
DocuTAP, Inc. |
|
|
6,000 |
|
|
Achronix Semiconductor Corporation |
|
|
5,000 |
|
|
Clarabridge, Inc. |
|
|
5,000 |
|
|
Evernote Corporation |
|
|
5,000 |
|
|
PH Group Holdings |
|
|
5,000 |
|
|
Xometry, Inc. |
|
|
4,000 |
|
|
Lithium Technologies, Inc. |
|
|
3,623 |
|
|
Fastly, Inc. |
|
|
3,333 |
|
|
Intent Media, Inc. |
|
|
3,000 |
|
|
Emma, Inc. |
|
|
2,963 |
|
|
Convercent, Inc. |
|
|
2,500 |
|
|
Credible Behavioral Health, Inc. |
|
|
2,500 |
|
|
Greenphire, Inc. |
|
|
500 |
|
|
Insurance Technologies Corporation |
|
|
500 |
|
|
Salsa Labs, Inc. |
|
|
500 |
|
|
Total |
|
$ |
138,982 |
|
|
(1) |
Amount represents unfunded commitments, including undrawn revolving facilities, which are available at the request of the portfolio company. Amount excludes unfunded commitments which are unavailable due to the borrower having not met certain milestones. |
88
The following table shows our contractual obligations as of December 31, 2018:
|
|
|
Payments due by period (in thousands) |
|
|||||||||||||||||
|
Contractual Obligations (1) |
|
Total |
|
|
Less than 1 year |
|
|
1 - 3 years |
|
|
3 - 5 years |
|
|
After 5 years |
|
|||||
|
Borrowings (2)(3)(5) |
|
$ |
980,466 |
|
|
$ |
96,617 |
|
|
$ |
103,599 |
|
|
$ |
465,250 |
|
|
$ |
315,000 |
|
|
Operating Lease Obligations (4) |
|
|
15,915 |
|
|
|
3,217 |
|
|
|
5,766 |
|
|
|
5,420 |
|
|
|
1,512 |
|
|
Total |
|
$ |
996,381 |
|
|
$ |
99,834 |
|
|
$ |
109,365 |
|
|
$ |
470,670 |
|
|
$ |
316,512 |
|
|
(1) |
Excludes commitments to extend credit to our portfolio companies. |
|
(2) |
Includes $149.0 million principal outstanding under the SBA debentures, $150.0 million of the 2022 Notes, $83.5 million of the 2024 Notes, $75.0 million of the 2025 Notes, $40.0 million of the 2033 Notes, $200.0 million of the 2027 Asset-Backed Notes, $230.0 million of the 2022 Convertible Notes, $13.1 million under the Wells Facility, and $39.8 million under the Union Credit Facility as of December 31, 2018. |
|
(3) |
Amounts represent future principal repayments and not the carrying value of each liability. See “– Outstanding Borrowings.” |
|
(4) |
Facility leases and licenses. |
|
(5) |
Reflects announced redemption of a portion of the 2024 Notes in December 2018. See “ – Subsequent Events.” |
Certain premises are leased or licensed under agreements which expire at various dates through June 2027. Total rent expense amounted to approximately $2.1 million, $1.8 million and $1.7 million during the years ended December 31, 2018, 2017, and 2016, respectively.
Indemnification Agreements
We have entered into indemnification agreements with our directors and executive officers. The indemnification agreements are intended to provide our directors and executive officers the maximum indemnification permitted under Maryland law and the 1940 Act. Each indemnification agreement provides that we shall indemnify the director or executive officer who is a party to the agreement, or an “Indemnitee,” including the advancement of legal expenses, if, by reason of his or her corporate status, the Indemnitee is, or is threatened to be, made a party to or a witness in any threatened, pending, or completed proceeding, to the maximum extent permitted by Maryland law and the 1940 Act.
We and our executives and directors are covered by Directors and Officers Insurance, with the directors and officers being indemnified by us to the maximum extent permitted by Maryland law subject to the restrictions in the 1940 Act.
Distributions
On February 13, 2019, the Board of Directors declared a cash distribution of $0.31 per share to be paid on March 11, 2019 to shareholders of record as of March 4, 2019. This distribution represents our fifty-fourth consecutive distribution since our IPO, bringing the total cumulative distribution to date to $15.28 per share.
Our Board of Directors maintains a variable distribution policy with the objective of distributing four quarterly distributions in an amount that approximates 90 - 100% of our taxable quarterly income or potential annual income for a particular taxable year. In addition, at the end of our taxable year, our Board of Directors may choose to pay an additional special distribution, or fifth distribution, so that we may distribute approximately all of our annual taxable income in the taxable year in which it was earned, or may elect to maintain the option to spill over our excess taxable income into the following taxable year as part of any future distribution payments.
Distributions from our taxable income (including gains) to a stockholder generally will be treated as a dividend for U.S. federal income tax purposes to the extent of such stockholder’s allocable share of our current or accumulated earnings and profits. Distributions in excess of our current and accumulated earnings and profits would generally be treated first as a return of capital to the extent of a stockholder’s tax basis in our shares, and any remaining distributions would be treated as a capital gain. The determination of the tax attributes of our distributions is made annually as of the end of our taxable year based upon our taxable income for the full taxable year and distributions paid for the full taxable year. Of the distributions declared during the fiscal years ended December 31, 2018, 2017, and 2016, 100% were distributions derived from our current and accumulated earnings and profits. There can be no certainty to stockholders that this determination is representative of what the tax attributes of our 2019 distributions to stockholders will actually be.
We maintain an “opt out” dividend reinvestment plan that provides for reinvestment of our distribution on behalf of our stockholders, unless a stockholder elects to receive cash. As a result, if our Board of Directors authorizes, and we declare a cash distribution, then our stockholders who have not “opted out” of our dividend reinvestment plan will have their cash distribution automatically reinvested in additional shares of our common stock, rather than receiving the cash distributions.
89
Shortly after the close of each calendar year information identifying the source of the distribution (i.e., paid from ordinary income, paid from net capital gains on the sale of securities, and/or a return of paid-in-capital surplus which is a nontaxable distribution, if any) will be provided to our stockholders subject to information reporting. To the extent our taxable earnings fall below the total amount of our distributions for any taxable year, a portion of those distributions may be deemed a tax return of capital to our stockholders.
We expect to qualify to be subject to tax as a RIC under Subchapter M of the Code. In order to be subject to tax as a RIC, we are required to satisfy certain annual gross income and quarterly asset composition tests, as well as make distributions to our stockholders each taxable year treated as dividends for federal income tax purposes of an amount at least equal to 90% of the sum of our investment company taxable income, determined without regard to any deduction for dividends paid, plus our net tax-exempt income, if any. Upon being eligible to be subject to tax as a RIC, we would be entitled to deduct such distributions we pay to our stockholders in determining the overall components of our “taxable income.” Components of our taxable income include our taxable interest, dividend and fee income, reduced by certain deductions, as well as taxable net realized securities gains. Taxable income generally differs from net income for financial reporting purposes due to temporary and permanent differences in the recognition of income and expenses and generally excludes net unrealized appreciation or depreciation as such gains or losses are not included in taxable income until they are realized. In connection with maintaining our ability to be subject to tax as a RIC, among other things, we have made and intend to continue to make the requisite distributions to our stockholders each taxable year, which generally should relieve us from corporate-level U.S. federal income taxes.
As a RIC, we will be subject to a 4% nondeductible U.S. federal excise tax on certain undistributed income and gains unless we make distributions treated as dividends for U.S. federal income tax purposes in a timely manner to our stockholders in respect of each calendar year of an amount at least equal to the Excise Tax Avoidance Requirement. We will not be subject to this excise tax on any amount on which we incurred U.S. federal corporate income tax (such as the tax imposed on a RIC’s retained net capital gains).
Depending on the level of taxable income earned in a taxable year, we may choose to carry over taxable income in excess of current taxable year distributions treated as dividends for U.S. federal income tax purposes from such taxable income into the next taxable year and incur a 4% excise tax on such taxable income, as required. The maximum amount of excess taxable income that may be carried over for distribution in the next taxable year under the Code is the total amount of distributions treated as dividends for U.S. federal income tax purposes paid in the following taxable year, subject to certain declaration and payment guidelines. To the extent we choose to carry over taxable income into the next taxable year, distributions declared and paid by us in a taxable year may differ from our taxable income for that taxable year as such distributions may include the distribution of current taxable year taxable income, the distribution of prior taxable year taxable income carried over into and distributed in the current taxable year, or returns of capital.
We can offer no assurance that we will achieve results that will permit the payment of any cash distributions and, if we issue senior securities, we will be prohibited from making distributions if doing so causes us to fail to maintain the asset coverage ratios stipulated by the 1940 Act or if distributions are limited by the terms of any of our borrowings. Our ability to make distributions will be limited by the asset coverage requirements under the 1940 Act.
We intend to distribute 100% of our spillover earnings from ordinary income for the year ended December 31, 2018 to our stockholders during 2019.
Critical Accounting Policies
The preparation of consolidated financial statements in conformity with U.S. GAAP requires management to make estimates and assumptions that affect the reported amounts of assets and liabilities, and disclosure of contingent assets and liabilities at the date of the consolidated financial statements, and revenues and expenses during the period reported. On an ongoing basis, our management evaluates its estimates and assumptions, which are based on historical experience and on various other assumptions that we believe to be reasonable under the circumstances. Actual results could differ from those estimates. Changes in our estimates and assumptions could materially impact our results of operations and financial condition.
90
The most significant estimate inherent in the preparation of our consolidated financial statements is the valuation of investments and the related amounts of unrealized appreciation and depreciation of investments recorded.
At December 31, 2018, approximately 96.7% of our total assets represented investments in portfolio companies whose fair value is determined in good faith by the Board of Directors. Value, as defined in Section 2(a)(41) of the 1940 Act, is (i) the market price for those securities for which a market quotation is readily available and (ii) for all other securities and assets, fair value is as determined in good faith by the Board of Directors. Our investments are carried at fair value in accordance with the 1940 Act and ASC Topic 946 and measured in accordance with ASC Topic 820. Our debt securities are primarily invested in venture capital-backed companies in technology-related industries including technology, drug discovery and development, biotechnology, life sciences, healthcare, and sustainable and renewable technology at all stages of development. Given the nature of lending to these types of businesses, substantially all of our investments in these portfolio companies are considered Level 3 assets under ASC Topic 820 because there is no known or accessible market or market indexes for these investment securities to be traded or exchanged. As such, we value substantially all of our investments at fair value as determined in good faith pursuant to a consistent valuation policy by our Board of Directors in accordance with the provisions of ASC Topic 820 and the 1940 Act. Due to the inherent uncertainty in determining the fair value of investments that do not have a readily available market value, the fair value of our investments determined in good faith by our Board of Directors may differ significantly from the value that would have been used had a readily available market existed for such investments, and the differences could be material. See “Determination of Net Asset Value” for a discussion of our investment valuation process.
We intend to continue to engage an independent valuation firm to provide us with valuation assistance regarding our determination of the fair value of selected portfolio investments each quarter unless directed by the Board of Directors to cancel such valuation services. Specifically, on a quarterly basis, we will identify portfolio investments with respect to which an independent valuation firm will assist in valuing. We select these portfolio investments based on a number of factors, including, but not limited to, the potential for material fluctuations in valuation results, credit quality and the time lapse since the last valuation of the portfolio investment by an independent valuation firm. The scope of the services rendered by an independent valuation firm is at the discretion of the Board of Directors. Our Board of Directors is ultimately, and solely, responsible for determining the fair value of our investments in good faith.
Refer to “Note 2 – Summary of Significant Accounting Policies” included in the notes to our consolidated financial statements appearing elsewhere in this report for a discussion of our valuation policies for the years ended December 31, 2018 and 2017.
Income Recognition
See “— Changes in Portfolio” for a discussion of our income recognition policies and results during the year ended December 31, 2018 and 2017. See “— Results of Operations” for a comparison of investment income for the year ended December 31, 2018 and 2017.
Stock Based Compensation
We have issued and may, from time to time, issue stock options and restricted stock to employees under the 2018 Equity Incentive Plan and the Director Plan. We follow the guidelines set forth under ASC Topic 718 Compensation – Stock Compensation, to account for stock options granted. Under ASC Topic 718, compensation expense associated with stock-based compensation is measured at the grant date based on the fair value of the award and is recognized over the vesting period. Determining the appropriate fair value model and calculating the fair value of stock-based awards at the grant date requires judgment, including estimating stock price volatility, forfeiture rate and expected option life.
Income Taxes
We intend to operate so as to qualify to be taxed subject to tax as a RIC under Subchapter M of the Code and, as such, will not be subject to federal income tax on the portion of taxable income (including gains) distributed as dividends for U.S. federal income tax purposes to stockholders. Taxable income includes our taxable interest, dividend and fee income, reduced by certain deductions, as well as taxable net realized securities gains. Taxable income generally differs from net income for financial reporting purposes due to temporary and permanent differences in the recognition of income and expenses, and generally excludes net unrealized appreciation or depreciation, as such gains or losses are not included in taxable income until they are realized.
As a RIC, we will be subject to a 4% nondeductible U.S. federal excise tax on certain undistributed income unless we make distributions treated as dividends for U.S. federal income tax purposes in a timely manner to our stockholders in respect of each calendar year of an amount at least equal to the Excise Tax Avoidance Requirement. We will not be subject to this excise tax on any amount on which we incurred U.S. federal corporate income tax (such as the tax imposed on a RIC’s retained net capital gains).
91
Depending on the level of taxable income earned in a taxable year, we may choose to carry over taxable income in excess of current taxable year distributions treated as dividends for U.S. federal income tax purposes from such taxable income into the next taxable year and incur a 4% excise tax on such taxable income, as required. The maximum amount of excess taxable income that may be carried over for distribution in the next taxable year under the Code is the total amount of distributions treated as dividends for U.S. federal income tax purposes paid in the following taxable year, subject to certain declaration and payment guidelines. To the extent we choose to carry over taxable income into the next taxable year, distributions declared and paid by us in a taxable year may differ from taxable income for that taxable year as such distributions may include the distribution of current taxable year taxable income, the distribution of prior taxable year taxable income carried over into and distributed in the current taxable year, or returns of capital.
We intend to distribute 100% of our spillover earnings from ordinary income for the taxable year ended December 31, 2018 to our stockholders during 2019. We distributed 100% of our spillover earnings from ordinary income for our taxable year ended December 31, 2017 to our stockholders during 2018.
Because federal income tax regulations differ from accounting principles generally accepted in the United States, distributions in accordance with tax regulations may differ from net investment income and realized gains recognized for financial reporting purposes. Differences may be permanent or temporary. Permanent differences are reclassified among capital accounts in the financial statements to reflect their appropriate tax character. Permanent differences may also result from the classification of certain items, such as the treatment of short-term gains as ordinary income for tax purposes. Temporary differences arise when certain items of income, expense, gain or loss are recognized at some time in the future.
Subsequent Events
Distribution Declaration
On February 13, 2019, our Board of Directors declared a cash distribution of $0.31 per share to be paid on March 11, 2019 to shareholders of record as of March 4, 2019.This distribution represents our fifty-fourth consecutive distribution since our IPO, bringing the total cumulative distribution to date to $15.28 per share.
Restricted Stock Unit Grants
On January 31, 2019, we granted 922,494 restricted stock units pursuant to the 2018 Equity Incentive Plan.
ATM Equity Program Issuances
Subsequent to December 31, 2018 and as of February 15, 2019, we did not sell any shares under our Equity Distribution Agreement with JMP. As of February 15, 2019 approximately 5.3 million shares remain available for issuance and sale under the equity distribution agreement.
Share Repurchase Program
Subsequent to December 31, 2018 and as of February 15, 2019, we did not repurchase any shares of our common stock. As of February 15, 2019, approximately $20.9 million of common stock remains eligible for repurchase under the stock repurchase plan.
Redemption of 2024 Notes
On December 7, 2018, our Board of Directors approved a full redemption, in two equal transactions, of $83.5 million of the outstanding aggregate principal amount of the 2024 Notes. The 2024 Notes were fully redeemed on January 14, 2019 and February 4, 2019.
Wells Facility
On January 11, 2019, we entered into the Seventh Amendment to the Wells Facility. Among others, the amendment amends certain key provisions of the Wells Facility to increase Wells Fargo Capital Finance’s commitments thereunder from $75.0 million to $125.0 million, reduces the current interest rate to LIBOR plus 3.00% with a natural floor of 3.00%, and extends the maturity date to January 2023.
Union Bank Facility
On February 20, 2019, we, through a special purpose wholly-owned subsidiary, Hercules Funding IV LLC, as borrower, entered into the Loan and Security Agreement, or the 2019 Union Bank Credit Facility, with Union Bank, as the arranger and administrative agent, and the lenders party thereto from time to time. Under the 2019 Union Bank Credit Facility, the lenders have
92
made commitments of $200.0 million and the facility contains an uncommitted accordion feature, in which we can increase the credit line up to an aggregate of $300.0 million. Borrowings under the 2019 Union Bank Credit Facility will generally bear interest at a rate per annum equal to LIBOR plus 2.70%, and the facility will generally have an advance rate of 55% against eligible debt investments. The 2019 Union Bank Credit Facility matures on February 20, 2022, plus a 12-month amortization period, unless sooner terminated in accordance with its terms.
Election of Directors
On January 11, 2019, the Board of Directors elected Carol L. Foster as our director. Ms. Foster will be entitled to the applicable annual retainer and restricted stock awards pursuant to our director compensation arrangements. Ms. Foster will also be entitled to enter into an indemnification agreement with us. Ms. Foster will hold office as a Class I director for a term expiring in 2020 and does not currently serve on any of our committees.
On February 4, 2019, the Board of Directors elected Gayle Crowell as our director. Ms. Crowell will be entitled to the applicable annual retainer and restricted stock awards pursuant to our director compensation arrangements. Ms. Crowell will also be entitled to enter into an indemnification agreement with us. Ms. Crowell will hold office as a Class II director for a term expiring in 2021 and does not currently serve on any committees.
2028 Asset-Backed Notes
On January 22, 2019, we completed a term debt securitization in connection with which an affiliate of ours made an offering of $250,000,000 in aggregate principal amount of the 2028 Asset-Backed Notes, which were rated A(sf) by Kroll Bond Rating Agency, Inc., or KBRA. The Notes were issued by the 2019 Securitization Issuer pursuant to an indenture, dated as of January 22, 2019, by and between U.S. Bank National Association, as indenture trustee, and the 2019 Securitization Issuer, were offered pursuant to a note purchase agreement, dated as of January 14, 2019, by and among us, the 2019 Trust Depositor, the 2019 Securitization Issuer, Guggenheim Securities, LLC, as Initial Purchaser, MUFG Securities Americas Inc., as a co-manager, and Wells Fargo Securities, LLC, as a co-manager, and are backed by a pool of senior loans made to certain portfolio companies of ours and secured by certain assets of those portfolio companies and are to be serviced by us. The outstanding principal balance of the pool of loans as of December 31, 2018 was approximately $357,179,128. Interest on the 2028 Asset-Backed Notes will be paid, to the extent of funds available, at a fixed rate of 4.703% per annum. The 2028 Asset-Backed Notes have a stated maturity of February 22, 2028.
Portfolio Company Developments
As of February 15, 2019, we held warrants or equity positions in five companies that have filed registration statements on Form S-1 with the SEC in contemplation of potential IPOs. Four companies filed confidentially under the JOBS Act and one company filed a preliminary prospectus in connection with a proposed public offering on the Toronto Stock Exchange (TSX). There can be no assurance that these companies will complete their IPOs in a timely manner or at all. In addition, subsequent to December 31, 2018, our portfolio companies announced or completed the following liquidity events:
|
|
1. |
In December 2018, our portfolio company, Art.com, Inc., one of the largest online sellers of art and wall décor globally, entered into a definitive agreement to be acquired by Walmart (NYSE: WMT), a multinational retail corporation that operates a chain of hypermarket, discount department stores and grocery stores. The deal was completed in February 2019. Terms of the acquisition were not disclosed. |
|
|
2. |
In January 2018, our portfolio company, Labcyte, Inc., a global biotechnology tools company developing acoustic liquid handling, was acquired by Beckman Coulter Life Sciences, a developer and manufacturer of products that simplify, automate and innovate complex biomedical testing. Labcyte will transition into Beckman Coulter Life Sciences under the larger Danaher Life Sciences platform of companies. Terms of the acquisition were not disclosed. |
|
|
3. |
In February 2019, our portfolio company Stealth Bio Therapeutics Corp., (NASDAQ: MITO), a clinical-stage biopharmaceutical company developing therapeutics to treat mitochondrial dysfunction, completed its IPO offering 6.5 million American Depositary Shares, or ADS, at an initial public offering price of $12.00 per ADS. |
|
|
4. |
In February 2019, our portfolio company Avedro, Inc. (NASDAQ: AVDR), a leading commercial-stage ophthalmic medical technology company focused on treating corneal ectatic disorders and improving vision to reduce dependency on eyeglasses or contact lenses, completed its IPO offering 5.0 million shares at an initial public offering price of $14.00 per share. |
93
We are subject to financial market risks, including changes in interest rates. Interest rate risk is defined as the sensitivity of our current and future earnings to interest rate volatility, variability of spread relationships, the difference in re-pricing intervals between our assets and liabilities and the effect that interest rates may have on our cash flows. Changes in interest rates may affect both our cost of funding and our interest income from portfolio investments, cash and cash equivalents and idle fund investments. Our investment income will be affected by changes in various interest rates, including LIBOR and Prime rates, to the extent our debt investments include variable interest rates. As of December 31, 2018, approximately 97.3% of the loans in our portfolio had variable rates based on floating Prime or LIBOR rates with a floor. Our borrowings under the Credit Facilities bear interest at a floating rate and the borrowings under our SBA debentures, 2022 Notes, 2024 Notes, 2025 Notes, 2033 Notes, 2027 Asset-Backed Notes, and 2022 Convertible Notes bear interest at a fixed rate. Changes in interest rates can also affect, among other things, our ability to acquire and originate loans and securities and the value of our investment portfolio.
Based on our Consolidated Statement of Assets and Liabilities as of December 31, 2018, the following table shows the approximate annualized increase or decrease in components of net assets resulting from operations of hypothetical base rate changes in interest rates, assuming no changes in our investments and borrowings.
|
(in thousands) |
|
|
|
|
|
|
|
|
|
|
|
|
|
|
|
|
|
|
|
|
Basis Point Change |
|
Interest Income |
|
|
Interest Expense |
|
|
Net Income |
|
|
EPS |
|
|||||||
|
25 |
|
$ |
|
3,911 |
|
|
$ |
|
40 |
|
|
$ |
|
3,871 |
|
|
$ |
0.04 |
|
|
50 |
|
$ |
|
8,048 |
|
|
$ |
|
80 |
|
|
$ |
|
7,968 |
|
|
$ |
0.08 |
|
|
75 |
|
$ |
|
12,203 |
|
|
$ |
|
119 |
|
|
$ |
|
12,084 |
|
|
$ |
0.13 |
|
|
100 |
|
$ |
|
16,372 |
|
|
$ |
|
159 |
|
|
$ |
|
16,213 |
|
|
$ |
0.17 |
|
|
200 |
|
$ |
|
33,052 |
|
|
$ |
|
318 |
|
|
$ |
|
32,734 |
|
|
$ |
0.34 |
|
|
300 |
|
$ |
|
49,403 |
|
|
$ |
|
477 |
|
|
$ |
|
48,926 |
|
|
$ |
0.51 |
|
We do not currently engage in any hedging activities. However, we may, in the future, hedge against interest rate fluctuations (and foreign currency) by using standard hedging instruments such as futures, options, and forward contracts. While hedging activities may insulate us against changes in interest rates (and foreign currency), they may also limit our ability to participate in the benefits of lower interest rates with respect to our borrowed funds and higher interest rates with respect to our portfolio of investments. During the year ended December 31, 2018, we did not engage in interest rate (or foreign currency) hedging activities.
Although we believe that the foregoing analysis is indicative of our sensitivity to interest rate changes, it does not adjust for potential changes in the credit market, credit quality, size and composition of the assets in our portfolio. It also does not adjust for other business developments, including borrowings under our SBA debentures, 2022 Notes, 2024 Notes, 2025 Notes, 2033 Notes, 2027 Asset-Backed Notes, 2022 Convertible Notes, and Credit Facilities, that could affect the net increase in net assets resulting from operations, or net income. It also does not assume any repayments from borrowers. Accordingly, no assurances can be given that actual results would not differ materially from the statement above.
Because we currently borrow, and plan to borrow in the future, money to make investments, our net investment income is dependent upon the difference between the rate at which we borrow funds and the rate at which we invest the funds borrowed. Accordingly, there can be no assurance that a significant change in market interest rates will not have a material adverse effect on our net investment income. In periods of rising interest rates, our cost of funds would increase, which could reduce our net investment income if there is not a corresponding increase in interest income generated by variable rate assets in our investment portfolio.
For additional information regarding the interest rate associated with each of our SBA debentures, 2022 Notes, 2024 Notes, 2025 Notes, 2033 Notes, 2027 Asset-Backed Notes, 2022 Convertible Notes, and Credit Facilities, refer to “Item 7. Management’s Discussion and Analysis of Financial Condition and Results of Operations—Financial Condition, Liquidity and Capital Resources—Outstanding Borrowings” in this report on Form 10-K.
94
INDEX TO FINANCIAL STATEMENTS
95
REPORT OF INDEPENDENT REGISTERED PUBLIC ACCOUNTING FIRM
To the Board of Directors and Shareholders of Hercules Capital, Inc.
Opinions on the Financial Statements and Internal Control over Financial Reporting
We have audited the accompanying consolidated statements of assets and liabilities, including the consolidated schedules of investments, of Hercules Capital, Inc. and its subsidiaries (the “Company”) as of December 31, 2018 and 2017, and the related consolidated statements of operations, changes in net assets and cash flows for each of the three years in the period ended December 31, 2018, including the related notes and financial statement schedule listed in the accompanying index (collectively referred to as the “consolidated financial statements”). We also have audited the Company's internal control over financial reporting as of December 31, 2018 based on criteria established in Internal Control - Integrated Framework (2013) issued by the Committee of Sponsoring Organizations of the Treadway Commission (COSO).
In our opinion, the consolidated financial statements referred to above present fairly, in all material respects, the financial position of the Company as of December 31, 2018 and 2017, and the results of its operations, changes in its net assets and its cash flows for each of the three years in the period ended December 31, 2018 in conformity with accounting principles generally accepted in the United States of America. Also, in our opinion, the Company maintained, in all material respects, effective internal control over financial reporting as of December 31, 2018, based on criteria established in Internal Control - Integrated Framework (2013) issued by the COSO.
Basis for Opinions
The Company's management is responsible for these consolidated financial statements, for maintaining effective internal control over financial reporting, and for its assessment of the effectiveness of internal control over financial reporting, included in Management’s Annual Report on Internal Control over Financial Reporting appearing under Item 9A. Our responsibility is to express opinions on the Company’s consolidated financial statements and on the Company's internal control over financial reporting based on our audits. We are a public accounting firm registered with the Public Company Accounting Oversight Board (United States) (PCAOB) and are required to be independent with respect to the Company in accordance with the U.S. federal securities laws and the applicable rules and regulations of the Securities and Exchange Commission and the PCAOB.
We conducted our audits in accordance with the standards of the PCAOB. Those standards require that we plan and perform the audits to obtain reasonable assurance about whether the consolidated financial statements are free of material misstatement, whether due to error or fraud, and whether effective internal control over financial reporting was maintained in all material respects.
Our audits of the consolidated financial statements included performing procedures to assess the risks of material misstatement of the consolidated financial statements, whether due to error or fraud, and performing procedures that respond to those risks. Such procedures included examining, on a test basis, evidence regarding the amounts and disclosures in the consolidated financial statements. Our audits also included evaluating the accounting principles used and significant estimates made by management, as well as evaluating the overall presentation of the consolidated financial statements. Our procedures included confirmation of securities owned as of December 31, 2018 and 2017 by correspondence with the custodians and portfolio company investees; when replies were not received, we performed other auditing procedures. Our audit of internal control over financial reporting included obtaining an understanding of internal control over financial reporting, assessing the risk that a material weakness exists, and testing and evaluating the design and operating effectiveness of internal control based on the assessed risk. Our audits also included performing such other procedures as we considered necessary in the circumstances. We believe that our audits provide a reasonable basis for our opinions.
96
Definition and Limitations of Internal Control over Financial Reporting
A company’s internal control over financial reporting is a process designed to provide reasonable assurance regarding the reliability of financial reporting and the preparation of financial statements for external purposes in accordance with generally accepted accounting principles. A company’s internal control over financial reporting includes those policies and procedures that (i) pertain to the maintenance of records that, in reasonable detail, accurately and fairly reflect the transactions and dispositions of the assets of the company; (ii) provide reasonable assurance that transactions are recorded as necessary to permit preparation of financial statements in accordance with generally accepted accounting principles, and that receipts and expenditures of the company are being made only in accordance with authorizations of management and directors of the company; and (iii) provide reasonable assurance regarding prevention or timely detection of unauthorized acquisition, use, or disposition of the company’s assets that could have a material effect on the financial statements.
Because of its inherent limitations, internal control over financial reporting may not prevent or detect misstatements. Also, projections of any evaluation of effectiveness to future periods are subject to the risk that controls may become inadequate because of changes in conditions, or that the degree of compliance with the policies or procedures may deteriorate.
/s/ PricewaterhouseCoopers LLP
San Francisco, California
February 21, 2019
We have served as the Company’s auditor since 2010.
97
CONSOLIDATED STATEMENT OF ASSETS AND LIABILITIES
(in thousands, except per share data)
|
|
|
December 31, 2018 |
|
|
December 31, 2017 |
|
||
|
Assets |
|
|
|
|
|
|
|
|
|
Investments: |
|
|
|
|
|
|
|
|
|
Non-control/Non-affiliate investments (cost of $1,830,725 and $1,506,454, respectively) |
|
$ |
1,801,258 |
|
|
$ |
1,491,458 |
|
|
Control investments (cost of $64,799 and $25,419, respectively) |
|
|
57,619 |
|
|
|
19,461 |
|
|
Affiliate investments (cost of $85,000 and $87,956, respectively) |
|
|
21,496 |
|
|
|
31,295 |
|
|
Total investments in securities, at value (cost of $1,980,524 and $1,619,829, respectively) |
|
|
1,880,373 |
|
|
|
1,542,214 |
|
|
Cash and cash equivalents |
|
|
34,212 |
|
|
|
91,309 |
|
|
Restricted cash |
|
|
11,645 |
|
|
|
3,686 |
|
|
Interest receivable |
|
|
16,959 |
|
|
|
12,262 |
|
|
Other assets |
|
|
2,002 |
|
|
|
5,244 |
|
|
Total assets |
|
$ |
1,945,191 |
|
|
$ |
1,654,715 |
|
|
|
|
|
|
|
|
|
|
|
|
Liabilities |
|
|
|
|
|
|
|
|
|
Accounts payable and accrued liabilities |
|
$ |
25,961 |
|
|
$ |
26,896 |
|
|
SBA Debentures, net (principal of $149,000 and $190,200, respectively) (1) |
|
|
147,655 |
|
|
|
188,141 |
|
|
2022 Notes, net (principal of $150,000 and $150,000, respectively) (1) |
|
|
147,990 |
|
|
|
147,572 |
|
|
2024 Notes, net (principal of $83,510 and $183,510, respectively) (1) |
|
|
81,852 |
|
|
|
179,001 |
|
|
2025 Notes, net (principal of $75,000 and $0, respectively) (1) |
|
|
72,590 |
|
|
|
— |
|
|
2033 Notes, net (principal of $40,000 and $0, respectively) (1) |
|
|
38,427 |
|
|
|
— |
|
|
2021 Asset-Backed Notes, net (principal of $0 and $49,153, respectively) (1) |
|
|
— |
|
|
|
48,650 |
|
|
2027 Asset-Backed Notes, net (principal of $200,000 and $0, respectively) (1) |
|
|
197,265 |
|
|
|
— |
|
|
2022 Convertible Notes, net (principal of $230,000 and $230,000, respectively) (1) |
|
|
225,051 |
|
|
|
223,488 |
|
|
Credit Facilities |
|
|
52,956 |
|
|
|
— |
|
|
Total liabilities |
|
$ |
989,747 |
|
|
$ |
813,748 |
|
|
Commitments and Contingencies (Note 10) |
|
|
|
|
|
|
|
|
|
|
|
|
|
|
|
|
|
|
|
Net assets consist of: |
|
|
|
|
|
|
|
|
|
Common stock, par value |
|
|
96 |
|
|
|
85 |
|
|
Capital in excess of par value |
|
|
1,052,269 |
|
|
|
908,501 |
|
|
Total distributable earnings (loss) (2) |
|
|
(92,859 |
) |
|
|
(67,619 |
) |
|
Treasury Stock, at cost, 376,466 shares as of December 31, 2018 and no shares as of December 31, 2017 |
|
|
(4,062 |
) |
|
|
— |
|
|
Total net assets |
|
$ |
955,444 |
|
|
$ |
840,967 |
|
|
Total liabilities and net assets |
|
$ |
1,945,191 |
|
|
$ |
1,654,715 |
|
|
|
|
|
|
|
|
|
|
|
|
Shares of common stock outstanding ($0.001 par value, 96,877,352 shares issued, 200,000,000 authorized) |
|
|
96,501 |
|
|
|
84,424 |
|
|
Net asset value per share |
|
$ |
9.90 |
|
|
$ |
9.96 |
|
|
(1) |
The Company’s SBA debentures, 2022 Notes, 2024 Notes, 2025 Notes, 2033 Notes, 2021 Asset-Backed Notes, 2027 Asset-Backed Notes, and 2022 Convertible Notes, as each term is defined herein, are presented net of the associated debt issuance costs for each instrument. See “Note 4 – Borrowings.” |
|
(2) |
Certain prior year numbers have been adjusted to conform with the SEC final rules on disclosure updates and simplification effective November 5, 2018. See Note 2. |
See notes to consolidated financial statements.
98
The following table presents the assets and liabilities of our consolidated securitization trusts for the 2021 Asset-Backed Notes and the 2027 Asset-Backed Notes (see Note 4), which are variable interest entities, or VIEs. The assets of our securitization VIEs can only be used to settle obligations of our consolidated securitization VIEs, these liabilities are only the obligations of our consolidated securitization VIEs, and the creditors (or beneficial interest holders) do not have recourse to our general credit. These assets and liabilities are included in the Consolidated Statement of Assets and Liabilities above.
|
(Dollars in thousands) |
|
December 31, 2018 |
|
|
December 31, 2017 |
|
||
|
Assets |
|
|
|
|
|
|
|
|
|
Restricted Cash |
|
$ |
11,645 |
|
|
$ |
3,686 |
|
|
Total investments in securities, at value (cost of $279,373 and $146,208, respectively) |
|
|
277,781 |
|
|
|
144,513 |
|
|
Total assets |
|
$ |
289,426 |
|
|
$ |
148,199 |
|
|
|
|
|
|
|
|
|
|
|
|
Liabilities |
|
|
|
|
|
|
|
|
|
2021 Asset-Backed Notes, net (principal of $0 and $49,153, respectively) (1) |
|
$ |
— |
|
|
$ |
48,650 |
|
|
2027 Asset-Backed Notes, net (principal of $200,000 and $0, respectively) (1) |
|
|
197,265 |
|
|
|
— |
|
|
Total liabilities |
|
$ |
197,265 |
|
|
$ |
48,650 |
|
|
(1) |
The Company’s 2021 Asset-Backed Notes and 2027 Asset-Backed Notes are presented net of the associated debt issuance costs. The 2021 Asset-Backed Notes were fully repaid as of October 16, 2018. See “Note 4 – Borrowings.” |
See notes to consolidated financial statements.
99
CONSOLIDATED STATEMENT OF OPERATIONS
(in thousands, except per share data)
|
|
|
For the Year Ended December 31, |
|
|||||||||
|
|
|
2018 |
|
|
2017 |
|
|
2016 |
|
|||
|
Investment income: |
|
|
|
|
|
|
|
|
|
|
|
|
|
Interest income |
|
|
|
|
|
|
|
|
|
|
|
|
|
Non-control/Non-affiliate investments |
|
$ |
185,187 |
|
|
$ |
169,424 |
|
|
$ |
158,489 |
|
|
Control investments |
|
|
3,391 |
|
|
|
1,971 |
|
|
|
78 |
|
|
Affiliate investments |
|
|
2,058 |
|
|
|
801 |
|
|
|
160 |
|
|
Total interest income |
|
|
190,636 |
|
|
|
172,196 |
|
|
|
158,727 |
|
|
Fee income |
|
|
|
|
|
|
|
|
|
|
|
|
|
Non-control/Non-affiliate investments |
|
|
16,776 |
|
|
|
18,630 |
|
|
|
16,318 |
|
|
Control investments |
|
|
5 |
|
|
|
11 |
|
|
|
6 |
|
|
Affiliate investments |
|
|
336 |
|
|
|
43 |
|
|
|
— |
|
|
Total fee income |
|
|
17,117 |
|
|
|
18,684 |
|
|
|
16,324 |
|
|
Total investment income |
|
|
207,753 |
|
|
|
190,880 |
|
|
|
175,051 |
|
|
Operating expenses: |
|
|
|
|
|
|
|
|
|
|
|
|
|
Interest |
|
|
39,435 |
|
|
|
37,857 |
|
|
|
32,016 |
|
|
Loan fees |
|
|
7,260 |
|
|
|
8,728 |
|
|
|
5,042 |
|
|
General and administrative |
|
|
15,488 |
|
|
|
16,105 |
|
|
|
16,106 |
|
|
Employee compensation: |
|
|
|
|
|
|
|
|
|
|
|
|
|
Compensation and benefits |
|
|
25,062 |
|
|
|
24,555 |
|
|
|
22,500 |
|
|
Stock-based compensation |
|
|
11,779 |
|
|
|
7,191 |
|
|
|
7,043 |
|
|
Total employee compensation |
|
|
36,841 |
|
|
|
31,746 |
|
|
|
29,543 |
|
|
Total operating expenses |
|
|
99,024 |
|
|
|
94,436 |
|
|
|
82,707 |
|
|
Other income (loss) |
|
|
— |
|
|
|
— |
|
|
|
8,000 |
|
|
Net investment income |
|
|
108,729 |
|
|
|
96,444 |
|
|
|
100,344 |
|
|
Net realized gain (loss) on investments |
|
|
|
|
|
|
|
|
|
|
|
|
|
Non-control/Non-affiliate investments |
|
|
(4,721 |
) |
|
|
(10,235 |
) |
|
|
4,576 |
|
|
Control investments |
|
|
(4,308 |
) |
|
|
(16,476 |
) |
|
|
— |
|
|
Affiliate investments |
|
|
(2,058 |
) |
|
|
— |
|
|
|
— |
|
|
Total net realized gain (loss) on investments |
|
|
(11,087 |
) |
|
|
(26,711 |
) |
|
|
4,576 |
|
|
Net change in unrealized appreciation (depreciation) on investments |
|
|
|
|
|
|
|
|
|
|
|
|
|
Non-control/Non-affiliate investments |
|
|
(13,082 |
) |
|
|
43,796 |
|
|
|
(29,970 |
) |
|
Control investments |
|
|
(1,222 |
) |
|
|
14,152 |
|
|
|
(4,025 |
) |
|
Affiliate investments |
|
|
(6,842 |
) |
|
|
(48,683 |
) |
|
|
(2,222 |
) |
|
Total net unrealized appreciation (depreciation) on investments |
|
|
(21,146 |
) |
|
|
9,265 |
|
|
|
(36,217 |
) |
|
Total net realized and unrealized gain (loss) |
|
|
(32,233 |
) |
|
|
(17,446 |
) |
|
|
(31,641 |
) |
|
Net increase (decrease) in net assets resulting from operations |
|
$ |
76,496 |
|
|
$ |
78,998 |
|
|
$ |
68,703 |
|
|
|
|
|
|
|
|
|
|
|
|
|
|
|
|
Net investment income before investment gains and losses per common share: |
|
|
|
|
|
|
|
|
|
|
|
|
|
Basic |
|
$ |
1.19 |
|
|
$ |
1.16 |
|
|
$ |
1.34 |
|
|
Change in net assets resulting from operations per common share: |
|
|
|
|
|
|
|
|
|
|
|
|
|
Basic |
|
$ |
0.83 |
|
|
$ |
0.95 |
|
|
$ |
0.91 |
|
|
Diluted |
|
$ |
0.83 |
|
|
$ |
0.95 |
|
|
$ |
0.91 |
|
|
Weighted average shares outstanding |
|
|
|
|
|
|
|
|
|
|
|
|
|
Basic |
|
|
90,929 |
|
|
|
82,519 |
|
|
|
73,753 |
|
|
Diluted |
|
|
91,057 |
|
|
|
82,640 |
|
|
|
73,775 |
|
|
Distributions declared per common share: |
|
|
|
|
|
|
|
|
|
|
|
|
|
Basic |
|
$ |
1.26 |
|
|
$ |
1.24 |
|
|
$ |
1.24 |
|
See notes to consolidated financial statements.
100
CONSOLIDATED STATEMENTS OF CHANGES IN NET ASSETS
(dollars and shares in thousands)
|
|
|
|
|
|
|
|
|
|
|
|
|
|
|
|
|
|
|
|
|
|
|
Provision |
|
|
|
|
|
|
|
|
|
|
|
|
|
|
|
|
|
|
|
|
|
|
|
|
|
|
|
|
|
for Income |
|
|
|
|
|
|
|
|
|
|
|
|
|
|
|
|
|
Capital in |
|
|
Distributable |
|
|
|
|
|
|
Taxes on |
|
|
|
|
|
|||
|
|
|
Common Stock |
|
|
excess |
|
|
Earnings |
|
|
Treasury |
|
|
Investment |
|
|
Net |
|
||||||||||
|
|
|
Shares |
|
|
Par Value |
|
|
of par value |
|
|
(loss)(2) |
|
|
Stock |
|
|
Gains |
|
|
Assets |
|
|||||||
|
Balance at December 31, 2015 |
|
|
72,118 |
|
|
$ |
73 |
|
|
$ |
752,244 |
|
|
$ |
(34,841 |
) |
|
$ |
— |
|
|
$ |
(342 |
) |
|
$ |
717,134 |
|
|
Net increase (decrease) in net assets resulting from operations |
|
|
— |
|
|
|
— |
|
|
|
— |
|
|
|
68,703 |
|
|
|
— |
|
|
|
— |
|
|
|
68,703 |
|
|
Public offering, net of offering expenses |
|
|
7,428 |
|
|
|
7 |
|
|
|
92,820 |
|
|
|
— |
|
|
|
— |
|
|
|
— |
|
|
|
92,827 |
|
|
Issuance of common stock due to stock option exercises |
|
|
55 |
|
|
|
— |
|
|
|
654 |
|
|
|
— |
|
|
|
— |
|
|
|
— |
|
|
|
654 |
|
|
Retired shares from net issuance |
|
|
(17 |
) |
|
|
— |
|
|
|
(235 |
) |
|
|
— |
|
|
|
— |
|
|
|
— |
|
|
|
(235 |
) |
|
Issuance of common stock under restricted stock plan |
|
|
556 |
|
|
|
1 |
|
|
|
(1 |
) |
|
|
— |
|
|
|
— |
|
|
|
— |
|
|
|
— |
|
|
Acquisition of common stock under repurchase plan |
|
|
(450 |
) |
|
|
(1 |
) |
|
|
(4,789 |
) |
|
|
— |
|
|
|
— |
|
|
|
— |
|
|
|
(4,790 |
) |
|
Retired shares for restricted stock vesting |
|
|
(279 |
) |
|
|
— |
|
|
|
(2,944 |
) |
|
|
— |
|
|
|
— |
|
|
|
— |
|
|
|
(2,944 |
) |
|
Distributions reinvested in common stock |
|
|
144 |
|
|
|
— |
|
|
|
1,799 |
|
|
|
— |
|
|
|
— |
|
|
|
— |
|
|
|
1,799 |
|
|
Distributions |
|
|
— |
|
|
|
— |
|
|
|
— |
|
|
|
(92,333 |
) |
|
|
— |
|
|
|
— |
|
|
|
(92,333 |
) |
|
Stock-based compensation (1) |
|
|
— |
|
|
|
— |
|
|
|
7,129 |
|
|
|
— |
|
|
|
— |
|
|
|
— |
|
|
|
7,129 |
|
|
Tax reclassification of stockholders' equity in accordance with generally accepted accounting principles |
|
|
— |
|
|
|
— |
|
|
|
(7,020 |
) |
|
|
6,678 |
|
|
|
— |
|
|
|
342 |
|
|
|
— |
|
|
Balance at December 31, 2016 |
|
|
79,555 |
|
|
$ |
80 |
|
|
$ |
839,657 |
|
|
$ |
(51,793 |
) |
|
$ |
— |
|
|
$ |
— |
|
|
$ |
787,944 |
|
|
Net increase (decrease) in net assets resulting from operations |
|
|
— |
|
|
|
— |
|
|
|
— |
|
|
|
78,998 |
|
|
|
— |
|
|
|
— |
|
|
|
78,998 |
|
|
Public offering, net of offering expenses |
|
|
4,919 |
|
|
|
5 |
|
|
|
66,930 |
|
|
|
— |
|
|
|
— |
|
|
|
— |
|
|
|
66,935 |
|
|
Issuance of common stock due to stock option exercises |
|
|
49 |
|
|
|
— |
|
|
|
500 |
|
|
|
— |
|
|
|
— |
|
|
|
— |
|
|
|
500 |
|
|
Retired shares from net issuance |
|
|
(21 |
) |
|
|
— |
|
|
|
(209 |
) |
|
|
— |
|
|
|
— |
|
|
|
— |
|
|
|
(209 |
) |
|
Issuance of common stock under restricted stock plan |
|
|
10 |
|
|
|
— |
|
|
|
— |
|
|
|
— |
|
|
|
— |
|
|
|
— |
|
|
|
— |
|
|
Retired shares for restricted stock vesting |
|
|
(252 |
) |
|
|
— |
|
|
|
(2,976 |
) |
|
|
— |
|
|
|
— |
|
|
|
— |
|
|
|
(2,976 |
) |
|
Distributions reinvested in common stock |
|
|
164 |
|
|
|
— |
|
|
|
2,202 |
|
|
|
— |
|
|
|
— |
|
|
|
— |
|
|
|
2,202 |
|
|
Issuance of Convertible Notes |
|
|
— |
|
|
|
— |
|
|
|
3,413 |
|
|
|
— |
|
|
|
— |
|
|
|
— |
|
|
|
3,413 |
|
|
Distributions |
|
|
— |
|
|
|
— |
|
|
|
— |
|
|
|
(103,087 |
) |
|
|
— |
|
|
|
— |
|
|
|
(103,087 |
) |
|
Stock-based compensation (1) |
|
|
— |
|
|
|
— |
|
|
|
7,247 |
|
|
|
— |
|
|
|
— |
|
|
|
— |
|
|
|
7,247 |
|
|
Tax reclassification of stockholders' equity in accordance with generally accepted accounting principles |
|
|
— |
|
|
|
— |
|
|
|
(8,263 |
) |
|
|
8,263 |
|
|
|
— |
|
|
|
— |
|
|
|
— |
|
|
Balance at December 31, 2017 |
|
|
84,424 |
|
|
$ |
85 |
|
|
$ |
908,501 |
|
|
$ |
(67,619 |
) |
|
$ |
— |
|
|
$ |
— |
|
|
$ |
840,967 |
|
|
Net increase (decrease) in net assets resulting from operations |
|
|
— |
|
|
|
— |
|
|
|
— |
|
|
|
76,496 |
|
|
|
— |
|
|
|
— |
|
|
|
76,496 |
|
|
Public offering, net of offering expenses |
|
|
12,047 |
|
|
|
11 |
|
|
|
144,680 |
|
|
|
— |
|
|
|
— |
|
|
|
— |
|
|
|
144,691 |
|
|
Issuance of common stock due to stock option exercises |
|
|
63 |
|
|
|
— |
|
|
|
704 |
|
|
|
— |
|
|
|
— |
|
|
|
— |
|
|
|
704 |
|
|
Retired shares from net issuance |
|
|
(57 |
) |
|
|
— |
|
|
|
(718 |
) |
|
|
— |
|
|
|
— |
|
|
|
— |
|
|
|
(718 |
) |
|
Issuance of common stock under restricted stock plan |
|
|
336 |
|
|
|
— |
|
|
|
— |
|
|
|
— |
|
|
|
— |
|
|
|
— |
|
|
|
— |
|
|
Acquisition of common stock under repurchase plan |
|
|
(376 |
) |
|
|
— |
|
|
|
— |
|
|
|
— |
|
|
|
(4,062 |
) |
|
|
— |
|
|
|
(4,062 |
) |
|
Retired shares for restricted stock vesting |
|
|
(95 |
) |
|
|
— |
|
|
|
(1,179 |
) |
|
|
— |
|
|
|
— |
|
|
|
— |
|
|
|
(1,179 |
) |
|
Distributions reinvested in common stock |
|
|
159 |
|
|
|
— |
|
|
|
2,007 |
|
|
|
— |
|
|
|
— |
|
|
|
— |
|
|
|
2,007 |
|
|
Distributions |
|
|
— |
|
|
|
— |
|
|
|
— |
|
|
|
(114,728 |
) |
|
|
— |
|
|
|
— |
|
|
|
(114,728 |
) |
|
Stock-based compensation (1) |
|
|
— |
|
|
|
— |
|
|
|
11,266 |
|
|
|
— |
|
|
|
— |
|
|
|
— |
|
|
|
11,266 |
|
|
Tax reclassification of stockholders' equity in accordance with generally accepted accounting principles |
|
|
— |
|
|
|
— |
|
|
|
(12,992 |
) |
|
|
12,992 |
|
|
|
— |
|
|
|
— |
|
|
|
— |
|
|
Balance at December 31, 2018 |
|
|
96,501 |
|
|
$ |
96 |
|
|
$ |
1,052,269 |
|
|
$ |
(92,859 |
) |
|
$ |
(4,062 |
) |
|
$ |
— |
|
|
$ |
955,444 |
|
|
(1) |
Stock-based compensation includes $41, $57 and $87 of restricted stock and option expense related to director compensation for the years ended December 31, 2018, 2017 and 2016, respectively. |
|
(2) |
Certain prior year numbers have been adjusted to conform with the SEC final rules on disclosure updates and simplification effective November 5, 2018. See Note 2. |
See notes to consolidated financial statements.
101
CONSOLIDATED STATEMENTS OF CASH FLOWS
(in thousands)
|
|
|
For the Year Ended December 31, |
|
|||||||||
|
|
|
2018 |
|
|
2017 |
|
|
2016 |
|
|||
|
Cash flows from operating activities: |
|
|
|
|
|
|
|
|
|
|
|
|
|
Net increase (decrease) in net assets resulting from operations |
|
$ |
76,496 |
|
|
$ |
78,998 |
|
|
$ |
68,703 |
|
|
Adjustments to reconcile net increase in net assets resulting from operations to net cash provided by (used in) operating activities: |
|
|
|
|
|
|
|
|
|
|
|
|
|
Purchase of investments |
|
|
(960,844 |
) |
|
|
(764,795 |
) |
|
|
(680,971 |
) |
|
Principal and fee payments received on investments |
|
|
593,502 |
|
|
|
641,016 |
|
|
|
444,758 |
|
|
Proceeds from the sale of investments |
|
|
19,886 |
|
|
|
23,881 |
|
|
|
18,998 |
|
|
Net unrealized depreciation (appreciation) on investments |
|
|
21,146 |
|
|
|
(9,265 |
) |
|
|
36,217 |
|
|
Net realized loss (gain) on investments |
|
|
11,087 |
|
|
|
26,711 |
|
|
|
(4,576 |
) |
|
Accretion of paid-in-kind principal |
|
|
(9,363 |
) |
|
|
(9,686 |
) |
|
|
(7,319 |
) |
|
Accretion of loan discounts |
|
|
(3,914 |
) |
|
|
(6,711 |
) |
|
|
(7,163 |
) |
|
Accretion of loan discount on convertible notes |
|
|
671 |
|
|
|
615 |
|
|
|
82 |
|
|
Accretion of loan exit fees |
|
|
(17,025 |
) |
|
|
(19,098 |
) |
|
|
(22,614 |
) |
|
Change in deferred loan origination revenue |
|
|
6,095 |
|
|
|
962 |
|
|
|
347 |
|
|
Unearned fees related to unfunded commitments |
|
|
1,064 |
|
|
|
1,048 |
|
|
|
(758 |
) |
|
Amortization of debt fees and issuance costs |
|
|
6,105 |
|
|
|
7,492 |
|
|
|
3,773 |
|
|
Depreciation |
|
|
199 |
|
|
|
201 |
|
|
|
202 |
|
|
Stock-based compensation and amortization of restricted stock grants (1) |
|
|
11,266 |
|
|
|
7,247 |
|
|
|
7,129 |
|
|
Change in operating assets and liabilities: |
|
|
|
|
|
|
|
|
|
|
|
|
|
Interest and fees receivable |
|
|
(4,697 |
) |
|
|
(648 |
) |
|
|
(2,375 |
) |
|
Prepaid expenses and other assets |
|
|
(1,099 |
) |
|
|
(1,097 |
) |
|
|
3,234 |
|
|
Accounts payable |
|
|
11 |
|
|
|
(10 |
) |
|
|
56 |
|
|
Accrued liabilities |
|
|
444 |
|
|
|
4,739 |
|
|
|
3,892 |
|
|
Net cash provided by (used in) operating activities |
|
|
(248,970 |
) |
|
|
(18,400 |
) |
|
|
(138,385 |
) |
|
Cash flows from investing activities: |
|
|
|
|
|
|
|
|
|
|
|
|
|
Purchases of capital equipment |
|
|
(475 |
) |
|
|
(274 |
) |
|
|
(252 |
) |
|
Net cash provided by (used in) investing activities |
|
|
(475 |
) |
|
|
(274 |
) |
|
|
(252 |
) |
|
Cash flows from financing activities: |
|
|
|
|
|
|
|
|
|
|
|
|
|
Issuance of common stock, net |
|
|
144,391 |
|
|
|
66,935 |
|
|
|
92,827 |
|
|
Repurchase of common stock, net |
|
|
(4,062 |
) |
|
|
— |
|
|
|
(4,790 |
) |
|
Retirement of employee shares |
|
|
(893 |
) |
|
|
(2,685 |
) |
|
|
(2,525 |
) |
|
Distributions paid |
|
|
(112,721 |
) |
|
|
(100,885 |
) |
|
|
(90,534 |
) |
|
Issuance of 2022 Convertible Notes |
|
|
— |
|
|
|
230,000 |
|
|
|
— |
|
|
Issuance of 2022 Notes |
|
|
— |
|
|
|
150,000 |
|
|
|
— |
|
|
Issuance of 2024 Notes |
|
|
— |
|
|
|
5,636 |
|
|
|
149,873 |
|
|
Issuance of 2025 Notes |
|
|
75,000 |
|
|
|
— |
|
|
|
— |
|
|
Issuance of 2033 Notes |
|
|
40,000 |
|
|
|
— |
|
|
|
— |
|
|
Issuance of 2027 Asset-Backed Notes |
|
|
200,000 |
|
|
|
— |
|
|
|
— |
|
|
Repayments of 2019 Notes |
|
|
— |
|
|
|
(110,364 |
) |
|
|
— |
|
|
Repayments of 2024 Notes |
|
|
(100,000 |
) |
|
|
(75,000 |
) |
|
|
— |
|
|
Repayments of 2021 Asset-Backed Notes |
|
|
(49,153 |
) |
|
|
(60,053 |
) |
|
|
(20,095 |
) |
|
Repayments of Long-Term SBA Debentures |
|
|
(41,200 |
) |
|
|
— |
|
|
|
— |
|
|
Borrowings of credit facilities |
|
|
353,597 |
|
|
|
8,497 |
|
|
|
285,891 |
|
|
Repayments of credit facilities |
|
|
(300,641 |
) |
|
|
(13,513 |
) |
|
|
(330,877 |
) |
|
Cash paid for debt issuance costs |
|
|
(3,782 |
) |
|
|
(6,342 |
) |
|
|
(5,289 |
) |
|
Cash paid for redemption of convertible notes |
|
|
— |
|
|
|
— |
|
|
|
(17,604 |
) |
|
Fees paid for credit facilities and debentures |
|
|
(229 |
) |
|
|
77 |
|
|
|
(1,261 |
) |
|
Net cash provided by (used in) financing activities |
|
|
200,307 |
|
|
|
92,303 |
|
|
|
55,616 |
|
|
Net increase (decrease) in cash, cash equivalents and restricted cash |
|
|
(49,138 |
) |
|
|
73,629 |
|
|
|
(83,021 |
) |
|
Cash, cash equivalents and restricted cash at beginning of period |
|
|
94,995 |
|
|
|
21,366 |
|
|
|
104,387 |
|
|
Cash, cash equivalents and restricted cash at end of period |
|
$ |
45,857 |
|
|
$ |
94,995 |
|
|
$ |
21,366 |
|
|
Supplemental non-cash investing and financing activities: |
|
|
|
|
|
|
|
|
|
|
|
|
|
Interest paid |
|
$ |
38,960 |
|
|
$ |
33,579 |
|
|
$ |
31,011 |
|
|
Income taxes paid |
|
$ |
713 |
|
|
$ |
1,076 |
|
|
$ |
184 |
|
|
Distributions reinvested |
|
$ |
2,007 |
|
|
$ |
2,202 |
|
|
$ |
1,799 |
|
|
(1) |
Stock-based compensation includes $41, $57 and $87 of restricted stock and option expense related to director compensation for the years ended December 31, 2018, 2017 and 2016, respectively. |
See notes to consolidated financial statements.
102
The following table presents a reconciliation of cash, cash equivalents and restricted cash reported within the Consolidated Statement of Assets and Liabilities that sum to the total of the same such amounts in the Consolidated Statement of Cash Flows:
|
|
|
For the Year Ended December 31, |
|
|||||||||
|
(Dollars in thousands) |
|
2018 |
|
|
2017 |
|
|
2016 |
|
|||
|
Cash and cash equivalents |
|
$ |
34,212 |
|
|
$ |
91,309 |
|
|
$ |
13,044 |
|
|
Restricted cash |
|
|
11,645 |
|
|
|
3,686 |
|
|
|
8,322 |
|
|
Total cash, cash equivalents and restricted cash presented in the Consolidated Statements of Cash Flows |
|
$ |
45,857 |
|
|
$ |
94,995 |
|
|
$ |
21,366 |
|
See “Note 2 – Summary of Significant Accounting Policies” for a description of restricted cash and cash equivalents.
See notes to consolidated financial statements.
103
CONSOLIDATED SCHEDULE OF INVESTMENTS
December 31, 2018
(dollars in thousands)
|
Portfolio Company |
|
|
Sub-Industry |
|
Type of Investment(1) |
|
Maturity Date |
|
Interest Rate and Floor(2) |
|
Principal Amount |
|
|
Cost(3) |
|
|
Value(4) |
|
||||||||||||
|
Debt Investments |
|
|
|
|
|
|
|
|
|
|
|
|
|
|
|
|
|
|
|
|
|
|||||||||
|
Biotechnology Tools |
|
|
|
|
|
|
|
|
|
|
|
|
|
|
|
|
|
|
|
|
|
|||||||||
|
Under 1 Year Maturity |
|
|
|
|
|
|
|
|
|
|
|
|
|
|
|
|
|
|
|
|
|
|||||||||
|
Exicure, Inc. (11) |
|
|
Biotechnology Tools |
|
Senior Secured |
|
September 2019 |
|
Interest rate PRIME + 6.45% or Floor rate of 9.95%, 3.85% Exit Fee |
|
$ |
4,999 |
|
|
$ |
5,165 |
|
|
$ |
5,165 |
|
|||||||||
|
Subtotal: Under 1 Year Maturity |
|
|
|
|
|
|
|
|
|
|
|
|
|
|
|
5,165 |
|
|
|
5,165 |
|
|||||||||
|
Subtotal: Biotechnology Tools (0.54%)* |
|
|
|
|
|
|
|
|
|
|
|
|
5,165 |
|
|
|
5,165 |
|
||||||||||||
|
Consumer & Business Products |
|
|
|
|
|
|
|
|
|
|
|
|
|
|
|
|
|
|
|
|
|
|||||||||
|
1-5 Years Maturity |
|
|
|
|
|
|
|
|
|
|
|
|
|
|
|
|
|
|
|
|
|
|||||||||
|
WHOOP, INC. (12) |
|
|
Consumer & Business Products |
|
Senior Secured |
|
July 2021 |
|
Interest rate PRIME + 3.75% or Floor rate of 8.50%, 6.95% Exit Fee |
|
$ |
6,000 |
|
|
|
6,026 |
|
|
|
5,983 |
|
|||||||||
|
Subtotal: 1-5 Years Maturity |
|
|
|
|
|
|
|
|
|
|
|
|
|
|
|
6,026 |
|
|
|
5,983 |
|
|||||||||
|
Subtotal: Consumer & Business Products (0.63%)* |
|
|
|
|
|
|
|
|
|
|
|
|
6,026 |
|
|
|
5,983 |
|
||||||||||||
|
Diversified Financial Services |
|
|
|
|
|
|
|
|
|
|
|
|
|
|
|
|
|
|
|
|
|
|||||||||
|
1-5 Years Maturity |
|
|
|
|
|
|
|
|
|
|
|
|
|
|
|
|
|
|
|
|
|
|||||||||
|
Gibraltar Business Capital, LLC. (7) |
|
|
Diversified Financial Services |
|
Unsecured |
|
March 2023 |
|
Interest rate FIXED 14.50% |
|
$ |
15,000 |
|
|
|
14,729 |
|
|
|
14,401 |
|
|||||||||
|
Subtotal: 1-5 Years Maturity |
|
|
|
|
|
|
|
|
|
|
|
|
|
|
|
14,729 |
|
|
|
14,401 |
|
|||||||||
|
Subtotal: Diversified Financial Services (1.51%)* |
|
|
|
14,729 |
|
|
|
14,401 |
|
|||||||||||||||||||||
|
Drug Delivery |
|
|
|
|
|
|
|
|
|
|
|
|
|
|
|
|
|
|
|
|
|
|||||||||
|
1-5 Years Maturity |
|
|
|
|
|
|
|
|
|
|
|
|
|
|
|
|
|
|
|
|
|
|||||||||
|
AcelRx Pharmaceuticals, Inc. (11) |
|
|
Drug Delivery |
|
Senior Secured |
|
March 2020 |
|
Interest rate PRIME + 6.05% or Floor rate of 9.55%, 11.69% Exit Fee |
|
$ |
10,936 |
|
|
|
11,926 |
|
|
|
11,842 |
|
|||||||||
|
Antares Pharma Inc. (10)(11)(15) |
|
|
Drug Delivery |
|
Senior Secured |
|
July 2022 |
|
Interest rate PRIME + 4.50% or Floor rate of 9.25%, 4.25% Exit Fee |
|
$ |
25,000 |
|
|
|
25,313 |
|
|
|
25,081 |
|
|||||||||
|
Subtotal: 1-5 Years Maturity |
|
|
|
|
|
|
|
|
|
|
|
|
|
|
|
37,239 |
|
|
|
36,923 |
|
|||||||||
|
Subtotal: Drug Delivery (3.86%)* |
|
|
|
|
|
|
|
|
|
|
|
|
|
|
|
37,239 |
|
|
|
36,923 |
|
|||||||||
See notes to consolidated financial statements.
104
CONSOLIDATED SCHEDULE OF INVESTMENTS
December 31, 2018
(dollars in thousands)
|
Portfolio Company |
|
|
Sub-Industry |
|
Type of Investment(1) |
|
Maturity Date |
|
Interest Rate and Floor(2) |
|
Principal Amount |
|
|
Cost(3) |
|
|
Value(4) |
|
|||
|
Drug Discovery & Development |
|
|
|
|
|
|
|
|
|
|
|
|
|
|
|
|
|
|
|||
|
Under 1 Year Maturity |
|
|
|
|
|
|
|
|
|
|
|
|
|
|
|
|
|
|
|
|
|
|
Auris Medical Holding, AG (5)(10) |
|
|
Drug Discovery & Development |
|
Senior Secured |
|
February 2019 |
|
Interest rate PRIME + 6.05% or Floor rate of 9.55%, 5.75% Exit Fee |
|
$ |
757 |
|
|
$ |
1,471 |
|
|
$ |
1,471 |
|
|
Brickell Biotech, Inc. (12) |
|
|
Drug Discovery & Development |
|
Senior Secured |
|
September 2019 |
|
Interest rate PRIME + 5.70% or Floor rate of 9.20%, 7.82% Exit Fee |
|
$ |
4,808 |
|
|
|
5,281 |
|
|
|
5,281 |
|
|
Epirus Biopharmaceuticals, Inc. (8) |
|
|
Drug Discovery & Development |
|
Senior Secured |
|
June 2019 |
|
Interest rate PRIME + 4.70% or Floor rate of 7.95%, 3.00% Exit Fee |
|
$ |
2,203 |
|
|
|
2,487 |
|
|
|
— |
|
|
Subtotal: Under 1 Year Maturity |
|
|
|
|
|
|
|
|
|
|
|
|
9,239 |
|
|
|
6,752 |
|
|||
|
1-5 Years Maturity |
|
|
|
|
|
|
|
|
|
|
|
|
|
|
|
|
|
|
|
|
|
|
Acacia Pharma Inc. (10)(11) |
|
|
Drug Discovery & Development |
|
Senior Secured |
|
January 2022 |
|
Interest rate PRIME + 4.50% or Floor rate of 9.25%, 3.95% Exit Fee |
|
$ |
10,000 |
|
|
|
9,871 |
|
|
|
9,819 |
|
|
Aveo Pharmaceuticals, Inc. (11) |
|
|
Drug Discovery & Development |
|
Senior Secured |
|
July 2021 |
|
Interest rate PRIME + 4.70% or Floor rate of 9.45%, 5.40% Exit Fee |
|
$ |
10,000 |
|
|
|
10,111 |
|
|
|
10,042 |
|
|
|
|
|
Drug Discovery & Development |
|
Senior Secured |
|
July 2021 |
|
Interest rate PRIME + 4.70% or Floor rate of 9.45%, 3.00% Exit Fee |
|
$ |
10,000 |
|
|
|
10,220 |
|
|
|
10,157 |
|
|
Total Aveo Pharmaceuticals, Inc. |
|
|
|
|
|
|
|
$ |
20,000 |
|
|
|
20,331 |
|
|
|
20,199 |
|
|||
|
Axovant Sciences Ltd. (5)(10)(11)(16) |
|
|
Drug Discovery & Development |
|
Senior Secured |
|
March 2021 |
|
Interest rate PRIME + 6.80% or Floor rate of 10.55% |
|
$ |
50,219 |
|
|
|
49,485 |
|
|
|
49,286 |
|
|
BridgeBio Pharma LLC (13)(16) |
|
|
Drug Discovery & Development |
|
Senior Secured |
|
July 2022 |
|
Interest rate PRIME + 4.35% or Floor rate of 9.35%, 6.35% Exit Fee |
|
$ |
35,000 |
|
|
|
35,054 |
|
|
|
35,263 |
|
|
|
|
|
Drug Discovery & Development |
|
Senior Secured |
|
July 2022 |
|
Interest rate PRIME + 3.35% or Floor rate of 9.10%, 5.75% Exit Fee |
|
$ |
20,000 |
|
|
|
19,904 |
|
|
|
19,904 |
|
|
Total BridgeBio Pharma LLC |
|
|
|
|
|
|
|
$ |
55,000 |
|
|
|
54,958 |
|
|
|
55,167 |
|
|||
|
Chemocentryx, Inc. (10)(15) |
|
|
Drug Discovery & Development |
|
Senior Secured |
|
December 2022 |
|
Interest rate PRIME + 3.30% or Floor rate of 8.05%, 6.25% Exit Fee |
|
$ |
20,000 |
|
|
|
19,957 |
|
|
|
20,104 |
|
|
Genocea Biosciences, Inc. (11) |
|
|
Drug Discovery & Development |
|
Senior Secured |
|
May 2021 |
|
Interest rate PRIME + 2.75% or Floor rate of 7.75%, 10.12% Exit Fee |
|
$ |
14,000 |
|
|
|
14,937 |
|
|
|
14,788 |
|
|
Merrimack Pharmaceuticals, Inc. (12) |
|
|
Drug Discovery & Development |
|
Senior Secured |
|
August 2021 |
|
Interest rate PRIME + 4.00% or Floor rate of 9.25%, 5.55% Exit Fee |
|
$ |
15,000 |
|
|
|
15,024 |
|
|
|
15,024 |
|
|
Mesoblast (5)(10)(11) |
|
|
Drug Discovery & Development |
|
Senior Secured |
|
March 2022 |
|
Interest rate PRIME + 4.95% or Floor rate of 9.45%, 6.95% Exit Fee |
|
$ |
35,000 |
|
|
|
35,346 |
|
|
|
35,190 |
|
|
Metuchen Pharmaceuticals LLC (14) |
|
|
Drug Discovery & Development |
|
Senior Secured |
|
October 2020 |
|
Interest rate PRIME + 7.25% or Floor rate of 10.75%, PIK Interest 1.35%, 2.25% Exit Fee |
|
$ |
18,569 |
|
|
|
19,256 |
|
|
|
19,122 |
|
|
Motif BioSciences Inc. (5)(10)(11)(15) |
|
|
Drug Discovery & Development |
|
Senior Secured |
|
September 2021 |
|
Interest rate PRIME + 5.50% or Floor rate of 10.00%, 2.15% Exit Fee |
|
$ |
15,000 |
|
|
|
14,907 |
|
|
|
14,786 |
|
|
Myovant Sciences, Ltd. (5)(10)(11) |
|
|
Drug Discovery & Development |
|
Senior Secured |
|
November 2021 |
|
Interest rate PRIME + 4.00% or Floor rate of 8.25%, 6.55% Exit Fee |
|
$ |
40,000 |
|
|
|
40,320 |
|
|
|
40,151 |
|
|
Nabriva Therapeutics (5)(10) |
|
|
Drug Discovery & Development |
|
Senior Secured |
|
June 2023 |
|
Interest rate PRIME + 4.30% or Floor rate of 9.80%, 6.95% Exit Fee |
|
$ |
25,000 |
|
|
|
24,750 |
|
|
|
24,750 |
|
|
Paratek Pharmaceuticals, Inc. (p.k.a. Transcept Pharmaceuticals, Inc.) (10)(11)(15)(16) |
|
|
Drug Discovery & Development |
|
Senior Secured |
|
September 2020 |
|
Interest rate PRIME + 2.75% or Floor rate of 8.50%, 4.50% Exit Fee |
|
$ |
40,000 |
|
|
|
40,882 |
|
|
|
40,472 |
|
|
|
|
|
Drug Discovery & Development |
|
Senior Secured |
|
September 2021 |
|
Interest rate PRIME + 2.75% or Floor rate of 8.50%, 4.50% Exit Fee |
|
$ |
10,000 |
|
|
|
10,240 |
|
|
|
10,137 |
|
|
|
|
|
Drug Discovery & Development |
|
Senior Secured |
|
September 2021 |
|
Interest rate PRIME + 2.75% or Floor rate of 8.50%, 2.25% Exit Fee |
|
$ |
10,000 |
|
|
|
10,084 |
|
|
|
9,925 |
|
|
|
|
|
Drug Discovery & Development |
|
Senior Secured |
|
August 2022 |
|
Interest rate PRIME + 2.10% or Floor rate of 7.85%, 6.95% Exit Fee |
|
$ |
10,000 |
|
|
|
10,014 |
|
|
|
10,014 |
|
|
Total Paratek Pharmaceuticals, Inc. (p.k.a. Transcept Pharmaceuticals, Inc.) |
|
$ |
70,000 |
|
|
|
71,220 |
|
|
|
70,548 |
|
|||||||||
|
Stealth Bio Therapeutics Corp. (5)(10)(11) |
|
|
Drug Discovery & Development |
|
Senior Secured |
|
January 2021 |
|
Interest rate PRIME + 5.50% or Floor rate of 9.50%, 6.25% Exit Fee |
|
$ |
19,313 |
|
|
|
19,740 |
|
|
|
19,597 |
|
|
Tricida, Inc. (11)(15) |
|
|
Drug Discovery & Development |
|
Senior Secured |
|
March 2022 |
|
Interest rate PRIME + 3.35% or Floor rate of 8.85%, 8.19% Exit Fee |
|
$ |
40,000 |
|
|
|
39,622 |
|
|
|
39,794 |
|
|
uniQure B.V. (5)(10)(11) |
|
|
Drug Discovery & Development |
|
Senior Secured |
|
June 2023 |
|
Interest rate PRIME + 3.35% or Floor rate of 8.85%, 7.72% Exit Fee |
|
$ |
35,000 |
|
|
|
35,538 |
|
|
|
35,386 |
|
|
Verastem, Inc. (11) |
|
|
Drug Discovery & Development |
|
Senior Secured |
|
December 2020 |
|
Interest rate PRIME + 6.00% or Floor rate of 10.50%, 4.50% Exit Fee |
|
$ |
5,000 |
|
|
|
5,058 |
|
|
|
5,059 |
|
|
|
|
|
Drug Discovery & Development |
|
Senior Secured |
|
December 2020 |
|
Interest rate PRIME + 6.00% or Floor rate of 10.50%, 4.50% Exit Fee |
|
$ |
5,000 |
|
|
|
5,082 |
|
|
|
5,083 |
|
|
|
|
|
Drug Discovery & Development |
|
Senior Secured |
|
December 2020 |
|
Interest rate PRIME + 6.00% or Floor rate of 10.50%, 4.50% Exit Fee |
|
$ |
5,000 |
|
|
|
5,057 |
|
|
|
5,057 |
|
|
|
|
|
Drug Discovery & Development |
|
Senior Secured |
|
December 2020 |
|
Interest rate PRIME + 6.00% or Floor rate of 10.50%, 4.50% Exit Fee |
|
$ |
10,000 |
|
|
|
10,033 |
|
|
|
9,976 |
|
|
Total Verastem, Inc. |
|
|
|
|
|
|
|
|
|
|
$ |
25,000 |
|
|
|
25,230 |
|
|
|
25,175 |
|
|
X4 Pharmaceuticals Inc. |
|
|
Drug Discovery & Development |
|
Senior Secured |
|
November 2021 |
|
Interest rate PRIME + 4.25% or Floor rate of 9.50%, 7.95% Exit Fee |
|
$ |
10,000 |
|
|
|
9,746 |
|
|
|
9,746 |
|
|
Subtotal: 1-5 Years Maturity |
|
|
|
|
|
|
|
|
|
|
|
|
|
|
|
520,238 |
|
|
|
518,632 |
|
|
Subtotal: Drug Discovery & Development (54.99%)* |
|
|
|
|
|
|
529,477 |
|
|
|
525,384 |
|
|||||||||
See notes to consolidated financial statements.
105
CONSOLIDATED SCHEDULE OF INVESTMENTS
December 31, 2018
(dollars in thousands)
|
Portfolio Company |
|
|
Sub-Industry |
|
Type of Investment(1) |
|
Maturity Date |
|
Interest Rate and Floor(2) |
|
Principal Amount |
|
|
Cost(3) |
|
|
Value(4) |
|
||||||||||||||||
|
Electronics & Computer Hardware |
|
|
|
|
|
|
|
|
|
|
|
|
|
|
|
|
|
|
|
|
|
|||||||||||||
|
1-5 Years Maturity |
|
|
|
|
|
|
|
|
|
|
|
|
|
|
|
|
|
|
|
|
|
|||||||||||||
|
908 DEVICES INC. (15) |
|
|
Electronics & Computer Hardware |
|
Senior Secured |
|
September 2020 |
|
Interest rate PRIME + 4.00% or Floor rate of 8.25%, 4.25% Exit Fee |
|
$ |
10,000 |
|
|
$ |
10,145 |
|
|
$ |
10,155 |
|
|||||||||||||
|
Glo AB (5)(10)(13)(14) |
|
|
Electronics & Computer Hardware |
|
Senior Secured |
|
February 2021 |
|
Interest rate PRIME + 6.20% or Floor rate of 10.45%, PIK Interest 1.75%, 2.95% Exit Fee |
|
$ |
12,192 |
|
|
|
12,265 |
|
|
|
5,556 |
|
|||||||||||||
|
Subtotal: 1-5 Years Maturity |
|
|
|
|
|
|
22,410 |
|
|
|
15,711 |
|
||||||||||||||||||||||
|
Subtotal: Electronics & Computer Hardware (1.64%)* |
|
|
|
|
|
22,410 |
|
|
|
15,711 |
|
|||||||||||||||||||||||
|
Healthcare Services, Other |
|
|
|
|
|
|
|
|
|
|
|
|
||||||||||||||||||||||
|
1-5 Years Maturity |
|
|
|
|
|
|
|
|
|
|
|
|
|
|
|
|
|
|
|
|
|
|||||||||||||
|
Oak Street Health (12) |
|
|
Healthcare Services, Other |
|
Senior Secured |
|
September 2021 |
|
Interest rate PRIME + 5.00% or Floor rate of 9.75%, 5.95% Exit Fee |
|
$ |
30,000 |
|
|
|
30,486 |
|
|
|
30,338 |
|
|||||||||||||
|
PH Group Holdings (13)(17) |
|
|
Healthcare Services, Other |
|
Senior Secured |
|
September 2020 |
|
Interest rate PRIME + 7.45% or Floor rate of 10.95% |
|
$ |
20,000 |
|
|
|
19,889 |
|
|
|
19,806 |
|
|||||||||||||
|
|
|
|
Healthcare Services, Other |
|
Senior Secured |
|
September 2020 |
|
Interest rate PRIME + 7.45% or Floor rate of 10.95% |
|
$ |
10,000 |
|
|
|
9,938 |
|
|
|
9,896 |
|
|||||||||||||
|
Total PH Group Holdings |
|
$ |
30,000 |
|
|
|
29,827 |
|
|
|
29,702 |
|
||||||||||||||||||||||
|
Subtotal: 1-5 Years Maturity |
|
|
|
|
|
|
60,313 |
|
|
|
60,040 |
|
||||||||||||||||||||||
|
Subtotal: Healthcare Services, Other (6.28%)* |
|
|
|
|
|
|
60,313 |
|
|
|
60,040 |
|
||||||||||||||||||||||
|
Information Services |
|
|
|
|
|
|
|
|
|
|
|
|
|
|
|
|
|
|
|
|
|
|||||||||||||
|
1-5 Years Maturity |
|
|
|
|
|
|
|
|
|
|
|
|
|
|
|
|
|
|
|
|
|
|||||||||||||
|
MDX Medical, Inc. (14)(15)(19) |
|
|
Information Services |
|
Senior Secured |
|
December 2020 |
|
Interest rate PRIME + 4.00% or Floor rate of 8.25%, PIK Interest 1.70% |
|
$ |
15,288 |
|
|
|
15,037 |
|
|
|
14,987 |
|
|||||||||||||
|
Subtotal: 1-5 Years Maturity |
|
|
|
|
|
|
15,037 |
|
|
|
14,987 |
|
||||||||||||||||||||||
|
Subtotal: Information Services (1.57%)* |
|
|
|
|
|
|
15,037 |
|
|
|
14,987 |
|
||||||||||||||||||||||
See notes to consolidated financial statements.
106
CONSOLIDATED SCHEDULE OF INVESTMENTS
December 31, 2018
(dollars in thousands)
|
Portfolio Company |
|
|
Sub-Industry |
|
Type of Investment(1) |
|
Maturity Date |
|
Interest Rate and Floor(2) |
|
Principal Amount |
|
|
Cost(3) |
|
|
Value(4) |
|
|||
|
Internet Consumer & Business Services |
|
|
|
|
|
|
|
|
|
|
|
|
|
|
|
|
|
|
|
|
|
|
Under 1 Year Maturity |
|
|
|
|
|
|
|
|
|
|
|
|
|
|
|
|
|
|
|
|
|
|
LogicSource |
|
|
Internet Consumer & Business Services |
|
Senior Secured |
|
October 2019 |
|
Interest rate PRIME + 6.25% or Floor rate of 9.75%, 5.00% Exit Fee |
|
$ |
3,099 |
|
|
$ |
3,486 |
|
|
$ |
3,486 |
|
|
The Faction Group LLC (11) |
|
|
Internet Consumer & Business Services |
|
Senior Secured |
|
January 2019 |
|
Interest rate PRIME + 4.75% or Floor rate of 8.25% |
|
$ |
2,000 |
|
|
|
2,000 |
|
|
|
2,000 |
|
|
Subtotal: Under 1 Year Maturity |
|
|
|
|
|
|
|
|
|
|
|
|
|
|
|
5,486 |
|
|
|
5,486 |
|
|
1-5 Years Maturity |
|
|
|
|
|
|
|
|
|
|
|
|
|
|
|
|
|
|
|
|
|
|
AppDirect, Inc. (11)(19) |
|
|
Internet Consumer & Business Services |
|
Senior Secured |
|
January 2022 |
|
Interest rate PRIME + 5.70% or Floor rate of 9.95%, 3.45% Exit Fee |
|
$ |
20,000 |
|
|
|
20,006 |
|
|
|
19,941 |
|
|
Art.com, Inc. (12)(14)(15) |
|
|
Internet Consumer & Business Services |
|
Senior Secured |
|
April 2021 |
|
Interest rate PRIME + 5.40% or Floor rate of 10.15%, PIK Interest 1.70%, 1.50% Exit Fee |
|
$ |
10,117 |
|
|
|
10,020 |
|
|
|
10,028 |
|
|
Cloudpay, Inc. (5)(10) |
|
|
Internet Consumer & Business Services |
|
Senior Secured |
|
April 2022 |
|
Interest rate PRIME + 4.05% or Floor rate of 8.55%, 6.95% Exit Fee |
|
$ |
11,000 |
|
|
|
11,017 |
|
|
|
11,020 |
|
|
Contentful, Inc. (5)(10)(14) |
|
|
Internet Consumer & Business Services |
|
Senior Secured |
|
July 2022 |
|
Interest rate PRIME + 2.95% or Floor rate of 7.95%, PIK Interest 1.25% |
|
$ |
3,750 |
|
|
|
3,692 |
|
|
|
3,692 |
|
|
Convercent, Inc. (14)(15)(17) |
|
|
Internet Consumer & Business Services |
|
Senior Secured |
|
July 2022 |
|
Interest rate PRIME + 2.55% or Floor rate of 7.80%, PIK Interest 2.95%, 1.00% Exit Fee |
|
$ |
7,500 |
|
|
|
7,419 |
|
|
|
7,419 |
|
|
EverFi, Inc. (11)(14)(16) |
|
|
Internet Consumer & Business Services |
|
Senior Secured |
|
May 2022 |
|
Interest rate PRIME + 3.90% or Floor rate of 8.65%, PIK Interest 2.30% |
|
$ |
60,729 |
|
|
|
60,687 |
|
|
|
60,408 |
|
|
Fastly, Inc. (17)(19) |
|
|
Internet Consumer & Business Services |
|
Senior Secured |
|
December 2021 |
|
Interest rate PRIME + 4.25%, 1.50% Exit Fee |
|
$ |
6,667 |
|
|
|
6,563 |
|
|
|
6,563 |
|
|
First Insight, Inc. (15) |
|
|
Internet Consumer & Business Services |
|
Senior Secured |
|
November 2021 |
|
Interest rate PRIME + 6.25% or Floor rate of 11.25% |
|
$ |
7,500 |
|
|
|
7,368 |
|
|
|
7,375 |
|
|
Greenphire, Inc. (17) |
|
|
Internet Consumer & Business Services |
|
Senior Secured |
|
January 2021 |
|
Interest rate 3-month LIBOR + 8.00% or Floor rate of 9.00% |
|
$ |
2,776 |
|
|
|
2,776 |
|
|
|
2,785 |
|
|
|
|
|
Internet Consumer & Business Services |
|
Senior Secured |
|
January 2021 |
|
Interest rate PRIME + 3.75% or Floor rate of 7.00% |
|
$ |
1,500 |
|
|
|
1,500 |
|
|
|
1,498 |
|
|
Total Greenphire, Inc. |
|
|
|
|
|
|
|
|
|
|
$ |
4,276 |
|
|
|
4,276 |
|
|
|
4,283 |
|
|
Intent Media, Inc. (12)(17) |
|
|
Internet Consumer & Business Services |
|
Senior Secured |
|
September 2021 |
|
Interest rate PRIME + 5.13% or Floor rate of 10.125%, 2.00% Exit Fee |
|
$ |
12,200 |
|
|
|
12,210 |
|
|
|
12,147 |
|
|
Interactions Corporation (11)(19) |
|
|
Internet Consumer & Business Services |
|
Senior Secured |
|
March 2021 |
|
Interest rate 3-month LIBOR + 8.60% or Floor rate of 9.85%, 1.75% Exit Fee |
|
$ |
25,000 |
|
|
|
25,092 |
|
|
|
24,987 |
|
|
Postmates, Inc. (17)(19) |
|
|
Internet Consumer & Business Services |
|
Senior Secured |
|
September 2022 |
|
Interest rate PRIME + 3.85% or Floor rate of 8.85%, 8.05% Exit Fee |
|
$ |
20,000 |
|
|
|
19,666 |
|
|
|
19,666 |
|
|
RumbleON, Inc. |
|
|
Internet Consumer & Business Services |
|
Senior Secured |
|
May 2021 |
|
Interest rate PRIME + 5.75% or Floor rate of 10.25%, 4.55% Exit Fee |
|
$ |
5,000 |
|
|
|
5,018 |
|
|
|
4,984 |
|
|
|
|
|
Internet Consumer & Business Services |
|
Senior Secured |
|
October 2021 |
|
Interest rate PRIME + 5.75% or Floor rate of 10.25%, 2.95% Exit Fee |
|
$ |
5,000 |
|
|
|
4,941 |
|
|
|
4,941 |
|
|
Total RumbleON, Inc. |
|
|
|
|
|
|
|
|
|
|
$ |
10,000 |
|
|
|
9,959 |
|
|
|
9,925 |
|
|
Snagajob.com, Inc. (13)(14) |
|
|
Internet Consumer & Business Services |
|
Senior Secured |
|
July 2020 |
|
Interest rate PRIME + 5.15% or Floor rate of 9.15%, PIK Interest 1.95%, 2.55% Exit Fee |
|
$ |
41,841 |
|
|
|
42,139 |
|
|
|
42,075 |
|
|
|
|
|
Internet Consumer & Business Services |
|
Senior Secured |
|
July 2020 |
|
Interest rate PRIME + 5.65% or Floor rate of 10.65%, PIK Interest 1.95%, 2.55% Exit Fee |
|
$ |
5,033 |
|
|
|
4,867 |
|
|
|
4,867 |
|
|
Total Snagajob.com, Inc. |
|
|
|
|
|
|
|
|
|
|
$ |
46,874 |
|
|
|
47,006 |
|
|
|
46,942 |
|
|
Tectura Corporation (7)(8)(9)(14) |
|
|
Internet Consumer & Business Services |
|
Senior Secured |
|
June 2021 |
|
Interest rate FIXED 6.00%, PIK Interest 3.00% |
|
$ |
20,924 |
|
|
|
20,924 |
|
|
|
18,128 |
|
|
|
|
|
Internet Consumer & Business Services |
|
Senior Secured |
|
June 2021 |
|
PIK Interest 8.00% |
|
$ |
10,680 |
|
|
|
240 |
|
|
|
— |
|
|
Total Tectura Corporation |
|
|
|
|
|
|
|
|
|
|
$ |
31,604 |
|
|
|
21,164 |
|
|
|
18,128 |
|
|
The Faction Group LLC (11) |
|
|
Internet Consumer & Business Services |
|
Senior Secured |
|
January 2021 |
|
Interest rate 3-month LIBOR + 9.25% or Floor rate of 10.25% |
|
$ |
6,667 |
|
|
|
6,667 |
|
|
|
6,653 |
|
|
Wheels Up Partners LLC (11) |
|
|
Internet Consumer & Business Services |
|
Senior Secured |
|
July 2022 |
|
Interest rate 3-month LIBOR + 8.55% or Floor rate of 9.55% |
|
$ |
20,241 |
|
|
|
20,076 |
|
|
|
19,921 |
|
|
Xometry, Inc. (13)(17)(19) |
|
|
Internet Consumer & Business Services |
|
Senior Secured |
|
November 2021 |
|
Interest rate PRIME + 3.95% or Floor rate of 8.45%, 7.09% Exit Fee |
|
$ |
11,000 |
|
|
|
10,997 |
|
|
|
10,995 |
|
|
Subtotal: 1-5 Years Maturity |
|
|
|
|
|
|
303,885 |
|
|
|
300,093 |
|
|||||||||
|
Subtotal: Internet Consumer & Business Services (31.98%)* |
|
|
|
|
|
|
309,371 |
|
|
|
305,579 |
|
|||||||||
See notes to consolidated financial statements.
107
CONSOLIDATED SCHEDULE OF INVESTMENTS
December 31, 2018
(dollars in thousands)
|
Portfolio Company |
|
|
Sub-Industry |
|
Type of Investment(1) |
|
Maturity Date |
|
Interest Rate and Floor(2) |
|
Principal Amount |
|
|
Cost(3) |
|
|
Value(4) |
|
|||
|
Media/Content/Info |
|
|
|
|
|
|
|
|
|
|
|
|
|
|
|
|
|
|
|
|
|
|
1-5 Years Maturity |
|
|
|
|
|
|
|
|
|
|
|
|
|
|
|
|
|
|
|
|
|
|
Bustle (14)(15) |
|
|
Media/Content/Info |
|
Senior Secured |
|
June 2021 |
|
Interest rate PRIME + 4.10% or Floor rate of 8.35%, PIK Interest 1.95%, 3.12% Exit Fee |
|
$ |
15,315 |
|
|
$ |
15,336 |
|
|
$ |
15,453 |
|
|
Subtotal: 1-5 Years Maturity |
|
|
|
|
|
|
15,336 |
|
|
|
15,453 |
|
|||||||||
|
Subtotal: Media/Content/Info (1.62%)* |
|
|
|
|
|
|
15,336 |
|
|
|
15,453 |
|
|||||||||
|
Medical Devices & Equipment |
|
|
|
|
|
|
|
|
|
|
|
|
|
|
|
|
|
|
|
|
|
|
Under 1 Year Maturity |
|
|
|
|
|
|
|
|
|
|
|
|
|
|
|
|
|
|
|
|
|
|
Micell Technologies, Inc. (11) |
|
|
Medical Devices & Equipment |
|
Senior Secured |
|
August 2019 |
|
Interest rate PRIME + 7.25% or Floor rate of 10.50%, 5.00% Exit Fee |
|
$ |
2,323 |
|
|
|
2,724 |
|
|
|
2,405 |
|
|
Subtotal: Under 1 Year Maturity |
|
|
|
|
|
|
|
|
|
|
|
|
|
|
|
2,724 |
|
|
|
2,405 |
|
|
1-5 Years Maturity |
|
|
|
|
|
|
|
|
|
|
|
|
|
|
|
|
|
|
|
|
|
|
Flowonix Medical, Inc. (11)(14) |
|
|
Medical Devices & Equipment |
|
Senior Secured |
|
October 2021 |
|
Interest rate PRIME + 4.00% or Floor rate of 9.00%, PIK Interest 0.5%, 7.95% Exit Fee |
|
$ |
15,007 |
|
|
|
14,673 |
|
|
|
14,673 |
|
|
Intuity Medical, Inc. (11)(15) |
|
|
Medical Devices & Equipment |
|
Senior Secured |
|
June 2021 |
|
Interest rate PRIME + 5.00% or Floor rate of 9.25%, 5.95% Exit Fee |
|
$ |
17,500 |
|
|
|
17,504 |
|
|
|
17,417 |
|
|
Quanta Fluid Solutions (5)(10) |
|
|
Medical Devices & Equipment |
|
Senior Secured |
|
April 2020 |
|
Interest rate PRIME + 8.05% or Floor rate of 11.55%, 5.00% Exit Fee |
|
$ |
5,806 |
|
|
|
6,324 |
|
|
|
6,344 |
|
|
Quanterix Corporation (11) |
|
|
Medical Devices & Equipment |
|
Senior Secured |
|
March 2020 |
|
Interest rate PRIME + 2.75% or Floor rate of 8.00%, 0.58% Exit Fee |
|
$ |
7,688 |
|
|
|
7,656 |
|
|
|
7,577 |
|
|
Rapid Micro Biosystems, Inc. (11)(15) |
|
|
Medical Devices & Equipment |
|
Senior Secured |
|
April 2022 |
|
Interest rate PRIME + 5.15% or Floor rate of 9.65%, 7.25% Exit Fee |
|
$ |
18,000 |
|
|
|
18,143 |
|
|
|
18,013 |
|
|
Sebacia, Inc. (11)(15) |
|
|
Medical Devices & Equipment |
|
Senior Secured |
|
January 2021 |
|
Interest rate PRIME + 4.35% or Floor rate of 8.85%, 6.05% Exit Fee |
|
$ |
11,000 |
|
|
|
11,151 |
|
|
|
11,071 |
|
|
Transenterix, Inc. (10)(11) |
|
|
Medical Devices & Equipment |
|
Senior Secured |
|
June 2022 |
|
Interest rate PRIME + 4.55% or Floor rate of 9.55%, 6.95% Exit Fee |
|
$ |
30,000 |
|
|
|
29,972 |
|
|
|
29,852 |
|
|
Subtotal: 1-5 Years Maturity |
|
|
|
|
|
|
105,423 |
|
|
|
104,947 |
|
|||||||||
|
Subtotal: Medical Devices & Equipment (11.24%)* |
|
|
|
|
|
|
108,147 |
|
|
|
107,352 |
|
|||||||||
|
Software |
|
|
|
|
|
|
|
|
|
|
|
|
|
|
|
|
|
|
|
|
|
|
Under 1 Year Maturity |
|
|
|
|
|
|
|
|
|
|
|
|
|
|
|
|
|
|
|
|
|
|
Pollen, Inc. (15) |
|
|
Software |
|
Senior Secured |
|
April 2019 |
|
Interest rate PRIME + 4.25% or Floor rate of 8.50%, 4.00% Exit Fee |
|
$ |
7,000 |
|
|
|
7,214 |
|
|
|
7,214 |
|
|
Subtotal: Under 1 Year Maturity |
|
|
|
|
|
|
7,214 |
|
|
|
7,214 |
|
|||||||||
See notes to consolidated financial statements.
108
CONSOLIDATED SCHEDULE OF INVESTMENTS
December 31, 2018
(dollars in thousands)
|
Portfolio Company |
|
|
Sub-Industry |
|
Type of Investment(1) |
|
Maturity Date |
|
Interest Rate and Floor(2) |
|
Principal Amount |
|
|
Cost(3) |
|
|
Value(4) |
|
|||
|
1-5 Years Maturity |
|
|
|
|
|
|
|
|
|
|
|
|
|
|
|
|
|
|
|
|
|
|
Abrigo (p.k.a. Banker's Toolbox, Inc.) (13)(18) |
|
|
Software |
|
Senior Secured |
|
March 2023 |
|
Interest rate 3-month LIBOR + 7.88% or Floor rate of 7.88% |
|
$ |
39,701 |
|
|
$ |
38,871 |
|
|
$ |
38,617 |
|
|
Businessolver.com, Inc. (16)(17) |
|
|
Software |
|
Senior Secured |
|
May 2023 |
|
Interest rate 3-month LIBOR + 7.50% or Floor rate of 7.50% |
|
$ |
52,913 |
|
|
|
51,958 |
|
|
|
51,417 |
|
|
|
|
|
Software |
|
Senior Secured |
|
May 2023 |
|
Interest rate 3-month LIBOR + 7.50% or Floor rate of 7.50% |
|
$ |
2,550 |
|
|
|
2,551 |
|
|
|
2,550 |
|
|
Total Businessolver.com, Inc. |
|
$ |
55,463 |
|
|
|
54,509 |
|
|
|
53,967 |
|
|||||||||
|
Clarabridge, Inc. (12)(14)(17) |
|
|
Software |
|
Senior Secured |
|
April 2022 |
|
Interest rate PRIME + 4.80% or Floor rate of 8.55%, PIK Interest 2.25% |
|
$ |
42,300 |
|
|
|
41,843 |
|
|
|
41,921 |
|
|
Cloudian, Inc. |
|
|
Software |
|
Senior Secured |
|
November 2022 |
|
Interest rate PRIME + 3.25% or Floor rate of 8.25%, 9.75% Exit Fee |
|
$ |
15,000 |
|
|
|
14,814 |
|
|
|
14,814 |
|
|
Couchbase, Inc. (15)(17)(19) |
|
|
Software |
|
Senior Secured |
|
September 2021 |
|
Interest rate PRIME + 5.25% or Floor rate of 10.75% |
|
$ |
15,000 |
|
|
|
14,921 |
|
|
|
14,921 |
|
|
Credible Behavioral Health, Inc. (14)(17) |
|
|
Software |
|
Senior Secured |
|
September 2021 |
|
Interest rate PRIME + 3.20% or Floor rate of 7.95%, PIK Interest 3.30% |
|
$ |
7,573 |
|
|
|
7,493 |
|
|
|
7,493 |
|
|
Dashlane, Inc. (14)(19) |
|
|
Software |
|
Senior Secured |
|
April 2022 |
|
Interest rate PRIME + 4.05% or Floor rate of 8.55%, PIK Interest 1.10%, 9.25% Exit Fee |
|
$ |
10,067 |
|
|
|
10,107 |
|
|
|
10,137 |
|
|
DocuTAP, Inc. (17) |
|
|
Software |
|
Senior Secured |
|
October 2023 |
|
Interest rate 3-month LIBOR + 8.00% or Floor rate of 8.00% |
|
$ |
14,000 |
|
|
|
13,609 |
|
|
|
13,609 |
|
|
Emma, Inc. (17)(18) |
|
|
Software |
|
Senior Secured |
|
September 2022 |
|
Interest rate 3-month LIBOR + 8.39% or Floor rate of 8.39% |
|
$ |
37,037 |
|
|
|
35,858 |
|
|
|
35,251 |
|
|
|
|
|
Software |
|
Senior Secured |
|
September 2022 |
|
Interest rate 3-month LIBOR + 8.18% or Floor rate of 8.18% |
|
$ |
6,000 |
|
|
|
5,827 |
|
|
|
5,826 |
|
|
Total Emma, Inc. |
|
$ |
43,037 |
|
|
|
41,685 |
|
|
|
41,077 |
|
|||||||||
|
Evernote Corporation (14)(15)(17)(19) |
|
|
Software |
|
Senior Secured |
|
October 2020 |
|
Interest rate PRIME + 5.45% or Floor rate of 8.95% |
|
$ |
5,549 |
|
|
|
5,537 |
|
|
|
5,592 |
|
|
|
|
|
Software |
|
Senior Secured |
|
July 2021 |
|
Interest rate PRIME + 6.00% or Floor rate of 9.50%, PIK Interest 1.25% |
|
$ |
4,074 |
|
|
|
4,058 |
|
|
|
4,074 |
|
|
|
|
|
Software |
|
Senior Secured |
|
July 2022 |
|
Interest rate PRIME + 6.00% or Floor rate of 9.50%, PIK Interest 1.25% |
|
$ |
5,015 |
|
|
|
4,982 |
|
|
|
4,993 |
|
|
Total Evernote Corporation |
|
$ |
14,638 |
|
|
|
14,577 |
|
|
|
14,659 |
|
|||||||||
|
Fuze, Inc. (13)(14)(15)(16)(19) |
|
|
Software |
|
Senior Secured |
|
July 2021 |
|
Interest rate PRIME + 3.70% or Floor rate of 7.95%, PIK Interest 1.55%, 3.55% Exit Fee |
|
$ |
51,129 |
|
|
|
51,284 |
|
|
|
51,943 |
|
|
Impact Radius Holdings, Inc. (11)(14) |
|
|
Software |
|
Senior Secured |
|
December 2020 |
|
Interest rate PRIME + 4.25% or Floor rate of 8.75%, PIK Interest 1.55%, 1.75% Exit Fee |
|
$ |
10,191 |
|
|
|
10,271 |
|
|
|
10,237 |
|
|
|
|
|
Software |
|
Senior Secured |
|
December 2020 |
|
Interest rate PRIME + 4.25% or Floor rate of 8.75%, PIK Interest 1.55% |
|
$ |
2,014 |
|
|
|
2,014 |
|
|
|
2,008 |
|
|
Total Impact Radius Holdings, Inc. |
|
$ |
12,205 |
|
|
|
12,285 |
|
|
|
12,245 |
|
|||||||||
|
Insurance Technologies Corporation (17)(18) |
|
|
Software |
|
Senior Secured |
|
March 2023 |
|
Interest rate 3-month LIBOR + 7.82% or Floor rate of 8.75% |
|
$ |
12,500 |
|
|
|
12,258 |
|
|
|
12,071 |
|
|
Lightbend, Inc. (14)(15) |
|
|
Software |
|
Senior Secured |
|
February 2022 |
|
Interest rate PRIME + 4.25% or Floor rate of 8.50%, PIK Interest 2.00% |
|
$ |
16,179 |
|
|
|
15,850 |
|
|
|
15,741 |
|
|
Lithium Technologies, Inc. (11)(16)(17) |
|
|
Software |
|
Senior Secured |
|
October 2022 |
|
Interest rate 1-month LIBOR + 8.00% or Floor rate of 9.00% |
|
$ |
12,000 |
|
|
|
11,785 |
|
|
|
11,659 |
|
|
|
|
|
Software |
|
Senior Secured |
|
October 2022 |
|
Interest rate 1-month LIBOR + 8.00% or Floor rate of 9.00% |
|
$ |
43,000 |
|
|
|
42,047 |
|
|
|
42,047 |
|
|
Total Lithium Technologies, Inc. |
|
$ |
55,000 |
|
|
|
53,832 |
|
|
|
53,706 |
|
|||||||||
|
Microsystems Holding Company, LLC (13)(19) |
|
|
Software |
|
Senior Secured |
|
July 2022 |
|
Interest rate 3-month LIBOR + 8.25% or Floor rate of 9.25% |
|
$ |
12,000 |
|
|
|
11,854 |
|
|
|
11,842 |
|
|
Quid, Inc. (14)(15) |
|
|
Software |
|
Senior Secured |
|
February 2021 |
|
Interest rate PRIME + 4.75% or Floor rate of 8.25%, PIK Interest 2.25%, 3.00% Exit Fee |
|
$ |
8,494 |
|
|
|
8,632 |
|
|
|
8,619 |
|
See notes to consolidated financial statements.
109
CONSOLIDATED SCHEDULE OF INVESTMENTS
December 31, 2018
(dollars in thousands)
|
Portfolio Company |
|
|
Sub-Industry |
|
Type of Investment(1) |
|
Maturity Date |
|
Interest Rate and Floor(2) |
|
Principal Amount |
|
|
Cost(3) |
|
|
Value(4) |
|
|||
|
RapidMiner, Inc. (12)(14) |
|
|
Software |
|
Senior Secured |
|
December 2020 |
|
Interest rate PRIME + 5.50% or Floor rate of 9.75%, PIK Interest 1.65% |
|
$ |
7,119 |
|
|
$ |
7,018 |
|
|
$ |
6,965 |
|
|
Regent Education (14) |
|
|
Software |
|
Senior Secured |
|
January 2021 |
|
Interest rate FIXED 10.00%, PIK Interest 2.00%, 6.35% Exit Fee |
|
$ |
3,092 |
|
|
|
3,115 |
|
|
|
1,579 |
|
|
Salsa Labs, Inc. (11)(17) |
|
|
Software |
|
Senior Secured |
|
April 2023 |
|
Interest rate 3-month LIBOR + 8.15% or Floor rate of 9.15% |
|
$ |
6,000 |
|
|
|
5,894 |
|
|
|
5,823 |
|
|
Signpost, Inc. (11)(14) |
|
|
Software |
|
Senior Secured |
|
February 2020 |
|
Interest rate PRIME + 4.15% or Floor rate of 8.15%, PIK Interest 1.75%, 5.75% Exit Fee |
|
$ |
15,787 |
|
|
|
16,293 |
|
|
|
16,267 |
|
|
ThreatConnect, Inc. (14)(15)(19) |
|
|
Software |
|
Senior Secured |
|
October 2022 |
|
Interest rate PRIME + 4.95% or Floor rate of 9.95%, PIK Interest 1.05%, 2.20% Exit Fee |
|
$ |
7,519 |
|
|
|
7,443 |
|
|
|
7,443 |
|
|
Vela Trading Technologies (11)(18) |
|
|
Software |
|
Senior Secured |
|
July 2022 |
|
Interest rate 3-month LIBOR + 9.50% or Floor rate of 10.50% |
|
$ |
19,750 |
|
|
|
19,345 |
|
|
|
19,309 |
|
|
YouEarnedIt, Inc. (18) |
|
|
Software |
|
Senior Secured |
|
July 2023 |
|
Interest rate 1-month LIBOR + 8.66% |
|
$ |
8,978 |
|
|
|
8,735 |
|
|
|
8,735 |
|
|
ZocDoc (11)(19) |
|
|
Software |
|
Senior Secured |
|
August 2021 |
|
Interest rate PRIME + 6.20% or Floor rate of 10.95%, 2.00% Exit Fee |
|
$ |
30,000 |
|
|
|
30,003 |
|
|
|
29,875 |
|
|
Subtotal: 1-5 Years Maturity |
|
|
|
|
|
|
516,270 |
|
|
|
513,378 |
|
|||||||||
|
Subtotal: Software (54.49%)* |
|
|
|
|
|
|
523,484 |
|
|
|
520,592 |
|
|||||||||
|
Sustainable and Renewable Technology |
|
|
|
|
|
|
|
|
|
|
|
|
|||||||||
|
Under 1 Year Maturity |
|
|
|
|
|
|
|
|
|
|
|
|
|||||||||
|
Solar Spectrum Holdings LLC (p.k.a. Sungevity, Inc.) (6)(14)(19) |
|
|
Sustainable and Renewable Technology |
|
Senior Secured |
|
August 2019 |
|
Interest rate PRIME + 8.70% or Floor rate of 12.95%, 5.00% Exit Fee |
|
$ |
10,000 |
|
|
|
10,151 |
|
|
|
10,151 |
|
|
|
|
|
Sustainable and Renewable Technology |
|
Senior Secured |
|
February 2019 |
|
PIK Interest 10.00% |
|
$ |
649 |
|
|
|
650 |
|
|
|
650 |
|
|
|
|
|
Sustainable and Renewable Technology |
|
Senior Secured |
|
February 2019 |
|
Interest rate PRIME + 10.70% or Floor rate of 15.70%, PIK Interest 2.00% |
|
$ |
603 |
|
|
|
603 |
|
|
|
603 |
|
|
Total Solar Spectrum LLC |
|
|
|
|
|
|
|
|
|
|
$ |
11,252 |
|
|
|
11,404 |
|
|
|
11,404 |
|
|
Subtotal: Under 1 Year Maturity |
|
|
|
|
|
|
11,404 |
|
|
|
11,404 |
|
|||||||||
|
1-5 Years Maturity |
|
|
|
|
|
|
|
|
|
|
|
|
|||||||||
|
FuelCell Energy, Inc. (12) |
|
|
Sustainable and Renewable Technology |
|
Senior Secured |
|
April 2020 |
|
Interest rate PRIME + 5.40% or Floor rate of 9.90%, 6.68% Exit Fee |
|
$ |
13,091 |
|
|
|
13,362 |
|
|
|
13,330 |
|
|
|
|
|
Sustainable and Renewable Technology |
|
Senior Secured |
|
April 2020 |
|
Interest rate PRIME + 5.40% or Floor rate of 9.90%, 8.50% Exit Fee |
|
$ |
11,909 |
|
|
|
11,908 |
|
|
|
11,874 |
|
|
Total FuelCell Energy, Inc. |
|
$ |
25,000 |
|
|
$ |
25,270 |
|
|
$ |
25,204 |
|
|||||||||
|
Impossible Foods, Inc. (12)(17) |
|
|
Sustainable and Renewable Technology |
|
Senior Secured |
|
January 2022 |
|
Interest rate PRIME + 3.95% or Floor rate of 8.95%, 9.00% Exit Fee |
|
$ |
30,000 |
|
|
|
29,981 |
|
|
|
29,680 |
|
|
Metalysis Limited (5)(10)(11) |
|
|
Sustainable and Renewable Technology |
|
Senior Secured |
|
March 2021 |
|
Interest rate PRIME + 5.00% or Floor rate of 9.25%, 6.95% Exit Fee |
|
$ |
7,254 |
|
|
|
7,400 |
|
|
|
7,360 |
|
|
Proterra, Inc. (11)(14) |
|
|
Sustainable and Renewable Technology |
|
Senior Secured |
|
November 2020 |
|
Interest rate PRIME + 3.70% or Floor rate of 7.95%, PIK Interest 1.75%, 5.95% Exit Fee |
|
$ |
25,484 |
|
|
|
26,775 |
|
|
|
26,888 |
|
|
|
|
|
Sustainable and Renewable Technology |
|
Senior Secured |
|
November 2020 |
|
Interest rate PRIME + 3.70% or Floor rate of 7.95%, PIK Interest 1.75%, 7.00% Exit Fee |
|
$ |
5,097 |
|
|
|
5,381 |
|
|
|
5,386 |
|
|
Total Proterra, Inc. |
|
|
|
|
|
|
|
|
|
|
$ |
30,581 |
|
|
|
32,156 |
|
|
|
32,274 |
|
|
Subtotal: 1-5 Years Maturity |
|
|
|
|
|
|
94,807 |
|
|
|
94,518 |
|
|||||||||
|
Subtotal: Sustainable and Renewable Technology (11.09%)* |
|
|
|
|
|
|
106,211 |
|
|
|
105,922 |
|
|||||||||
|
Total: Debt Investments (181.43%)* |
|
|
|
|
|
|
1,752,945 |
|
|
|
1,733,492 |
|
|||||||||
See notes to consolidated financial statements.
110
CONSOLIDATED SCHEDULE OF INVESTMENTS
December 31, 2018
(dollars in thousands)
|
Portfolio Company |
|
|
Sub-Industry |
|
Type of Investment(1) |
|
Series |
|
Shares |
|
|
Cost(3) |
|
|
Value(4) |
|
||||||||||||
|
Equity Investments |
|
|
|
|
|
|
|
|
|
|
|
|
|
|
|
|
||||||||||||
|
Communications & Networking |
|
|
|
|
|
|
|
|
|
|
|
|
|
|
|
|
||||||||||||
|
GlowPoint, Inc. (4) |
|
|
Communications & Networking |
|
Equity |
|
Common Stock |
|
|
114,192 |
|
|
$ |
102 |
|
|
$ |
14 |
|
|||||||||
|
Peerless Network Holdings, Inc. |
|
|
Communications & Networking |
|
Equity |
|
Preferred Series A |
|
|
1,135,000 |
|
|
|
1,229 |
|
|
|
4,847 |
|
|||||||||
|
Subtotal: Communications & Networking (0.51%)* |
|
|
|
1,331 |
|
|
|
4,861 |
|
|||||||||||||||||||
|
Diagnostic |
|
|
|
|
|
|
|
|
|
|
|
|
|
|
|
|
||||||||||||
|
Singulex, Inc. |
|
|
Diagnostic |
|
Equity |
|
Common Stock |
|
|
937,998 |
|
|
|
750 |
|
|
|
348 |
|
|||||||||
|
Subtotal: Diagnostic (0.04%)* |
|
|
|
|
|
|
|
|
|
|
750 |
|
|
|
348 |
|
||||||||||||
|
Diversified Financial Services |
|
|
|
|
|
|
|
|
|
|
|
|
|
|
|
|
||||||||||||
|
Gibraltar Business Capital, LLC. (7) |
|
|
Diversified Financial Services |
|
Equity |
|
Common Stock |
|
|
830,000 |
|
|
|
1,884 |
|
|
|
1,688 |
|
|||||||||
|
|
|
|
Diversified Financial Services |
|
Equity |
|
Preferred Series A |
|
|
10,602,752 |
|
|
|
26,122 |
|
|
|
23,402 |
|
|||||||||
|
Total Gibraltar Business Capital, LLC |
|
|
|
|
|
|
11,432,752 |
|
|
|
28,006 |
|
|
|
25,090 |
|
||||||||||||
|
Subtotal: Diversified Financial Services (2.63%)* |
|
|
|
|
|
|
|
|
|
|
28,006 |
|
|
|
25,090 |
|
||||||||||||
|
Drug Delivery |
|
|
|
|
|
|
|
|
|
|
|
|
|
|
|
|
||||||||||||
|
AcelRx Pharmaceuticals, Inc. (4) |
|
|
Drug Delivery |
|
Equity |
|
Common Stock |
|
|
176,730 |
|
|
|
1,329 |
|
|
|
318 |
|
|||||||||
|
BioQ Pharma Incorporated (15) |
|
|
Drug Delivery |
|
Equity |
|
Preferred Series D |
|
|
165,000 |
|
|
|
500 |
|
|
|
599 |
|
|||||||||
|
Edge Therapeutics, Inc. (4) |
|
|
Drug Delivery |
|
Equity |
|
Common Stock |
|
|
49,965 |
|
|
|
309 |
|
|
|
16 |
|
|||||||||
|
Neos Therapeutics, Inc. (4)(15) |
|
|
Drug Delivery |
|
Equity |
|
Common Stock |
|
|
125,000 |
|
|
|
1,500 |
|
|
|
206 |
|
|||||||||
|
Subtotal: Drug Delivery (0.12%)* |
|
|
|
|
|
|
|
|
|
|
3,638 |
|
|
|
1,139 |
|
||||||||||||
|
Drug Discovery & Development |
|
|
|
|
|
|
|
|
|
|
|
|
|
|
|
|
||||||||||||
|
Aveo Pharmaceuticals, Inc. (4)(15) |
|
|
Drug Discovery & Development |
|
Equity |
|
Common Stock |
|
|
1,901,791 |
|
|
|
1,715 |
|
|
|
3,112 |
|
|||||||||
|
Axovant Sciences Ltd. (4)(5)(10)(16) |
|
|
Drug Discovery & Development |
|
Equity |
|
Common Stock |
|
|
129,827 |
|
|
|
1,269 |
|
|
|
129 |
|
|||||||||
|
BridgeBio Pharma LLC (16) |
|
|
Drug Discovery & Development |
|
Equity |
|
Preferred Series D |
|
|
1,008,929 |
|
|
|
2,000 |
|
|
|
1,819 |
|
|||||||||
|
Cerecor, Inc. (4) |
|
|
Drug Discovery & Development |
|
Equity |
|
Common Stock |
|
|
119,087 |
|
|
|
1,000 |
|
|
|
385 |
|
|||||||||
|
Dare Biosciences, Inc. (p.k.a. Cerulean Pharma, Inc.) (4) |
|
|
Drug Discovery & Development |
|
Equity |
|
Common Stock |
|
|
13,550 |
|
|
|
1,000 |
|
|
|
10 |
|
|||||||||
|
Dicerna Pharmaceuticals, Inc. (4) |
|
|
Drug Discovery & Development |
|
Equity |
|
Common Stock |
|
|
142,858 |
|
|
|
1,000 |
|
|
|
1,527 |
|
|||||||||
|
Dynavax Technologies (4)(10) |
|
|
Drug Discovery & Development |
|
Equity |
|
Common Stock |
|
|
20,000 |
|
|
|
550 |
|
|
|
183 |
|
|||||||||
|
Eidos Therapeutics, Inc. (4)(10) |
|
|
Drug Discovery & Development |
|
Equity |
|
Common Stock |
|
|
15,000 |
|
|
|
255 |
|
|
|
206 |
|
|||||||||
|
Genocea Biosciences, Inc. (4) |
|
|
Drug Discovery & Development |
|
Equity |
|
Common Stock |
|
|
223,463 |
|
|
|
2,000 |
|
|
|
64 |
|
|||||||||
|
Insmed, Incorporated (4) |
|
|
Drug Discovery & Development |
|
Equity |
|
Common Stock |
|
|
70,771 |
|
|
|
1,000 |
|
|
|
929 |
|
|||||||||
|
Melinta Therapeutics (4) |
|
|
Drug Discovery & Development |
|
Equity |
|
Common Stock |
|
|
51,821 |
|
|
|
2,000 |
|
|
|
42 |
|
|||||||||
|
Paratek Pharmaceuticals, Inc. (p.k.a. Transcept Pharmaceuticals, Inc.) (4)(10)(16) |
|
|
Drug Discovery & Development |
|
Equity |
|
Common Stock |
|
|
76,362 |
|
|
|
2,744 |
|
|
|
392 |
|
|||||||||
|
Rocket Pharmaceuticals, Ltd (p.k.a. Inotek Pharmaceuticals Corporation) (4) |
|
|
Drug Discovery & Development |
|
Equity |
|
Common Stock |
|
|
944 |
|
|
|
1,500 |
|
|
|
14 |
|
|||||||||
|
Tricida, Inc. (4) |
|
|
Drug Discovery & Development |
|
Equity |
|
Common Stock |
|
|
105,260 |
|
|
|
2,000 |
|
|
|
2,481 |
|
|||||||||
|
Subtotal: Drug Discovery & Development (1.18%)* |
|
|
|
|
|
|
|
|
|
|
20,033 |
|
|
|
11,293 |
|
||||||||||||
|
Electronics & Computer Hardware |
|
|
|
|
|
|
|
|
|
|
|
|
|
|
|
|
||||||||||||
|
Identiv, Inc. (4) |
|
|
Electronics & Computer Hardware |
|
Equity |
|
Common Stock |
|
|
6,700 |
|
|
|
34 |
|
|
|
24 |
|
|||||||||
|
Subtotal: Electronics & Computer Hardware (0.00%)* |
|
|
|
|
|
|
|
|
|
|
34 |
|
|
|
24 |
|
||||||||||||
|
Information Services |
|
|
|
|
|
|
|
|
|
|
|
|
|
|
|
|
||||||||||||
|
DocuSign, Inc. (4) |
|
|
Information Services |
|
Equity |
|
Common Stock |
|
|
385,000 |
|
|
|
6,081 |
|
|
|
15,431 |
|
|||||||||
|
Subtotal: Information Services (1.62%)* |
|
|
|
|
|
|
|
|
|
|
6,081 |
|
|
|
15,431 |
|
||||||||||||
See notes to consolidated financial statements.
111
CONSOLIDATED SCHEDULE OF INVESTMENTS
December 31, 2018
(dollars in thousands)
|
Portfolio Company |
|
|
Sub-Industry |
|
Type of Investment(1) |
|
Series |
|
Shares |
|
|
Cost(3) |
|
|
Value(4) |
|
|||||
|
Internet Consumer & Business Services |
|
|
|
|
|
|
|
|
|
|
|
|
|
|
|
|
|||||
|
Blurb, Inc. |
|
|
Internet Consumer & Business Services |
|
Equity |
|
Preferred Series B |
|
|
220,653 |
|
|
$ |
175 |
|
|
$ |
44 |
|
||
|
Brigade Group, Inc. (p.k.a. Philotic, Inc.) |
|
|
Internet Consumer & Business Services |
|
Equity |
|
Common Stock |
|
|
9,023 |
|
|
|
93 |
|
|
|
— |
|
||
|
Contentful, Inc. (5)(10) |
|
|
Internet Consumer & Business Services |
|
Equity |
|
Preferred Series D |
|
|
217 |
|
|
|
500 |
|
|
|
504 |
|
||
|
DoorDash, Inc. |
|
|
Internet Consumer & Business Services |
|
Equity |
|
Common Stock |
|
|
105,000 |
|
|
|
6,051 |
|
|
|
6,051 |
|
||
|
Lightspeed POS, Inc. (5)(10) |
|
|
Internet Consumer & Business Services |
|
Equity |
|
Preferred Series C |
|
|
230,030 |
|
|
|
250 |
|
|
|
363 |
|
||
|
|
|
|
Internet Consumer & Business Services |
|
Equity |
|
Preferred Series D |
|
|
198,677 |
|
|
|
250 |
|
|
|
326 |
|
||
|
Total Lightspeed POS, Inc. |
|
|
|
|
|
|
428,707 |
|
|
|
500 |
|
|
|
689 |
|
|||||
|
Lyft, Inc. |
|
|
Internet Consumer & Business Services |
|
Equity |
|
Preferred Series F |
|
|
91,648 |
|
|
|
4,819 |
|
|
|
4,819 |
|
||
|
Nextdoor.com, Inc. |
|
|
Internet Consumer & Business Services |
|
Equity |
|
Common Stock |
|
|
328,190 |
|
|
|
4,854 |
|
|
|
4,854 |
|
||
|
OfferUp, Inc. |
|
|
Internet Consumer & Business Services |
|
Equity |
|
Preferred Series A |
|
|
286,080 |
|
|
|
1,663 |
|
|
|
1,565 |
|
||
|
|
|
|
Internet Consumer & Business Services |
|
Equity |
|
Preferred Series A-1 |
|
|
108,710 |
|
|
|
632 |
|
|
|
595 |
|
||
|
Total OfferUp, Inc. |
|
|
|
|
|
|
394,790 |
|
|
|
2,295 |
|
|
|
2,160 |
|
|||||
|
Oportun (p.k.a. Progress Financial) |
|
|
Internet Consumer & Business Services |
|
Equity |
|
Preferred Series G |
|
|
218,351 |
|
|
|
250 |
|
|
|
537 |
|
||
|
|
|
|
Internet Consumer & Business Services |
|
Equity |
|
Preferred Series H |
|
|
87,802 |
|
|
|
250 |
|
|
|
279 |
|
||
|
Total Oportun (p.k.a. Progress Financial) |
|
|
|
|
|
|
306,153 |
|
|
|
500 |
|
|
|
816 |
|
|||||
|
Tectura Corporation (7) |
|
|
Internet Consumer & Business Services |
|
Equity |
|
Common Stock |
|
|
414,994,863 |
|
|
|
900 |
|
|
|
— |
|
||
|
|
|
|
Internet Consumer & Business Services |
|
Equity |
|
Preferred Series BB |
|
|
1,000,000 |
|
|
|
— |
|
|
|
— |
|
||
|
Total Tectura Corporation |
|
|
|
|
|
|
415,994,863 |
|
|
|
900 |
|
|
|
— |
|
|||||
|
Subtotal: Internet Consumer & Business Services (2.09%)* |
|
|
|
|
|
|
|
|
|
|
20,687 |
|
|
|
19,937 |
|
|||||
|
Media/Content/Info |
|
|
|
|
|
|
|
|
|
|
|
|
|
|
|
|
|||||
|
Pinterest, Inc. |
|
|
Media/Content/Info |
|
Equity |
|
Preferred Series Seed |
|
|
620,000 |
|
|
|
4,085 |
|
|
|
3,787 |
|
||
|
Subtotal: Media/Content/Info (0.40%)* |
|
|
|
|
|
|
|
|
|
|
4,085 |
|
|
|
3,787 |
|
|||||
|
Medical Devices & Equipment |
|
|
|
|
|
|
|
|
|
|
|
|
|
|
|
|
|||||
|
AtriCure, Inc. (4)(15) |
|
|
Medical Devices & Equipment |
|
Equity |
|
Common Stock |
|
|
10,119 |
|
|
|
266 |
|
|
|
310 |
|
||
|
Flowonix Medical Incorporated |
|
|
Medical Devices & Equipment |
|
Equity |
|
Preferred Series AA |
|
|
221,893 |
|
|
|
1,500 |
|
|
|
27 |
|
||
|
Gelesis, Inc. |
|
|
Medical Devices & Equipment |
|
Equity |
|
Common Stock |
|
|
198,202 |
|
|
|
— |
|
|
|
677 |
|
||
|
|
|
|
Medical Devices & Equipment |
|
Equity |
|
Preferred Series A-1 |
|
|
191,210 |
|
|
|
425 |
|
|
|
729 |
|
||
|
|
|
|
Medical Devices & Equipment |
|
Equity |
|
Preferred Series A-2 |
|
|
191,626 |
|
|
|
500 |
|
|
|
691 |
|
||
|
Total Gelesis, Inc. |
|
|
|
|
|
|
581,038 |
|
|
|
925 |
|
|
|
2,097 |
|
|||||
|
Medrobotics Corporation (15) |
|
|
Medical Devices & Equipment |
|
Equity |
|
Preferred Series E |
|
|
136,798 |
|
|
|
250 |
|
|
|
24 |
|
||
|
|
|
|
Medical Devices & Equipment |
|
Equity |
|
Preferred Series F |
|
|
73,971 |
|
|
|
155 |
|
|
|
26 |
|
||
|
|
|
|
Medical Devices & Equipment |
|
Equity |
|
Preferred Series G |
|
|
163,934 |
|
|
|
500 |
|
|
|
87 |
|
||
|
Total Medrobotics Corporation |
|
|
|
|
|
|
374,703 |
|
|
|
905 |
|
|
|
137 |
|
|||||
|
Optiscan Biomedical, Corp. (6) |
|
|
Medical Devices & Equipment |
|
Equity |
|
Preferred Series B |
|
|
61,855 |
|
|
|
3,000 |
|
|
|
393 |
|
||
|
|
|
|
Medical Devices & Equipment |
|
Equity |
|
Preferred Series C |
|
|
19,273 |
|
|
|
655 |
|
|
|
111 |
|
||
|
|
|
|
Medical Devices & Equipment |
|
Equity |
|
Preferred Series D |
|
|
551,038 |
|
|
|
5,257 |
|
|
|
3,524 |
|
||
|
|
|
|
Medical Devices & Equipment |
|
Equity |
|
Preferred Series E |
|
|
311,989 |
|
|
|
2,609 |
|
|
|
2,771 |
|
||
|
Total Optiscan Biomedical, Corp. |
|
|
|
|
|
|
944,155 |
|
|
|
11,521 |
|
|
|
6,799 |
|
|||||
|
Outset Medical, Inc. (p.k.a. Home Dialysis Plus, Inc.) |
|
|
Medical Devices & Equipment |
|
Equity |
|
Preferred Series B |
|
|
232,061 |
|
|
|
527 |
|
|
|
473 |
|
||
|
Quanterix Corporation (4) |
|
|
Medical Devices & Equipment |
|
Equity |
|
Common Stock |
|
|
84,778 |
|
|
|
1,000 |
|
|
|
1,553 |
|
||
|
Subtotal: Medical Devices & Equipment (1.19%)* |
|
|
|
|
|
|
|
|
|
|
16,644 |
|
|
|
11,396 |
|
|||||
|
Software |
|
|
|
|
|
|
|
|
|
|
|
|
|
|
|
|
|||||
|
CapLinked, Inc. |
|
|
Software |
|
Equity |
|
Preferred Series A-3 |
|
|
53,614 |
|
|
|
51 |
|
|
|
87 |
|
||
|
Docker, Inc. |
|
|
Software |
|
Equity |
|
Common Stock |
|
|
200,000 |
|
|
|
4,284 |
|
|
|
4,284 |
|
||
|
Druva, Inc. |
|
|
Software |
|
Equity |
|
Preferred Series 2 |
|
|
458,841 |
|
|
|
1,000 |
|
|
|
1,972 |
|
||
|
|
|
|
Software |
|
Equity |
|
Preferred Series 3 |
|
|
93,620 |
|
|
|
300 |
|
|
|
433 |
|
||
|
Total Druva, Inc. |
|
|
|
|
|
|
552,461 |
|
|
|
1,300 |
|
|
|
2,405 |
|
|||||
|
HighRoads, Inc. |
|
|
Software |
|
Equity |
|
Common Stock |
|
|
190 |
|
|
|
307 |
|
|
|
— |
|
||
|
Palantir Technologies |
|
|
Software |
|
Equity |
|
Preferred Series D |
|
|
9,535 |
|
|
|
47 |
|
|
|
47 |
|
||
|
|
|
|
Software |
|
Equity |
|
Preferred Series E |
|
|
1,749,089 |
|
|
|
10,489 |
|
|
|
8,662 |
|
||
|
|
|
|
Software |
|
Equity |
|
Preferred Series G |
|
|
326,797 |
|
|
|
2,211 |
|
|
|
1,618 |
|
||
|
Total Palantir Technologies |
|
|
|
|
|
|
2,085,421 |
|
|
|
12,747 |
|
|
|
10,327 |
|
|||||
|
Sprinklr, Inc. |
|
|
Software |
|
Equity |
|
Common Stock |
|
|
700,000 |
|
|
|
3,749 |
|
|
|
3,226 |
|
||
|
WildTangent, Inc. |
|
|
Software |
|
Equity |
|
Preferred Series 3 |
|
|
100,000 |
|
|
|
402 |
|
|
|
176 |
|
||
|
Subtotal: Software (2.15%)* |
|
|
|
|
|
|
|
|
|
|
22,840 |
|
|
|
20,505 |
|
|||||
See notes to consolidated financial statements.
112
CONSOLIDATED SCHEDULE OF INVESTMENTS
December 31, 2018
(dollars in thousands)
|
Portfolio Company |
|
|
Sub-Industry |
|
Type of Investment(1) |
|
Series |
|
Shares |
|
|
Cost(3) |
|
|
Value(4) |
|
|||
|
Surgical Devices |
|
|
|
|
|
|
|
|
|
|
|
|
|
|
|
|
|||
|
Gynesonics, Inc. (15) |
|
|
Surgical Devices |
|
Equity |
|
Preferred Series B |
|
|
219,298 |
|
|
$ |
250 |
|
|
$ |
8 |
|
|
|
|
|
Surgical Devices |
|
Equity |
|
Preferred Series C |
|
|
656,538 |
|
|
|
282 |
|
|
|
25 |
|
|
|
|
|
Surgical Devices |
|
Equity |
|
Preferred Series D |
|
|
1,991,157 |
|
|
|
712 |
|
|
|
79 |
|
|
|
|
|
Surgical Devices |
|
Equity |
|
Preferred Series E |
|
|
2,786,367 |
|
|
|
429 |
|
|
|
125 |
|
|
|
|
|
Surgical Devices |
|
Equity |
|
Preferred Series F |
|
|
1,523,693 |
|
|
|
118 |
|
|
|
117 |
|
|
|
|
|
Surgical Devices |
|
Equity |
|
Preferred Series F-1 |
|
|
2,418,125 |
|
|
|
150 |
|
|
|
167 |
|
|
Total Gynesonics, Inc. |
|
|
|
|
|
|
9,595,178 |
|
|
|
1,941 |
|
|
|
521 |
|
|||
|
Transmedics, Inc. |
|
|
Surgical Devices |
|
Equity |
|
Preferred Series B |
|
|
88,961 |
|
|
|
1,100 |
|
|
|
356 |
|
|
|
|
|
Surgical Devices |
|
Equity |
|
Preferred Series C |
|
|
119,999 |
|
|
|
300 |
|
|
|
479 |
|
|
|
|
|
Surgical Devices |
|
Equity |
|
Preferred Series D |
|
|
260,000 |
|
|
|
650 |
|
|
|
1,040 |
|
|
|
|
|
Surgical Devices |
|
Equity |
|
Preferred Series F |
|
|
100,200 |
|
|
|
500 |
|
|
|
401 |
|
|
Total Transmedics, Inc. |
|
|
|
|
|
|
569,160 |
|
|
|
2,550 |
|
|
|
2,276 |
|
|||
|
Subtotal: Surgical Devices (0.29%)* |
|
|
|
|
|
|
|
|
|
|
4,491 |
|
|
|
2,797 |
|
|||
|
Sustainable and Renewable Technology |
|
|
|
|
|
|
|
|
|
|
|
|
|
|
|
|
|||
|
Flywheel Building Intelligence, Inc. (p.k.a. SCIEnergy, Inc.) |
|
|
Sustainable and Renewable Technology |
|
Equity |
|
Common Stock |
|
|
192 |
|
|
|
761 |
|
|
|
— |
|
|
Modumetal, Inc. |
|
|
Sustainable and Renewable Technology |
|
Equity |
|
Preferred Series C |
|
|
3,107,520 |
|
|
|
500 |
|
|
|
40 |
|
|
Proterra, Inc. |
|
|
Sustainable and Renewable Technology |
|
Equity |
|
Preferred Series 5 |
|
|
99,280 |
|
|
|
500 |
|
|
|
449 |
|
|
Solar Spectrum Holdings LLC (p.k.a. Sungevity, Inc.) (6) |
|
|
Sustainable and Renewable Technology |
|
Equity |
|
Common Stock |
|
|
380 |
|
|
|
61,502 |
|
|
|
3,115 |
|
|
Subtotal: Sustainable and Renewable Technology (0.38%)* |
|
|
|
|
|
|
|
|
|
|
63,263 |
|
|
|
3,604 |
|
|||
|
Total: Equity Investments (12.58%)* |
|
|
|
|
|
|
|
|
|
$ |
191,883 |
|
|
$ |
120,212 |
|
|||
See notes to consolidated financial statements.
113
CONSOLIDATED SCHEDULE OF INVESTMENTS
December 31, 2018
(dollars in thousands)
|
Portfolio Company |
|
|
Sub-Industry |
|
Type of Investment(1) |
|
Series |
|
Shares |
|
|
Cost(3) |
|
|
Value(4) |
|
|||
|
Warrant Investments |
|
|
|
|
|
|
|
|
|
|
|
|
|
|
|
|
|||
|
Biotechnology Tools |
|
|
|
|
|
|
|
|
|
|
|
|
|
|
|
|
|||
|
Labcyte, Inc. |
|
|
Biotechnology Tools |
|
Warrant |
|
Preferred Series C |
|
|
1,127,624 |
|
|
$ |
323 |
|
|
$ |
1,114 |
|
|
Subtotal: Biotechnology Tools (0.12%)* |
|
|
|
|
|
|
|
|
|
|
323 |
|
|
|
1,114 |
|
|||
|
Communications & Networking |
|
|
|
|
|
|
|
|
|
|
|
|
|
|
|
|
|||
|
Peerless Network Holdings, Inc. |
|
|
Communications & Networking |
|
Warrant |
|
Common Stock |
|
|
3,328 |
|
|
|
— |
|
|
|
10 |
|
|
Spring Mobile Solutions, Inc. |
|
|
Communications & Networking |
|
Warrant |
|
Common Stock |
|
|
2,834,375 |
|
|
|
418 |
|
|
|
— |
|
|
Subtotal: Communications & Networking (0.00%)* |
|
|
|
|
|
|
|
|
|
|
418 |
|
|
|
10 |
|
|||
|
Consumer & Business Products |
|
|
|
|
|
|
|
|
|
|
|
|
|
|
|
|
|||
|
Gadget Guard (p.k.a Antenna79) (15) |
|
|
Consumer & Business Products |
|
Warrant |
|
Common Stock |
|
|
1,662,441 |
|
|
|
228 |
|
|
|
— |
|
|
Intelligent Beauty, Inc. |
|
|
Consumer & Business Products |
|
Warrant |
|
Preferred Series B |
|
|
190,234 |
|
|
|
230 |
|
|
|
191 |
|
|
The Neat Company |
|
|
Consumer & Business Products |
|
Warrant |
|
Preferred Series C-1 |
|
|
540,540 |
|
|
|
365 |
|
|
|
— |
|
|
WHOOP, INC. |
|
|
Consumer & Business Products |
|
Warrant |
|
Preferred Series C |
|
|
68,627 |
|
|
|
18 |
|
|
|
5 |
|
|
Subtotal: Consumer & Business Products (0.02%)* |
|
|
|
|
|
|
|
|
|
|
841 |
|
|
|
196 |
|
|||
|
Drug Delivery |
|
|
|
|
|
|
|
|
|
|
|
|
|
|
|
|
|||
|
Agile Therapeutics, Inc. (4) |
|
|
Drug Delivery |
|
Warrant |
|
Common Stock |
|
|
180,274 |
|
|
|
730 |
|
|
|
6 |
|
|
BioQ Pharma Incorporated |
|
|
Drug Delivery |
|
Warrant |
|
Common Stock |
|
|
459,183 |
|
|
|
1 |
|
|
|
525 |
|
|
Dance Biopharm, Inc. (15) |
|
|
Drug Delivery |
|
Warrant |
|
Common Stock |
|
|
110,882 |
|
|
|
74 |
|
|
|
— |
|
|
Edge Therapeutics, Inc. (4) |
|
|
Drug Delivery |
|
Warrant |
|
Common Stock |
|
|
78,595 |
|
|
|
390 |
|
|
|
3 |
|
|
Kaleo, Inc. (p.k.a. Intelliject, Inc.) |
|
|
Drug Delivery |
|
Warrant |
|
Preferred Series B |
|
|
82,500 |
|
|
|
593 |
|
|
|
1,923 |
|
|
Neos Therapeutics, Inc. (4)(15) |
|
|
Drug Delivery |
|
Warrant |
|
Common Stock |
|
|
70,833 |
|
|
|
285 |
|
|
|
— |
|
|
Pulmatrix Inc. (4) |
|
|
Drug Delivery |
|
Warrant |
|
Common Stock |
|
|
25,150 |
|
|
|
116 |
|
|
|
— |
|
|
ZP Opco, Inc. (p.k.a. Zosano Pharma) (4) |
|
|
Drug Delivery |
|
Warrant |
|
Common Stock |
|
|
3,618 |
|
|
|
266 |
|
|
|
— |
|
|
Subtotal: Drug Delivery (0.26%)* |
|
|
|
|
|
|
|
|
|
|
2,455 |
|
|
|
2,457 |
|
|||
See notes to consolidated financial statements.
114
CONSOLIDATED SCHEDULE OF INVESTMENTS
December 31, 2018
(dollars in thousands)
|
Portfolio Company |
|
|
Sub-Industry |
|
Type of Investment(1) |
|
Series |
|
Shares |
|
|
Cost(3) |
|
|
Value(4) |
|
|||
|
Drug Discovery & Development |
|
|
|
|
|
|
|
|
|
|
|
|
|
|
|
|
|||
|
Acacia Pharma Inc. (4)(10) |
|
|
Drug Discovery & Development |
|
Warrant |
|
Common Stock |
|
|
201,330 |
|
|
$ |
304 |
|
|
$ |
52 |
|
|
ADMA Biologics, Inc. (4) |
|
|
Drug Discovery & Development |
|
Warrant |
|
Common Stock |
|
|
89,750 |
|
|
|
295 |
|
|
|
5 |
|
|
Auris Medical Holding, AG (4)(5)(10) |
|
|
Drug Discovery & Development |
|
Warrant |
|
Common Stock |
|
|
15,672 |
|
|
|
249 |
|
|
|
— |
|
|
Brickell Biotech, Inc. |
|
|
Drug Discovery & Development |
|
Warrant |
|
Preferred Series C |
|
|
26,086 |
|
|
|
119 |
|
|
|
48 |
|
|
Cerecor, Inc. (4) |
|
|
Drug Discovery & Development |
|
Warrant |
|
Common Stock |
|
|
22,328 |
|
|
|
70 |
|
|
|
8 |
|
|
Chroma Therapeutics, Ltd. (5)(10) |
|
|
Drug Discovery & Development |
|
Warrant |
|
Preferred Series D |
|
|
325,261 |
|
|
|
490 |
|
|
|
— |
|
|
Concert Pharmaceuticals, Inc. (4)(10)(15) |
|
|
Drug Discovery & Development |
|
Warrant |
|
Common Stock |
|
|
132,069 |
|
|
|
545 |
|
|
|
289 |
|
|
CTI BioPharma Corp. (p.k.a. Cell Therapeutics, Inc.) (4) |
|
|
Drug Discovery & Development |
|
Warrant |
|
Common Stock |
|
|
29,239 |
|
|
|
165 |
|
|
|
— |
|
|
CytRx Corporation (4)(15) |
|
|
Drug Discovery & Development |
|
Warrant |
|
Common Stock |
|
|
105,694 |
|
|
|
160 |
|
|
|
— |
|
|
Dare Biosciences, Inc. (p.k.a. Cerulean Pharma, Inc.) (4) |
|
|
Drug Discovery & Development |
|
Warrant |
|
Common Stock |
|
|
17,190 |
|
|
|
369 |
|
|
|
— |
|
|
Dicerna Pharmaceuticals, Inc. (4) |
|
|
Drug Discovery & Development |
|
Warrant |
|
Common Stock |
|
|
200 |
|
|
|
28 |
|
|
|
— |
|
|
Evofem Biosciences, Inc. (p.k.a Neothetics, Inc.) (4)(15) |
|
|
Drug Discovery & Development |
|
Warrant |
|
Common Stock |
|
|
7,806 |
|
|
|
266 |
|
|
|
15 |
|
|
Fortress Biotech, Inc. (p.k.a. Coronado Biosciences, Inc.) (4) |
|
|
Drug Discovery & Development |
|
Warrant |
|
Common Stock |
|
|
73,009 |
|
|
|
142 |
|
|
|
— |
|
|
Genocea Biosciences, Inc. (4) |
|
|
Drug Discovery & Development |
|
Warrant |
|
Common Stock |
|
|
403,136 |
|
|
|
431 |
|
|
|
40 |
|
|
Immune Pharmaceuticals (4) |
|
|
Drug Discovery & Development |
|
Warrant |
|
Common Stock |
|
|
10,742 |
|
|
|
164 |
|
|
|
— |
|
|
Melinta Therapeutics (4) |
|
|
Drug Discovery & Development |
|
Warrant |
|
Common Stock |
|
|
40,545 |
|
|
|
626 |
|
|
|
— |
|
|
Motif BioSciences Inc. (4)(5)(10)(15) |
|
|
Drug Discovery & Development |
|
Warrant |
|
Common Stock |
|
|
73,452 |
|
|
|
282 |
|
|
|
78 |
|
|
Myovant Sciences, Ltd. (4)(5)(10) |
|
|
Drug Discovery & Development |
|
Warrant |
|
Common Stock |
|
|
73,710 |
|
|
|
460 |
|
|
|
502 |
|
|
Neuralstem, Inc. (4)(15) |
|
|
Drug Discovery & Development |
|
Warrant |
|
Common Stock |
|
|
5,783 |
|
|
|
77 |
|
|
|
— |
|
|
Ology Bioservices, Inc. (p.k.a. Nanotherapeutics, Inc.) (15) |
|
|
Drug Discovery & Development |
|
Warrant |
|
Common Stock |
|
|
171,389 |
|
|
|
838 |
|
|
|
— |
|
|
Paratek Pharmaceuticals, Inc. (p.k.a. Transcept Pharmaceuticals, Inc.) (4)(10)(15)(16) |
|
|
Drug Discovery & Development |
|
Warrant |
|
Common Stock |
|
|
94,841 |
|
|
|
204 |
|
|
|
20 |
|
|
Savara Inc. (p.k.a. Mast Therapeutics, Inc.) (4)(15) |
|
|
Drug Discovery & Development |
|
Warrant |
|
Common Stock |
|
|
32,467 |
|
|
|
203 |
|
|
|
52 |
|
|
Sorrento Therapeutics, Inc. (4)(10) |
|
|
Drug Discovery & Development |
|
Warrant |
|
Common Stock |
|
|
306,748 |
|
|
|
889 |
|
|
|
192 |
|
|
Stealth Bio Therapeutics Corp. (5)(10) |
|
|
Drug Discovery & Development |
|
Warrant |
|
Preferred Series A |
|
|
216,666 |
|
|
|
158 |
|
|
|
55 |
|
|
Tricida, Inc. (4)(15) |
|
|
Drug Discovery & Development |
|
Warrant |
|
Common Stock |
|
|
106,916 |
|
|
|
863 |
|
|
|
1,268 |
|
|
uniQure B.V. (4)(5)(10) |
|
|
Drug Discovery & Development |
|
Warrant |
|
Common Stock |
|
|
37,174 |
|
|
|
218 |
|
|
|
468 |
|
|
X4 Pharmaceuticals, Inc. |
|
|
Drug Discovery & Development |
|
Warrant |
|
Preferred Series B |
|
|
210,638 |
|
|
|
270 |
|
|
|
206 |
|
|
XOMA Corporation (4)(10)(15) |
|
|
Drug Discovery & Development |
|
Warrant |
|
Common Stock |
|
|
9,063 |
|
|
|
279 |
|
|
|
2 |
|
|
Subtotal: Drug Discovery & Development (0.35%)* |
|
|
|
|
|
|
|
|
|
|
9,164 |
|
|
|
3,300 |
|
|||
|
Electronics & Computer Hardware |
|
|
|
|
|
|
|
|
|
|
|
|
|
|
|
|
|||
|
908 DEVICES INC. (15) |
|
|
Electronics & Computer Hardware |
|
Warrant |
|
Preferred Series D |
|
|
79,856 |
|
|
|
101 |
|
|
|
28 |
|
|
Subtotal: Electronics & Computer Hardware (0.00%)* |
|
|
|
|
|
|
|
|
|
|
101 |
|
|
|
28 |
|
|||
|
Healthcare Services, Other |
|
|
|
|
|
|
|
|
|
|
|
|
|
|
|
|
|||
|
Chromadex Corporation (4) |
|
|
Healthcare Services, Other |
|
Warrant |
|
Common Stock |
|
|
139,673 |
|
|
|
157 |
|
|
|
102 |
|
|
Subtotal: Healthcare Services, Other (0.01%)* |
|
|
|
|
|
|
|
|
|
|
157 |
|
|
|
102 |
|
|||
|
Information Services |
|
|
|
|
|
|
|
|
|
|
|
|
|
|
|
|
|||
|
INMOBI Inc. (5)(10) |
|
|
Information Services |
|
Warrant |
|
Common Stock |
|
|
65,587 |
|
|
|
82 |
|
|
|
— |
|
|
MDX Medical, Inc. (15) |
|
|
Information Services |
|
Warrant |
|
Common Stock |
|
|
2,812,500 |
|
|
|
283 |
|
|
|
144 |
|
|
Netbase Solutions, Inc. |
|
|
Information Services |
|
Warrant |
|
Preferred Series 1 |
|
|
60,000 |
|
|
|
356 |
|
|
|
378 |
|
|
RichRelevance, Inc. |
|
|
Information Services |
|
Warrant |
|
Preferred Series E |
|
|
112,612 |
|
|
|
98 |
|
|
|
— |
|
|
Subtotal: Information Services (0.05%)* |
|
|
|
|
|
|
|
|
|
|
819 |
|
|
|
522 |
|
|||
See notes to consolidated financial statements.
115
CONSOLIDATED SCHEDULE OF INVESTMENTS
December 31, 2018
(dollars in thousands)
|
Portfolio Company |
|
|
Sub-Industry |
|
Type of Investment(1) |
|
Series |
|
Shares |
|
|
Cost(3) |
|
|
Value(4) |
|
|||
|
Internet Consumer & Business Services |
|
|
|
|
|
|
|
|
|
|
|
|
|
|
|
|
|||
|
Aria Systems, Inc. |
|
|
Internet Consumer & Business Services |
|
Warrant |
|
Preferred Series G |
|
|
231,535 |
|
|
$ |
73 |
|
|
$ |
— |
|
|
Art.com, Inc. (15) |
|
|
Internet Consumer & Business Services |
|
Warrant |
|
Preferred Series B |
|
|
311,005 |
|
|
|
66 |
|
|
|
— |
|
|
Blurb, Inc. (15) |
|
|
Internet Consumer & Business Services |
|
Warrant |
|
Preferred Series C |
|
|
234,280 |
|
|
|
636 |
|
|
|
13 |
|
|
ClearObject, Inc. (p.k.a. CloudOne, Inc.) |
|
|
Internet Consumer & Business Services |
|
Warrant |
|
Preferred Series E |
|
|
968,992 |
|
|
|
19 |
|
|
|
27 |
|
|
Cloudpay, Inc. (5)(10) |
|
|
Internet Consumer & Business Services |
|
Warrant |
|
Preferred Series B |
|
|
4,960 |
|
|
|
45 |
|
|
|
11 |
|
|
Contentful, Inc. (5)(10) |
|
|
Internet Consumer & Business Services |
|
Warrant |
|
Preferred Series C |
|
|
82 |
|
|
|
1 |
|
|
|
41 |
|
|
Fastly, Inc. |
|
|
Internet Consumer & Business Services |
|
Warrant |
|
Preferred Series F |
|
|
152,195 |
|
|
|
71 |
|
|
|
72 |
|
|
First Insight, Inc. (15) |
|
|
Internet Consumer & Business Services |
|
Warrant |
|
Preferred Series B |
|
|
56,938 |
|
|
|
70 |
|
|
|
55 |
|
|
Intent Media, Inc. |
|
|
Internet Consumer & Business Services |
|
Warrant |
|
Common Stock |
|
|
140,077 |
|
|
|
168 |
|
|
|
168 |
|
|
Interactions Corporation |
|
|
Internet Consumer & Business Services |
|
Warrant |
|
Preferred Series G-3 |
|
|
68,187 |
|
|
|
204 |
|
|
|
401 |
|
|
Just Fabulous, Inc. |
|
|
Internet Consumer & Business Services |
|
Warrant |
|
Preferred Series B |
|
|
206,184 |
|
|
|
1,101 |
|
|
|
1,877 |
|
|
Lightspeed POS, Inc. (5)(10) |
|
|
Internet Consumer & Business Services |
|
Warrant |
|
Preferred Series C |
|
|
245,610 |
|
|
|
20 |
|
|
|
165 |
|
|
LogicSource |
|
|
Internet Consumer & Business Services |
|
Warrant |
|
Preferred Series C |
|
|
79,625 |
|
|
|
30 |
|
|
|
26 |
|
|
Oportun (p.k.a. Progress Financial) |
|
|
Internet Consumer & Business Services |
|
Warrant |
|
Preferred Series G |
|
|
174,562 |
|
|
|
78 |
|
|
|
247 |
|
|
Postmates, Inc. |
|
|
Internet Consumer & Business Services |
|
Warrant |
|
Common Stock |
|
|
189,865 |
|
|
|
317 |
|
|
|
239 |
|
|
RumbleON, Inc. (4) |
|
|
Internet Consumer & Business Services |
|
Warrant |
|
Common Stock |
|
|
102,768 |
|
|
|
87 |
|
|
|
89 |
|
|
ShareThis, Inc. |
|
|
Internet Consumer & Business Services |
|
Warrant |
|
Preferred Series C |
|
|
493,502 |
|
|
|
547 |
|
|
|
— |
|
|
Snagajob.com, Inc. |
|
|
Internet Consumer & Business Services |
|
Warrant |
|
Preferred Series A |
|
|
1,800,000 |
|
|
|
782 |
|
|
|
121 |
|
|
|
|
|
Internet Consumer & Business Services |
|
Warrant |
|
Preferred Series B |
|
|
173,076 |
|
|
|
8 |
|
|
|
7 |
|
|
Total Snagajob.com, Inc. |
|
|
|
|
|
|
1,973,076 |
|
|
|
790 |
|
|
|
128 |
|
|||
|
Tapjoy, Inc. |
|
|
Internet Consumer & Business Services |
|
Warrant |
|
Preferred Series D |
|
|
748,670 |
|
|
|
316 |
|
|
|
12 |
|
|
The Faction Group LLC |
|
|
Internet Consumer & Business Services |
|
Warrant |
|
Preferred Series A |
|
|
8,703 |
|
|
|
234 |
|
|
|
260 |
|
|
Thumbtack, Inc. |
|
|
Internet Consumer & Business Services |
|
Warrant |
|
Common Stock |
|
|
102,821 |
|
|
|
124 |
|
|
|
102 |
|
|
Xometry, Inc. |
|
|
Internet Consumer & Business Services |
|
Warrant |
|
Preferred Series B |
|
|
87,784 |
|
|
|
47 |
|
|
|
63 |
|
|
Subtotal: Internet Consumer & Business Services (0.42%)* |
|
|
|
|
|
|
|
|
|
|
5,044 |
|
|
|
3,996 |
|
|||
|
Media/Content/Info |
|
|
|
|
|
|
|
|
|
|
|
|
|
|
|
|
|||
|
Machine Zone, Inc. |
|
|
Media/Content/Info |
|
Warrant |
|
Common Stock |
|
|
1,552,710 |
|
|
|
1,960 |
|
|
|
2,361 |
|
|
Napster (p.k.a. Rhapsody International, Inc.) |
|
|
Media/Content/Info |
|
Warrant |
|
Common Stock |
|
|
715,755 |
|
|
|
383 |
|
|
|
38 |
|
|
WP Technology, Inc. (Wattpad, Inc.) (5)(10) |
|
|
Media/Content/Info |
|
Warrant |
|
Common Stock |
|
|
255,818 |
|
|
|
4 |
|
|
|
5 |
|
|
Zoom Media Group, Inc. |
|
|
Media/Content/Info |
|
Warrant |
|
Preferred Series A |
|
|
1,204 |
|
|
|
348 |
|
|
|
22 |
|
|
Subtotal: Media/Content/Info (0.25%)* |
|
|
|
|
|
|
|
|
|
|
2,695 |
|
|
|
2,426 |
|
|||
|
Medical Devices & Equipment |
|
|
|
|
|
|
|
|
|
|
|
|
|
|
|
|
|||
|
SINTX Technologies, Inc. (p.k.a. Amedica Corporation) (4)(15) |
|
|
Medical Devices & Equipment |
|
Warrant |
|
Common Stock |
|
|
8,603 |
|
|
|
459 |
|
|
|
— |
|
|
Aspire Bariatrics, Inc. (15) |
|
|
Medical Devices & Equipment |
|
Warrant |
|
Preferred Series B-1 |
|
|
112,858 |
|
|
|
455 |
|
|
|
— |
|
|
Avedro, Inc. (15) |
|
|
Medical Devices & Equipment |
|
Warrant |
|
Preferred Series AA |
|
|
300,000 |
|
|
|
401 |
|
|
|
367 |
|
|
Flowonix Medical Incorporated |
|
|
Medical Devices & Equipment |
|
Warrant |
|
Preferred Series AA |
|
|
155,325 |
|
|
|
362 |
|
|
|
— |
|
|
|
|
|
Medical Devices & Equipment |
|
Warrant |
|
Preferred Series BB |
|
|
725,806 |
|
|
|
351 |
|
|
|
351 |
|
|
Total Flowonix Medical Incorporated |
|
|
|
|
|
|
881,131 |
|
|
|
713 |
|
|
|
351 |
|
|||
|
Gelesis, Inc. |
|
|
Medical Devices & Equipment |
|
Warrant |
|
Preferred Series A-1 |
|
|
74,784 |
|
|
|
78 |
|
|
|
158 |
|
|
InspireMD, Inc. (4)(5)(10) |
|
|
Medical Devices & Equipment |
|
Warrant |
|
Common Stock |
|
|
1,105 |
|
|
|
— |
|
|
|
— |
|
|
Intuity Medical, Inc. (15) |
|
|
Medical Devices & Equipment |
|
Warrant |
|
Preferred Series 4 |
|
|
1,819,078 |
|
|
|
294 |
|
|
|
508 |
|
|
Medrobotics Corporation (15) |
|
|
Medical Devices & Equipment |
|
Warrant |
|
Preferred Series E |
|
|
455,539 |
|
|
|
370 |
|
|
|
25 |
|
|
Micell Technologies, Inc. |
|
|
Medical Devices & Equipment |
|
Warrant |
|
Preferred Series D-2 |
|
|
84,955 |
|
|
|
262 |
|
|
|
— |
|
|
NinePoint Medical, Inc. |
|
|
Medical Devices & Equipment |
|
Warrant |
|
Preferred Series A-1 |
|
|
587,840 |
|
|
|
170 |
|
|
|
90 |
|
|
Optiscan Biomedical, Corp. (6) |
|
|
Medical Devices & Equipment |
|
Warrant |
|
Preferred Series E |
|
|
74,424 |
|
|
|
573 |
|
|
|
178 |
|
|
Outset Medical, Inc. (p.k.a. Home Dialysis Plus, Inc.) |
|
|
Medical Devices & Equipment |
|
Warrant |
|
Preferred Series A |
|
|
500,000 |
|
|
|
402 |
|
|
|
184 |
|
|
Quanterix Corporation (4) |
|
|
Medical Devices & Equipment |
|
Warrant |
|
Common Stock |
|
|
66,039 |
|
|
|
204 |
|
|
|
394 |
|
|
Sebacia, Inc. |
|
|
Medical Devices & Equipment |
|
Warrant |
|
Preferred Series D |
|
|
778,301 |
|
|
|
133 |
|
|
|
186 |
|
|
SonaCare Medical, LLC (p.k.a. US HIFU, LLC) |
|
|
Medical Devices & Equipment |
|
Warrant |
|
Preferred Series A |
|
|
6,464 |
|
|
|
188 |
|
|
|
— |
|
|
Tela Bio, Inc. |
|
|
Medical Devices & Equipment |
|
Warrant |
|
Preferred Series B |
|
|
387,930 |
|
|
|
61 |
|
|
|
55 |
|
|
ViewRay, Inc. (4)(15) |
|
|
Medical Devices & Equipment |
|
Warrant |
|
Common Stock |
|
|
128,231 |
|
|
|
333 |
|
|
|
176 |
|
|
Subtotal: Medical Devices & Equipment (0.28%)* |
|
|
|
|
|
|
|
|
|
|
5,096 |
|
|
|
2,672 |
|
|||
|
Semiconductors |
|
|
|
|
|
|
|
|
|
|
|
|
|
|
|
|
|||
|
Achronix Semiconductor Corporation |
|
|
Semiconductors |
|
Warrant |
|
Preferred Series C |
|
|
360,000 |
|
|
|
160 |
|
|
|
354 |
|
|
|
|
|
Semiconductors |
|
Warrant |
|
Preferred Series D-2 |
|
|
750,000 |
|
|
|
99 |
|
|
|
543 |
|
|
Total Achronix Semiconductor Corporation |
|
|
|
|
|
|
1,110,000 |
|
|
|
259 |
|
|
|
897 |
|
|||
|
Aquantia Corp. (4) |
|
|
Semiconductors |
|
Warrant |
|
Common Stock |
|
|
19,683 |
|
|
|
4 |
|
|
|
2 |
|
|
Subtotal: Semiconductors (0.09%)* |
|
|
|
|
|
|
|
|
|
|
263 |
|
|
|
899 |
|
|||
See notes to consolidated financial statements.
116
CONSOLIDATED SCHEDULE OF INVESTMENTS
December 31, 2018
(dollars in thousands)
|
Portfolio Company |
|
|
Sub-Industry |
|
Type of Investment(1) |
|
Series |
|
Shares |
|
|
Cost(3) |
|
|
Value(4) |
|
|||
|
Software |
|
|
|
|
|
|
|
|
|
|
|
|
|
|
|
|
|||
|
Actifio, Inc. |
|
|
Software |
|
Warrant |
|
Common Stock |
|
|
73,584 |
|
|
$ |
249 |
|
|
$ |
77 |
|
|
|
|
|
Software |
|
Warrant |
|
Preferred Series F |
|
|
31,673 |
|
|
|
343 |
|
|
|
90 |
|
|
Total Actifio, Inc. |
|
|
|
|
|
|
105,257 |
|
|
|
592 |
|
|
|
167 |
|
|||
|
CareCloud Corporation (15) |
|
|
Software |
|
Warrant |
|
Preferred Series B |
|
|
413,433 |
|
|
|
257 |
|
|
|
25 |
|
|
Clickfox, Inc. (15) |
|
|
Software |
|
Warrant |
|
Preferred Series B |
|
|
539,818 |
|
|
|
167 |
|
|
|
5 |
|
|
|
|
|
Software |
|
Warrant |
|
Preferred Series C |
|
|
592,019 |
|
|
|
730 |
|
|
|
9 |
|
|
|
|
|
Software |
|
Warrant |
|
Preferred Series C-A |
|
|
2,218,214 |
|
|
|
231 |
|
|
|
133 |
|
|
Total Clickfox, Inc. |
|
|
|
|
|
|
3,350,051 |
|
|
|
1,128 |
|
|
|
147 |
|
|||
|
Cloudian, Inc. |
|
|
Software |
|
Warrant |
|
Common Stock |
|
|
477,454 |
|
|
|
72 |
|
|
|
57 |
|
|
DNAnexus, Inc. |
|
|
Software |
|
Warrant |
|
Preferred Series C |
|
|
909,091 |
|
|
|
97 |
|
|
|
126 |
|
|
Evernote Corporation |
|
|
Software |
|
Warrant |
|
Common Stock |
|
|
62,500 |
|
|
|
106 |
|
|
|
100 |
|
|
Fuze, Inc. (15)(16) |
|
|
Software |
|
Warrant |
|
Preferred Series F |
|
|
256,158 |
|
|
|
89 |
|
|
|
— |
|
|
Lightbend, Inc. (15) |
|
|
Software |
|
Warrant |
|
Preferred Series C-1 |
|
|
712,323 |
|
|
|
109 |
|
|
|
49 |
|
|
Message Systems, Inc. (15) |
|
|
Software |
|
Warrant |
|
Preferred Series C |
|
|
503,718 |
|
|
|
334 |
|
|
|
499 |
|
|
Neos, Inc. |
|
|
Software |
|
Warrant |
|
Common Stock |
|
|
221,150 |
|
|
|
22 |
|
|
|
— |
|
|
OneLogin, Inc. (15) |
|
|
Software |
|
Warrant |
|
Common Stock |
|
|
381,620 |
|
|
|
304 |
|
|
|
401 |
|
|
Poplicus, Inc. |
|
|
Software |
|
Warrant |
|
Common Stock |
|
|
132,168 |
|
|
|
— |
|
|
|
— |
|
|
Quid, Inc. (15) |
|
|
Software |
|
Warrant |
|
Preferred Series D |
|
|
71,576 |
|
|
|
1 |
|
|
|
3 |
|
|
RapidMiner, Inc. |
|
|
Software |
|
Warrant |
|
Preferred Series C-1 |
|
|
4,982 |
|
|
|
24 |
|
|
|
17 |
|
|
RedSeal Inc. (15) |
|
|
Software |
|
Warrant |
|
Preferred Series C-Prime |
|
|
640,603 |
|
|
|
66 |
|
|
|
28 |
|
|
Signpost, Inc. |
|
|
Software |
|
Warrant |
|
Preferred Series C |
|
|
324,005 |
|
|
|
314 |
|
|
|
187 |
|
|
ThreatConnect, Inc. (15) |
|
|
Software |
|
Warrant |
|
Preferred Series B |
|
|
134,086 |
|
|
|
26 |
|
|
|
25 |
|
|
Wrike, Inc. |
|
|
Software |
|
Warrant |
|
Common Stock |
|
|
698,760 |
|
|
|
461 |
|
|
|
6,024 |
|
|
Subtotal: Software (0.82%)* |
|
|
|
|
|
|
|
|
|
|
4,002 |
|
|
|
7,855 |
|
|||
|
Specialty Pharmaceuticals |
|
|
|
|
|
|
|
|
|
|
|
|
|
|
|
|
|||
|
Alimera Sciences, Inc. (4) |
|
|
Specialty Pharmaceuticals |
|
Warrant |
|
Common Stock |
|
|
1,717,709 |
|
|
|
861 |
|
|
|
24 |
|
|
Subtotal: Specialty Pharmaceuticals (0.00%)* |
|
|
|
|
|
|
|
|
|
|
861 |
|
|
|
24 |
|
|||
|
Surgical Devices |
|
|
|
|
|
|
|
|
|
|
|
|
|
|
|
|
|||
|
Gynesonics, Inc. (15) |
|
|
Surgical Devices |
|
Warrant |
|
Preferred Series C |
|
|
180,480 |
|
|
|
74 |
|
|
|
4 |
|
|
|
|
|
Surgical Devices |
|
Warrant |
|
Preferred Series D |
|
|
1,575,965 |
|
|
|
321 |
|
|
|
24 |
|
|
Total Gynesonics, Inc. |
|
|
|
|
|
|
1,756,445 |
|
|
|
395 |
|
|
|
28 |
|
|||
|
Transmedics, Inc. |
|
|
Surgical Devices |
|
Warrant |
|
Preferred Series D |
|
|
175,000 |
|
|
|
100 |
|
|
|
263 |
|
|
|
|
|
Surgical Devices |
|
Warrant |
|
Preferred Series F |
|
|
50,544 |
|
|
|
38 |
|
|
|
— |
|
|
Total Transmedics, Inc. |
|
|
|
|
|
|
225,544 |
|
|
|
138 |
|
|
|
263 |
|
|||
|
Subtotal: Surgical Devices (0.03%)* |
|
|
|
|
|
|
|
|
|
|
533 |
|
|
|
291 |
|
|||
See notes to consolidated financial statements.
117
CONSOLIDATED SCHEDULE OF INVESTMENTS
December 31, 2018
(dollars in thousands)
|
Portfolio Company |
|
|
Sub-Industry |
|
Type of Investment(1) |
|
Series |
|
Shares |
|
|
Cost(3) |
|
|
Value(4) |
|
|||
|
Sustainable and Renewable Technology |
|
|
|
|
|
|
|
|
|
|
|
|
|
|
|
|
|||
|
Agrivida, Inc. |
|
|
Sustainable and Renewable Technology |
|
Warrant |
|
Preferred Series D |
|
|
471,327 |
|
|
$ |
120 |
|
|
$ |
— |
|
|
American Superconductor Corporation (4) |
|
|
Sustainable and Renewable Technology |
|
Warrant |
|
Common Stock |
|
|
58,823 |
|
|
|
39 |
|
|
|
208 |
|
|
Calera, Inc. |
|
|
Sustainable and Renewable Technology |
|
Warrant |
|
Preferred Series C |
|
|
44,529 |
|
|
|
513 |
|
|
|
— |
|
|
Fluidic, Inc. |
|
|
Sustainable and Renewable Technology |
|
Warrant |
|
Preferred Series D |
|
|
61,804 |
|
|
|
102 |
|
|
|
— |
|
|
Flywheel Building Intelligence, Inc. (p.k.a. SCIEnergy, Inc.) |
|
|
Sustainable and Renewable Technology |
|
Warrant |
|
Common Stock |
|
|
5,310 |
|
|
|
181 |
|
|
|
— |
|
|
|
|
|
Sustainable and Renewable Technology |
|
Warrant |
|
Preferred Series 2-A |
|
|
63 |
|
|
|
50 |
|
|
|
— |
|
|
Total Flywheel Building Intelligence, Inc. (p.k.a. SCIEnergy, Inc.) |
|
|
|
|
|
|
5,373 |
|
|
|
231 |
|
|
|
— |
|
|||
|
Fulcrum Bioenergy, Inc. |
|
|
Sustainable and Renewable Technology |
|
Warrant |
|
Preferred Series C-1 |
|
|
280,897 |
|
|
|
274 |
|
|
|
365 |
|
|
GreatPoint Energy, Inc. (15) |
|
|
Sustainable and Renewable Technology |
|
Warrant |
|
Preferred Series D-1 |
|
|
393,212 |
|
|
|
547 |
|
|
|
— |
|
|
Kinestral Technologies, Inc. |
|
|
Sustainable and Renewable Technology |
|
Warrant |
|
Preferred Series A |
|
|
325,000 |
|
|
|
155 |
|
|
|
45 |
|
|
|
|
|
Sustainable and Renewable Technology |
|
Warrant |
|
Preferred Series B |
|
|
131,883 |
|
|
|
63 |
|
|
|
13 |
|
|
Total Kinestral Technologies, Inc. |
|
|
|
|
|
|
456,883 |
|
|
|
218 |
|
|
|
58 |
|
|||
|
Polyera Corporation (15) |
|
|
Sustainable and Renewable Technology |
|
Warrant |
|
Preferred Series C |
|
|
311,609 |
|
|
|
338 |
|
|
|
— |
|
|
Proterra, Inc. |
|
|
Sustainable and Renewable Technology |
|
Warrant |
|
Preferred Series 4 |
|
|
477,517 |
|
|
|
41 |
|
|
|
138 |
|
|
Rive Technology, Inc. (15) |
|
|
Sustainable and Renewable Technology |
|
Warrant |
|
Preferred Series E |
|
|
234,477 |
|
|
|
13 |
|
|
|
8 |
|
|
Solar Spectrum Holdings LLC (p.k.a. Sungevity, Inc.) (6) |
|
|
Sustainable and Renewable Technology |
|
Warrant |
|
Class A Units |
|
|
0.69 |
|
|
|
— |
|
|
|
— |
|
|
TAS Energy, Inc. |
|
|
Sustainable and Renewable Technology |
|
Warrant |
|
Preferred Series AA |
|
|
428,571 |
|
|
|
299 |
|
|
|
— |
|
|
Tendril Networks |
|
|
Sustainable and Renewable Technology |
|
Warrant |
|
Preferred Series 3-A |
|
|
1,019,793 |
|
|
|
189 |
|
|
|
— |
|
|
Subtotal: Sustainable and Renewable Technology (0.08%)* |
|
|
|
|
|
|
|
|
|
|
2,924 |
|
|
|
777 |
|
|||
|
Total: Warrant Investments (2.79%)* |
|
|
|
|
|
|
|
|
|
|
35,696 |
|
|
|
26,669 |
|
|||
|
Total Investments in Securities (196.81%)* |
|
|
|
|
|
|
|
|
|
$ |
1,980,524 |
|
|
$ |
1,880,373 |
|
|||
|
* |
Value as a percent of net assets |
|
(1) |
Preferred and common stock, warrants, and equity interests are generally non-income producing. |
|
(2) |
Interest rate PRIME represents 5.50% at December 31, 2018. Daily LIBOR, 1-month LIBOR, 3-month LIBOR and 12-month LIBOR represent 2.39%, 2.52%, 2.80% and 3.01%, respectively, at December 31, 2018. |
|
(3) |
Gross unrealized appreciation, gross unrealized depreciation, and net unrealized depreciation for federal income tax purposes totaled $39.6 million, $158.7 million and $119.1 million, respectively. The tax cost of investments is $2.0 billion. |
|
(4) |
Except for warrants in 37 publicly traded companies and common stock in 21 publicly traded companies, all investments are restricted at December 31, 2018 and were valued at fair value using Level 3 significant unobservable inputs as determined in good faith by the Company’s board of directors (the “Board of Directors”). No unrestricted securities of the same issuer are outstanding. The Company uses the Standard Industrial Code for classifying the industry grouping of its portfolio companies. |
|
(5) |
Non-U.S. company or the company’s principal place of business is outside the United States. |
|
(6) |
Affiliate investment as defined under the Investment Company Act of 1940, as amended, (the “1940 Act”) in which Hercules owns at least 5% but generally less than 25% of the company’s voting securities. |
|
(7) |
Control investment as defined under the 1940 Act in which Hercules owns at least 25% of the company’s voting securities or has greater than 50% representation on its board. |
|
(8) |
Debt is on non-accrual status at December 31, 2018, and is therefore considered non-income producing. Note that at December 31, 2018, only the $11.0 million PIK loan is on non-accrual for the Company’s debt investment in Tectura Corporation. |
|
(9) |
Denotes that all or a portion of the debt investment is convertible debt. |
|
(10) |
Indicates assets that the Company deems not “qualifying assets” under section 55(a) of 1940 Act. Qualifying assets must represent at least 70% of the Company’s total assets at the time of acquisition of any additional non-qualifying assets. |
|
(11) |
Denotes that all or a portion of the debt investment secures the notes offered in the Debt Securitization (as defined in Note 4). |
|
(12) |
Denotes that all or a portion of the debt investment is pledged as collateral under the Wells Facility (as defined in Note 4). |
|
(13) |
Denotes that all or a portion of the debt investment is pledged as collateral under the Union Bank Facility (as defined in Note 4). |
|
(14) |
Denotes that all or a portion of the debt investment principal includes accumulated PIK interest and is net of repayments. |
|
(15) |
Denotes that all or a portion of the investment in this portfolio company is held by Hercules Technology III, L.P., or HT III, the Company’s wholly owned small business investment company, or SBIC, subsidiary. |
|
(16) |
Denotes that the fair value of the Company’s total investments in this portfolio company represent greater than 5% of the Company’s total assets at December 31, 2018. |
|
(17) |
Denotes that there is an unfunded contractual commitment available at the request of this portfolio company at December 31, 2018. Refer to Note 10. |
|
(18) |
Denotes unitranche debt with first lien “last-out” senior secured position and security interest in all assets of the portfolio company whereby the “last-out” portion will be subordinated to the “first-out” portion in a liquidation, sale or other disposition. |
|
(19) |
Denotes second lien senior secured debt. |
See notes to consolidated financial statements.
118
CONSOLIDATED SCHEDULE OF INVESTMENTS
December 31, 2017
(dollars in thousands)
|
Portfolio Company |
|
Sub-Industry |
|
Type of Investment (1) |
|
Maturity Date |
|
Interest Rate and Floor (2) |
|
Principal Amount |
|
|
Cost (3) |
|
|
Value (4) |
|
|||
|
Debt Investments |
|
|
|
|
|
|
|
|
|
|
|
|
|
|
|
|
|
|
|
|
|
Biotechnology Tools |
|
|
|
|
|
|
|
|
|
|
|
|
|
|
|
|
|
|
|
|
|
1-5 Years Maturity |
|
|
|
|
|
|
|
|
|
|
|
|
|
|
|
|
|
|
|
|
|
Exicure, Inc. (12) |
|
Biotechnology Tools |
|
Senior Secured |
|
September 2019 |
|
Interest rate PRIME + 6.45% or Floor rate of 9.95%, 3.85% Exit Fee |
|
$ |
4,999 |
|
|
$ |
5,115 |
|
|
$ |
5,146 |
|
|
Subtotal: 1-5 Years Maturity |
|
|
|
|
|
|
|
|
|
|
|
|
5,115 |
|
|
|
5,146 |
|
||
|
Subtotal: Biotechnology Tools (0.61%)* |
|
|
|
|
|
|
|
|
|
|
|
|
5,115 |
|
|
|
5,146 |
|
||
|
|
|
|
|
|
|
|
|
|
|
|
|
|
|
|
|
|
|
|
|
|
|
Communications & Networking |
|
|
|
|
|
|
|
|
|
|
|
|
|
|
|
|
|
|
||
|
Under 1 Year Maturity |
|
|
|
|
|
|
|
|
|
|
|
|
|
|
|
|
|
|
|
|
|
OpenPeak, Inc. (8) |
|
Communications & Networking |
|
Senior Secured |
|
April 2018 |
|
Interest rate PRIME + 8.75% or Floor rate of 12.00% |
|
$ |
11,464 |
|
|
|
8,228 |
|
|
|
— |
|
|
Subtotal: Under 1 Year Maturity |
|
|
|
|
|
|
|
|
|
|
|
|
8,228 |
|
|
|
— |
|
||
|
Subtotal: Communications & Networking (0.00%)* |
|
|
|
|
|
|
|
|
|
|
|
|
8,228 |
|
|
|
— |
|
||
|
|
|
|
|
|
|
|
|
|
|
|
|
|
|
|
|
|
|
|
|
|
|
Consumer & Business Products |
|
|
|
|
|
|
|
|
|
|
|
|
|
|
|
|
|
|
||
|
Under 1 Year Maturity |
|
|
|
|
|
|
|
|
|
|
|
|
|
|
|
|
|
|
||
|
Antenna79 (p.k.a. Pong Research Corporation) (15) |
|
Consumer & Business Products |
|
Senior Secured |
|
December 2018 |
|
Interest rate PRIME + 6.00% or Floor rate of 9.50% |
|
$ |
1,000 |
|
|
|
1,000 |
|
|
|
1,000 |
|
|
Subtotal: Under 1 Year Maturity |
|
|
|
|
|
|
|
|
|
|
|
|
1,000 |
|
|
|
1,000 |
|
||
|
1-5 Years Maturity |
|
|
|
|
|
|
|
|
|
|
|
|
|
|
|
|
|
|
|
|
|
Antenna79 (p.k.a. Pong Research Corporation) (15) |
|
Consumer & Business Products |
|
Senior Secured |
|
December 2019 |
|
Interest rate PRIME + 7.45% or Floor rate of 10.95%, 2.95% Exit Fee |
|
$ |
18,440 |
|
|
|
18,580 |
|
|
|
18,571 |
|
|
Second Time Around (Simplify Holdings, LLC) (7)(8)(15) |
|
Consumer & Business Products |
|
Senior Secured |
|
February 2019 |
|
Interest rate PRIME + 7.25% or Floor rate of 10.75%, 4.75% Exit Fee |
|
$ |
1,746 |
|
|
|
1,781 |
|
|
|
— |
|
|
Subtotal: 1-5 Years Maturity |
|
|
|
|
|
|
|
|
|
|
|
|
20,361 |
|
|
|
18,571 |
|
||
|
Subtotal: Consumer & Business Products (2.33%)* |
|
|
|
|
|
|
|
|
|
|
|
|
21,361 |
|
|
|
19,571 |
|
||
|
|
|
|
|
|
|
|
|
|
|
|
|
|
|
|
|
|
|
|
|
|
|
Drug Delivery |
|
|
|
|
|
|
|
|
|
|
|
|
|
|
|
|
|
|
||
|
Under 1 Year Maturity |
|
|
|
|
|
|
|
|
|
|
|
|
|
|
|
|
|
|
||
|
Agile Therapeutics, Inc. (11) |
|
Drug Delivery |
|
Senior Secured |
|
December 2018 |
|
Interest rate PRIME + 4.75% or Floor rate of 9.00%, 3.70% Exit Fee |
|
$ |
10,888 |
|
|
|
11,292 |
|
|
|
11,292 |
|
|
Pulmatrix Inc. (9)(11) |
|
Drug Delivery |
|
Senior Secured |
|
July 2018 |
|
Interest rate PRIME + 6.25% or Floor rate of 9.50%, 3.50% Exit Fee |
|
$ |
3,259 |
|
|
|
3,455 |
|
|
|
3,455 |
|
|
ZP Opco, Inc (p.k.a. Zosano Pharma) (11) |
|
Drug Delivery |
|
Senior Secured |
|
December 2018 |
|
Interest rate PRIME + 2.70% or Floor rate of 7.95%, 2.87% Exit Fee |
|
$ |
6,316 |
|
|
|
6,609 |
|
|
|
6,609 |
|
|
Subtotal: Under 1 Year Maturity |
|
|
|
|
|
|
|
|
|
|
|
|
21,356 |
|
|
|
21,356 |
|
||
|
1-5 Years Maturity |
|
|
|
|
|
|
|
|
|
|
|
|
|
|
|
|
|
|
|
|
|
AcelRx Pharmaceuticals, Inc. (10)(11)(15) |
|
Drug Delivery |
|
Senior Secured |
|
March 2020 |
|
Interest rate PRIME + 6.05% or Floor rate of 9.55%, 11.69% Exit Fee |
|
$ |
18,653 |
|
|
|
18,925 |
|
|
|
18,875 |
|
|
Antares Pharma Inc. (10)(15) |
|
Drug Delivery |
|
Senior Secured |
|
July 2022 |
|
Interest rate PRIME + 4.50% or Floor rate of 9.00%, 4.25% Exit Fee |
|
$ |
25,000 |
|
|
|
25,006 |
|
|
|
24,958 |
|
|
Edge Therapeutics, Inc. (12) |
|
Drug Delivery |
|
Senior Secured |
|
February 2020 |
|
Interest rate PRIME + 4.65% or Floor rate of 9.15%, 4.95% Exit Fee |
|
$ |
20,000 |
|
|
|
20,377 |
|
|
|
20,331 |
|
|
Subtotal: 1-5 Years Maturity |
|
|
|
|
|
|
|
|
|
|
|
|
64,308 |
|
|
|
64,164 |
|
||
|
Subtotal: Drug Delivery (10.17%)* |
|
|
|
|
|
|
|
|
|
|
|
|
85,664 |
|
|
|
85,520 |
|
||
See notes to consolidated financial statements.
119
CONSOLIDATED SCHEDULE OF INVESTMENTS
December 31, 2017
(dollars in thousands)
|
Portfolio Company |
|
Sub-Industry |
|
Type of Investment (1) |
|
Maturity Date |
|
Interest Rate and Floor (2) |
|
Principal Amount |
|
|
Cost (3) |
|
|
Value (4) |
|
|||||||||||||
|
Drug Discovery & Development |
|
|
|
|
|
|
|
|
|
|
|
|
|
|
|
|
|
|
||||||||||||
|
Under 1 Year Maturity |
|
|
|
|
|
|
|
|
|
|
|
|
|
|
|
|
|
|
|
|
||||||||||
|
CytRx Corporation (11)(15) |
|
Drug Discovery & Development |
|
Senior Secured |
|
August 2018 |
|
Interest rate PRIME + 6.00% or Floor rate of 9.50%, 7.09% Exit Fee |
|
$ |
9,986 |
|
|
$ |
11,172 |
|
|
$ |
11,172 |
|
||||||||||
|
Epirus Biopharmaceuticals, Inc. (8) |
|
Drug Discovery & Development |
|
Senior Secured |
|
April 2018 |
|
Interest rate PRIME + 4.70% or Floor rate of 7.95%, 3.00% Exit Fee |
|
$ |
3,027 |
|
|
|
3,310 |
|
|
|
340 |
|
||||||||||
|
Subtotal: Under 1 Year Maturity |
|
|
|
|
|
|
|
|
|
|
|
|
14,482 |
|
|
|
11,512 |
|
||||||||||||
|
1-5 Years Maturity |
|
|
|
|
|
|
|
|
|
|
|
|
|
|
|
|
|
|
|
|
||||||||||
|
Auris Medical Holding, AG (5)(10) |
|
Drug Discovery & Development |
|
Senior Secured |
|
January 2020 |
|
Interest rate PRIME + 6.05% or Floor rate of 9.55%, 5.75% Exit Fee |
|
$ |
10,341 |
|
|
|
10,610 |
|
|
|
10,563 |
|
||||||||||
|
Aveo Pharmaceuticals, Inc. (10)(13) |
|
Drug Discovery & Development |
|
Senior Secured |
|
July 2021 |
|
Interest rate PRIME + 4.70% or Floor rate of 9.45%, 5.40% Exit Fee |
|
$ |
10,000 |
|
|
|
10,345 |
|
|
|
10,344 |
|
||||||||||
|
|
|
Drug Discovery & Development |
|
Senior Secured |
|
July 2021 |
|
Interest rate PRIME + 4.70% or Floor rate of 9.45%, 3.00% Exit Fee |
|
$ |
10,000 |
|
|
|
9,918 |
|
|
|
9,915 |
|
||||||||||
|
Total Aveo Pharmaceuticals, Inc. |
|
|
|
|
|
|
|
$ |
20,000 |
|
|
|
20,263 |
|
|
|
20,259 |
|
||||||||||||
|
Axovant Sciences Ltd. (5)(10) |
|
Drug Discovery & Development |
|
Senior Secured |
|
March 2021 |
|
Interest rate PRIME + 6.80% or Floor rate of 10.55% |
|
$ |
55,000 |
|
|
|
53,631 |
|
|
|
53,448 |
|
||||||||||
|
Brickell Biotech, Inc. (12) |
|
Drug Discovery & Development |
|
Senior Secured |
|
September 2019 |
|
Interest rate PRIME + 5.70% or Floor rate of 9.20%, 6.75% Exit Fee |
|
$ |
6,090 |
|
|
|
6,380 |
|
|
|
6,361 |
|
||||||||||
|
Chemocentryx, Inc. (10)(15)(17) |
|
Drug Discovery & Development |
|
Senior Secured |
|
December 2021 |
|
Interest rate PRIME + 3.30% or Floor rate of 8.05%, 6.25% Exit Fee |
|
$ |
5,000 |
|
|
|
4,947 |
|
|
|
4,947 |
|
||||||||||
|
Genocea Biosciences, Inc. (11) |
|
Drug Discovery & Development |
|
Senior Secured |
|
January 2019 |
|
Interest rate PRIME + 2.25% or Floor rate of 7.25%, 4.95% Exit Fee |
|
$ |
13,851 |
|
|
|
14,482 |
|
|
|
14,385 |
|
||||||||||
|
Insmed, Incorporated (11) |
|
Drug Discovery & Development |
|
Senior Secured |
|
October 2020 |
|
Interest rate PRIME + 4.75% or Floor rate of 9.25%, 4.86% Exit Fee |
|
$ |
55,000 |
|
|
|
55,425 |
|
|
|
54,963 |
|
||||||||||
|
Metuchen Pharmaceuticals LLC (12)(14) |
|
Drug Discovery & Development |
|
Senior Secured |
|
October 2020 |
|
Interest rate PRIME + 7.25% or Floor rate of 10.75%, PIK Interest 1.35%, 2.25% Exit Fee |
|
$ |
25,561 |
|
|
|
25,721 |
|
|
|
25,643 |
|
||||||||||
|
Motif BioSciences Inc. (15) |
|
Drug Discovery & Development |
|
Senior Secured |
|
September 2021 |
|
Interest rate PRIME + 5.50% or Floor rate of 10.00%, 2.15% Exit Fee |
|
$ |
15,000 |
|
|
|
14,651 |
|
|
|
14,651 |
|
||||||||||
|
Myovant Sciences, Ltd. (5)(10)(13)(17) |
|
Drug Discovery & Development |
|
Senior Secured |
|
May 2021 |
|
Interest rate PRIME + 4.00% or Floor rate of 8.25%, 6.55% Exit Fee |
|
$ |
25,000 |
|
|
|
24,704 |
|
|
|
24,704 |
|
||||||||||
|
Paratek Pharmaceuticals, Inc. (p.k.a. Transcept Pharmaceuticals, Inc.) (15) |
|
Drug Discovery & Development |
|
Senior Secured |
|
September 2020 |
|
Interest rate PRIME + 2.75% or Floor rate of 8.50%, 4.50% Exit Fee |
|
$ |
40,000 |
|
|
|
40,144 |
|
|
|
39,829 |
|
||||||||||
|
|
|
Drug Discovery & Development |
|
Senior Secured |
|
September 2020 |
|
Interest rate PRIME + 2.75% or Floor rate of 8.50%, 4.50% Exit Fee |
|
$ |
10,000 |
|
|
|
10,040 |
|
|
|
9,958 |
|
||||||||||
|
|
|
Drug Discovery & Development |
|
Senior Secured |
|
September 2020 |
|
Interest rate PRIME + 2.75% or Floor rate of 8.50%, 2.25% Exit Fee |
|
$ |
10,000 |
|
|
|
9,964 |
|
|
|
9,895 |
|
||||||||||
|
Total Paratek Pharmaceuticals, Inc. (p.k.a. Transcept Pharmaceuticals, Inc.) |
|
|
|
$ |
60,000 |
|
|
|
60,148 |
|
|
|
59,682 |
|
||||||||||||||||
|
PhaseRx, Inc. (15) |
|
Drug Discovery & Development |
|
Senior Secured |
|
December 2019 |
|
Interest rate PRIME + 5.75% or Floor rate of 9.25%, 5.85% Exit Fee |
|
$ |
4,694 |
|
|
|
4,842 |
|
|
|
1,917 |
|
||||||||||
|
Stealth Bio Therapeutics Corp. (5)(10)(12) |
|
Drug Discovery & Development |
|
Senior Secured |
|
January 2021 |
|
Interest rate PRIME + 5.50% or Floor rate of 9.50%, 5.00% Exit Fee |
|
$ |
15,000 |
|
|
|
14,898 |
|
|
|
14,847 |
|
||||||||||
|
uniQure B.V. (5)(10)(11) |
|
Drug Discovery & Development |
|
Senior Secured |
|
May 2020 |
|
Interest rate PRIME + 3.00% or Floor rate of 8.25%, 5.48% Exit Fee |
|
$ |
20,000 |
|
|
|
20,579 |
|
|
|
20,543 |
|
||||||||||
|
Verastem, Inc. (12)(17) |
|
Drug Discovery & Development |
|
Senior Secured |
|
December 2020 |
|
Interest rate PRIME + 6.00% or Floor rate of 10.50%, 4.50% Exit Fee |
|
$ |
5,000 |
|
|
|
4,957 |
|
|
|
4,910 |
|
||||||||||
|
|
|
Drug Discovery & Development |
|
Senior Secured |
|
December 2020 |
|
Interest rate PRIME + 6.00% or Floor rate of 10.50%, 4.50% Exit Fee |
|
$ |
5,000 |
|
|
|
4,996 |
|
|
|
4,949 |
|
||||||||||
|
|
|
Drug Discovery & Development |
|
Senior Secured |
|
December 2020 |
|
Interest rate PRIME + 6.00% or Floor rate of 10.50%, 4.50% Exit Fee |
|
$ |
5,000 |
|
|
|
4,953 |
|
|
|
4,907 |
|
||||||||||
|
Total Verastem, Inc. |
|
|
|
|
|
|
|
$ |
15,000 |
|
|
|
14,906 |
|
|
|
14,766 |
|
||||||||||||
|
Subtotal: 1-5 Years Maturity |
|
|
|
|
|
|
|
|
|
|
|
|
346,187 |
|
|
|
341,679 |
|
||||||||||||
|
Subtotal: Drug Discovery & Development (42.00%)* |
|
|
|
|
|
|
|
|
|
|
|
|
360,669 |
|
|
|
353,191 |
|
||||||||||||
See notes to consolidated financial statements.
120
CONSOLIDATED SCHEDULE OF INVESTMENTS
December 31, 2017
(dollars in thousands)
|
Portfolio Company |
|
Sub-Industry |
|
Type of Investment (1) |
|
Maturity Date |
|
Interest Rate and Floor (2) |
|
Principal Amount |
|
|
Cost (3) |
|
|
Value (4) |
|
|||
|
Electronics & Computer Hardware |
|
|
|
|
|
|
|
|
|
|
|
|
|
|
|
|
|
|
||
|
1-5 Years Maturity |
|
|
|
|
|
|
|
|
|
|
|
|
|
|
|
|
|
|
|
|
|
908 DEVICES INC. (15) |
|
Electronics & Computer Hardware |
|
Senior Secured |
|
September 2020 |
|
Interest rate PRIME + 4.00% or Floor rate of 8.25%, 4.25% Exit Fee |
|
$ |
10,000 |
|
|
$ |
10,014 |
|
|
$ |
9,887 |
|
|
Subtotal: 1-5 Years Maturity |
|
|
|
|
|
|
|
|
|
|
|
|
10,014 |
|
|
|
9,887 |
|
||
|
Subtotal: Electronics & Computer Hardware (1.18%)* |
|
|
|
|
|
|
|
|
|
|
|
|
10,014 |
|
|
|
9,887 |
|
||
|
|
|
|
|
|
|
|
|
|
|
|
|
|
|
|
|
|
|
|
|
|
|
Healthcare Services, Other |
|
|
|
|
|
|
|
|
|
|
|
|
|
|
|
|
|
|
||
|
1-5 Years Maturity |
|
|
|
|
|
|
|
|
|
|
|
|
|
|
|
|
|
|
|
|
|
Medsphere Systems Corporation (14)(15) |
|
Healthcare Services, Other |
|
Senior Secured |
|
February 2021 |
|
Interest rate PRIME + 4.75% or Floor rate of 9.00%, PIK Interest 1.75% |
|
$ |
17,607 |
|
|
|
17,437 |
|
|
|
17,437 |
|
|
|
|
Healthcare Services, Other |
|
Senior Secured |
|
February 2021 |
|
Interest rate PRIME + 4.75% or Floor rate of 9.00%, PIK Interest 1.75% |
|
$ |
5,009 |
|
|
|
4,963 |
|
|
|
4,963 |
|
|
Total Medsphere Systems Corporation |
|
|
|
|
|
|
|
$ |
22,616 |
|
|
|
22,400 |
|
|
|
22,400 |
|
||
|
Oak Street Health (12) |
|
Healthcare Services, Other |
|
Senior Secured |
|
September 2021 |
|
Interest rate PRIME + 5.00% or Floor rate of 9.75%, 5.95% Exit Fee |
|
$ |
20,000 |
|
|
|
19,965 |
|
|
|
19,965 |
|
|
PH Group Holdings (13) |
|
Healthcare Services, Other |
|
Senior Secured |
|
September 2020 |
|
Interest rate PRIME + 7.45% or Floor rate of 10.95% |
|
$ |
20,000 |
|
|
|
19,878 |
|
|
|
19,803 |
|
|
|
|
Healthcare Services, Other |
|
Senior Secured |
|
September 2020 |
|
Interest rate PRIME + 7.45% or Floor rate of 10.95% |
|
$ |
10,000 |
|
|
|
9,922 |
|
|
|
9,840 |
|
|
Total PH Group Holdings |
|
|
|
|
|
|
|
$ |
30,000 |
|
|
|
29,800 |
|
|
|
29,643 |
|
||
|
Subtotal: 1-5 Years Maturity |
|
|
|
|
|
|
|
|
|
|
|
|
— |
|
|
|
— |
|
||
|
Subtotal: Healthcare Services, Other (8.56%)* |
|
|
|
|
|
|
|
|
|
|
|
|
72,165 |
|
|
|
72,008 |
|
||
|
|
|
|
|
|
|
|
|
|
|
|
|
|
|
|
|
|
|
|
|
|
|
Information Services |
|
|
|
|
|
|
|
|
|
|
|
|
|
|
|
|
|
|
|
|
|
1-5 Years Maturity |
|
|
|
|
|
|
|
|
|
|
|
|
|
|
|
|
|
|
|
|
|
MDX Medical, Inc. (14)(15)(17) |
|
Information Services |
|
Senior Secured |
|
December 2020 |
|
Interest rate PRIME + 4.25% or Floor rate of 8.25%, PIK Interest 1.70% |
|
$ |
7,568 |
|
|
|
7,369 |
|
|
|
7,327 |
|
|
Netbase Solutions, Inc. (13)(14) |
|
Information Services |
|
Senior Secured |
|
August 2020 |
|
Interest rate PRIME + 6.00% or Floor rate of 10.00%, PIK Interest 2.00%, 3.00% Exit Fee |
|
$ |
9,051 |
|
|
|
8,730 |
|
|
|
8,730 |
|
|
Subtotal: 1-5 Years Maturity |
|
|
|
|
|
|
|
|
|
|
|
|
16,099 |
|
|
|
16,057 |
|
||
|
Subtotal: Information Services (1.91%)* |
|
|
|
|
|
|
|
|
|
|
|
|
16,099 |
|
|
|
16,057 |
|
||
See notes to consolidated financial statements.
121
CONSOLIDATED SCHEDULE OF INVESTMENTS
December 31, 2017
(dollars in thousands)
|
Portfolio Company |
|
Sub-Industry |
|
Type of Investment (1) |
|
Maturity Date |
|
Interest Rate and Floor (2) |
|
Principal Amount |
|
|
Cost (3) |
|
|
Value (4) |
|
||||
|
Internet Consumer & Business Services |
|
|
|
|
|
|
|
|
|
|
|
|
|
|
|
|
|
|
|||
|
1-5 Years Maturity |
|
|
|
|
|
|
|
|
|
|
|
|
|
|
|
|
|
|
|
|
|
|
AppDirect, Inc. |
|
Internet Consumer & Business Services |
|
Senior Secured |
|
January 2022 |
|
Interest rate PRIME + 5.70% or Floor rate of 9.95%, 3.45% Exit Fee |
|
$ |
10,000 |
|
|
$ |
9,885 |
|
|
$ |
9,885 |
|
|
|
Aria Systems, Inc. (11)(14) |
|
Internet Consumer & Business Services |
|
Senior Secured |
|
June 2019 |
|
Interest rate PRIME + 3.20% or Floor rate of 6.95%, PIK Interest 1.95%, 1.50% Exit Fee |
|
$ |
2,103 |
|
|
|
2,104 |
|
|
|
1,803 |
|
|
|
|
|
Internet Consumer & Business Services |
|
Senior Secured |
|
June 2019 |
|
Interest rate PRIME + 5.20% or Floor rate of 8.95%, PIK Interest 1.95%, 1.50% Exit Fee |
|
$ |
18,832 |
|
|
|
18,839 |
|
|
|
16,144 |
|
|
|
Total Aria Systems, Inc. |
|
|
|
|
|
|
|
$ |
20,935 |
|
|
|
20,943 |
|
|
|
17,947 |
|
|||
|
Greenphire Inc. |
|
Internet Consumer & Business Services |
|
Senior Secured |
|
January 2021 |
|
Interest rate 3-month LIBOR + 8.00% or Floor rate of 9.00% |
|
$ |
3,883 |
|
|
|
3,883 |
|
|
|
3,883 |
|
|
|
|
|
Internet Consumer & Business Services |
|
Senior Secured |
|
January 2021 |
|
Interest rate PRIME + 3.75% or Floor rate of 7.00% |
|
$ |
1,000 |
|
|
|
1,000 |
|
|
|
1,000 |
|
|
|
Total Greenphire Inc. |
|
|
|
|
|
|
|
$ |
4,883 |
|
|
|
4,883 |
|
|
|
4,883 |
|
|||
|
Intent Media, Inc. (14)(15) |
|
Internet Consumer & Business Services |
|
Senior Secured |
|
May 2019 |
|
Interest rate PRIME + 5.25% or Floor rate of 8.75%, PIK Interest 1.00%, 2.00% Exit Fee |
|
$ |
5,050 |
|
|
|
5,011 |
|
|
|
5,027 |
|
|
|
|
|
Internet Consumer & Business Services |
|
Senior Secured |
|
May 2019 |
|
Interest rate PRIME + 5.50% or Floor rate of 9.00%, PIK Interest 2.35%, 2.00% Exit Fee |
|
$ |
2,020 |
|
|
|
1,987 |
|
|
|
1,991 |
|
|
|
|
|
Internet Consumer & Business Services |
|
Senior Secured |
|
May 2019 |
|
Interest rate PRIME + 5.50% or Floor rate of 9.00%, PIK Interest 2.50%, 2.00% Exit Fee |
|
$ |
2,022 |
|
|
|
1,988 |
|
|
|
1,992 |
|
|
|
Total Intent Media, Inc. |
|
|
|
|
|
|
|
$ |
9,092 |
|
|
|
8,986 |
|
|
|
9,010 |
|
|||
|
Interactions Corporation |
|
Internet Consumer & Business Services |
|
Senior Secured |
|
March 2021 |
|
Interest rate 3-month LIBOR + 8.60% or Floor rate of 9.85%, 1.75% Exit Fee |
|
$ |
25,000 |
|
|
|
25,013 |
|
|
|
25,013 |
|
|
|
LogicSource (15) |
|
Internet Consumer & Business Services |
|
Senior Secured |
|
October 2019 |
|
Interest rate PRIME + 6.25% or Floor rate of 9.75%, 5.00% Exit Fee |
|
$ |
6,452 |
|
|
|
6,701 |
|
|
|
6,726 |
|
|
|
Snagajob.com, Inc. (13)(14) |
|
Internet Consumer & Business Services |
|
Senior Secured |
|
July 2020 |
|
Interest rate PRIME + 5.15% or Floor rate of 9.15%, PIK Interest 1.95%, 2.55% Exit Fee |
|
$ |
41,023 |
|
|
|
40,633 |
|
|
|
41,036 |
|
|
|
Tectura Corporation (7)(8)(9)(14) |
|
Internet Consumer & Business Services |
|
Senior Secured |
|
June 2021 |
|
Interest rate FIXED 6.00%, PIK Interest 3.00% |
|
$ |
20,298 |
|
|
|
20,298 |
|
|
|
19,219 |
|
|
|
|
|
Internet Consumer & Business Services |
|
Senior Secured |
|
June 2021 |
|
PIK Interest 8.00% |
|
$ |
11,015 |
|
|
|
240 |
|
|
|
— |
|
|
|
Total Tectura Corporation |
|
|
|
|
|
|
|
$ |
31,313 |
|
|
|
20,538 |
|
|
|
19,219 |
|
|||
|
The Faction Group |
|
Internet Consumer & Business Services |
|
Senior Secured |
|
January 2021 |
|
Interest rate 3-month LIBOR + 9.25% or Floor rate of 10.25% |
|
$ |
8,000 |
|
|
|
8,000 |
|
|
|
8,000 |
|
|
|
|
|
Internet Consumer & Business Services |
|
Senior Secured |
|
January 2019 |
|
Interest rate PRIME + 4.75% or Floor rate of 8.25% |
|
$ |
2,000 |
|
|
|
2,000 |
|
|
|
2,000 |
|
|
|
Total The Faction Group |
|
|
|
|
|
|
|
$ |
10,000 |
|
|
|
10,000 |
|
|
|
10,000 |
|
|||
|
Subtotal: 1-5 Years Maturity |
|
|
|
|
|
|
|
|
|
|
|
|
147,582 |
|
|
|
143,719 |
|
|||
|
Subtotal: Internet Consumer & Business Services (17.09%)* |
|
|
|
|
|
|
|
|
|
|
147,582 |
|
|
|
143,719 |
|
|||||
|
|
|
|
|
|
|
|
|
|
|
|
|
|
|
|
|
|
|
|
|
|
|
|
Media/Content/Info |
|
|
|
|
|
|
|
|
|
|
|
|
|
|
|
|
|
|
|
|
|
|
Under 1 Year Maturity |
|
|
|
|
|
|
|
|
|
|
|
|
|
|
|
|
|
|
|
|
|
|
Machine Zone, Inc. (14)(16) |
|
Media/Content/Info |
|
Senior Secured |
|
May 2018 |
|
Interest rate PRIME + 2.50% or Floor rate of 6.75%, PIK Interest 3.00% |
|
$ |
106,986 |
|
|
|
106,641 |
|
|
|
106,641 |
|
|
|
Subtotal: Under 1 Year Maturity |
|
|
|
|
|
|
|
|
|
|
|
|
106,641 |
|
|
|
106,641 |
|
|||
|
1-5 Years Maturity |
|
|
|
|
|
|
|
|
|
|
|
|
|
|
|
|
|
|
|
|
|
|
Bustle (14)(15) |
|
Media/Content/Info |
|
Senior Secured |
|
June 2021 |
|
Interest rate PRIME + 4.10% or Floor rate of 8.35%, PIK Interest 1.95%, 1.95% Exit Fee |
|
$ |
15,016 |
|
|
|
14,935 |
|
|
|
14,935 |
|
|
|
FanDuel, Inc. (9)(12)(14) |
|
Media/Content/Info |
|
Senior Secured |
|
November 2019 |
|
Interest rate PRIME + 7.25% or Floor rate of 10.75%, 10.41% Exit Fee |
|
$ |
19,354 |
|
|
|
19,762 |
|
|
|
19,695 |
|
|
|
|
|
Media/Content/Info |
|
Convertible Debt |
|
September 2020 |
|
PIK Interest 25.00% |
|
$ |
1,000 |
|
|
|
1,000 |
|
|
|
1,000 |
|
|
|
Total FanDuel, Inc. |
|
|
|
|
|
|
|
$ |
20,354 |
|
|
|
20,762 |
|
|
|
20,695 |
|
|||
|
Subtotal: 1-5 Years Maturity |
|
|
|
|
|
|
|
|
|
|
|
|
35,697 |
|
|
|
35,630 |
|
|||
|
Subtotal: Media/Content/Info (16.92%)* |
|
|
|
|
|
|
|
|
|
|
|
|
142,338 |
|
|
|
142,271 |
|
|||
See notes to consolidated financial statements.
122
CONSOLIDATED SCHEDULE OF INVESTMENTS
December 31, 2017
(dollars in thousands)
|
Portfolio Company |
|
Sub-Industry |
|
Type of Investment (1) |
|
Maturity Date |
|
Interest Rate and Floor (2) |
|
Principal Amount |
|
|
Cost (3) |
|
|
Value (4) |
|
|||
|
Medical Devices & Equipment |
|
|
|
|
|
|
|
|
|
|
|
|
|
|
|
|
|
|
||
|
Under 1 Year Maturity |
|
|
|
|
|
|
|
|
|
|
|
|
|
|
|
|
|
|
|
|
|
Amedica Corporation (9)(15) |
|
Medical Devices & Equipment |
|
Senior Secured |
|
January 2018 |
|
Interest rate PRIME + 7.70% or Floor rate of 10.95%, 8.25% Exit Fee |
|
$ |
605 |
|
|
$ |
2,255 |
|
|
$ |
2,255 |
|
|
Aspire Bariatrics, Inc. (15) |
|
Medical Devices & Equipment |
|
Senior Secured |
|
October 2018 |
|
Interest rate PRIME + 4.00% or Floor rate of 9.25%, 5.42% Exit Fee |
|
$ |
2,527 |
|
|
|
2,848 |
|
|
|
2,848 |
|
|
Subtotal: Under 1 Year Maturity |
|
|
|
|
|
|
|
|
|
|
|
|
5,103 |
|
|
|
5,103 |
|
||
|
1-5 Years Maturity |
|
|
|
|
|
|
|
|
|
|
|
|
|
|
|
|
|
|
|
|
|
IntegenX, Inc. (15) |
|
Medical Devices & Equipment |
|
Senior Secured |
|
June 2019 |
|
Interest rate PRIME + 6.05% or Floor rate of 10.05%, 6.75% Exit Fee |
|
$ |
12,500 |
|
|
|
13,042 |
|
|
|
12,991 |
|
|
|
|
Medical Devices & Equipment |
|
Senior Secured |
|
June 2019 |
|
Interest rate PRIME + 6.05% or Floor rate of 10.05%, 6.75% Exit Fee |
|
$ |
2,500 |
|
|
|
2,599 |
|
|
|
2,598 |
|
|
|
|
Medical Devices & Equipment |
|
Senior Secured |
|
June 2019 |
|
Interest rate PRIME + 6.05% or Floor rate of 10.05%, 9.75% Exit Fee |
|
$ |
2,500 |
|
|
|
2,618 |
|
|
|
2,601 |
|
|
Total IntegenX, Inc. |
|
|
|
|
|
|
|
$ |
17,500 |
|
|
|
18,259 |
|
|
|
18,190 |
|
||
|
Intuity Medical, Inc. (15) |
|
Medical Devices & Equipment |
|
Senior Secured |
|
June 2021 |
|
Interest rate PRIME + 5.00% or Floor rate of 9.25%, 4.95% Exit Fee |
|
$ |
17,500 |
|
|
|
17,013 |
|
|
|
17,013 |
|
|
Micell Technologies, Inc. (12) |
|
Medical Devices & Equipment |
|
Senior Secured |
|
August 2019 |
|
Interest rate PRIME + 7.25% or Floor rate of 10.50%, 5.00% Exit Fee |
|
$ |
5,469 |
|
|
|
5,744 |
|
|
|
5,708 |
|
|
Quanta Fluid Solutions (5)(10)(11) |
|
Medical Devices & Equipment |
|
Senior Secured |
|
April 2020 |
|
Interest rate PRIME + 8.05% or Floor rate of 11.55%, 5.00% Exit Fee |
|
$ |
10,117 |
|
|
|
10,432 |
|
|
|
10,386 |
|
|
Quanterix Corporation (11) |
|
Medical Devices & Equipment |
|
Senior Secured |
|
March 2019 |
|
Interest rate PRIME + 2.75% or Floor rate of 8.00%, 4.00% Exit Fee |
|
$ |
9,043 |
|
|
|
9,477 |
|
|
|
9,477 |
|
|
Sebacia, Inc. (15) |
|
Medical Devices & Equipment |
|
Senior Secured |
|
July 2020 |
|
Interest rate PRIME + 4.35% or Floor rate of 8.85%, 6.05% Exit Fee |
|
$ |
8,000 |
|
|
|
7,927 |
|
|
|
7,919 |
|
|
Tela Bio, Inc. (15) |
|
Medical Devices & Equipment |
|
Senior Secured |
|
December 2020 |
|
Interest rate PRIME + 4.95% or Floor rate of 9.45%, 3.15% Exit Fee |
|
$ |
5,000 |
|
|
|
4,991 |
|
|
|
4,973 |
|
|
Subtotal: 1-5 Years Maturity |
|
|
|
|
|
|
|
|
|
|
|
|
73,843 |
|
|
|
73,666 |
|
||
|
Subtotal: Medical Devices & Equipment (9.37%)* |
|
|
|
|
|
|
|
|
|
|
|
|
78,946 |
|
|
|
78,769 |
|
||
|
|
|
|
|
|
|
|
|
|
|
|
|
|
|
|
|
|
|
|
|
|
|
Semiconductors |
|
|
|
|
|
|
|
|
|
|
|
|
|
|
|
|
|
|
|
|
|
1-5 Years Maturity |
|
|
|
|
|
|
|
|
|
|
|
|
|
|
|
|
|
|
|
|
|
Achronix Semiconductor Corporation (15)(17) |
|
Semiconductors |
|
Senior Secured |
|
August 2020 |
|
Interest rate PRIME + 7.00% or Floor rate of 11.00%, 12.50% Exit Fee |
|
$ |
5,000 |
|
|
|
5,084 |
|
|
|
5,100 |
|
|
|
|
Semiconductors |
|
Senior Secured |
|
February 2019 |
|
Interest rate PRIME + 6.00% or Floor rate of 10.00% |
|
$ |
4,274 |
|
|
|
4,274 |
|
|
|
4,273 |
|
|
Total Achronix Semiconductor Corporation |
|
|
|
|
|
|
|
$ |
9,274 |
|
|
|
9,358 |
|
|
|
9,373 |
|
||
|
Subtotal: 1-5 Years Maturity |
|
|
|
|
|
|
|
|
|
|
|
|
9,358 |
|
|
|
9,373 |
|
||
|
Subtotal: Semiconductors (1.11%)* |
|
|
|
|
|
|
|
|
|
|
|
|
9,358 |
|
|
|
9,373 |
|
||
See notes to consolidated financial statements.
123
CONSOLIDATED SCHEDULE OF INVESTMENTS
December 31, 2017
(dollars in thousands)
|
Portfolio Company |
|
Sub-Industry |
|
Type of Investment (1) |
|
Maturity Date |
|
Interest Rate and Floor (2) |
|
Principal Amount |
|
|
Cost (3) |
|
|
Value (4) |
|
|||
|
Software |
|
|
|
|
|
|
|
|
|
|
|
|
|
|
|
|
|
|
|
|
|
Under 1 Year Maturity |
|
|
|
|
|
|
|
|
|
|
|
|
|
|
|
|
|
|
|
|
|
Clickfox, Inc. (13) |
|
Software |
|
Senior Secured |
|
May 2018 |
|
Interest rate PRIME + 8.00% or Floor rate of 11.50%, 12.01% Exit Fee |
|
$ |
6,378 |
|
|
$ |
7,671 |
|
|
$ |
7,671 |
|
|
Digital Train Limited (p.k.a. Jumpstart Games, Inc.) (15) |
|
Software |
|
Senior Secured |
|
July 2018 |
|
Interest rate 12-month LIBOR + 2.50% |
|
$ |
5,671 |
|
|
|
5,671 |
|
|
|
4,073 |
|
|
Subtotal: Under 1 Year Maturity |
|
|
|
|
|
|
|
|
|
|
|
|
13,342 |
|
|
|
11,744 |
|
||
|
1-5 Years Maturity |
|
|
|
|
|
|
|
|
|
|
|
|
|
|
|
|
|
|
|
|
|
Clarabridge, Inc. (12)(14) |
|
Software |
|
Senior Secured |
|
April 2021 |
|
Interest rate PRIME + 4.80% or Floor rate of 8.55%, PIK Interest 3.25% |
|
$ |
40,893 |
|
|
|
40,870 |
|
|
|
41,063 |
|
|
Emma, Inc. |
|
Software |
|
Senior Secured |
|
September 2022 |
|
Interest rate daily LIBOR + 7.75% or Floor rate of 8.75% |
|
$ |
50,000 |
|
|
|
48,565 |
|
|
|
48,565 |
|
|
Evernote Corporation (14)(15)(17) |
|
Software |
|
Senior Secured |
|
October 2020 |
|
Interest rate PRIME + 5.45% or Floor rate of 8.95% |
|
$ |
6,000 |
|
|
|
5,974 |
|
|
|
6,100 |
|
|
|
|
Software |
|
Senior Secured |
|
July 2021 |
|
Interest rate PRIME + 6.00% or Floor rate of 9.50%, PIK Interest 1.25% |
|
$ |
4,023 |
|
|
|
3,999 |
|
|
|
3,992 |
|
|
Total Evernote Corporation |
|
|
|
|
|
|
|
$ |
10,023 |
|
|
|
9,973 |
|
|
|
10,092 |
|
||
|
Fuze, Inc. (13)(14)(15) |
|
Software |
|
Senior Secured |
|
July 2021 |
|
Interest rate PRIME + 3.70% or Floor rate of 7.95%, PIK Interest 1.55%, 3.55% Exit Fee |
|
$ |
50,332 |
|
|
|
50,464 |
|
|
|
50,420 |
|
|
Impact Radius Holdings, Inc. (14)(17) |
|
Software |
|
Senior Secured |
|
December 2020 |
|
Interest rate PRIME + 4.25% or Floor rate of 8.75%, PIK Interest 1.55%, 1.75% Exit Fee |
|
$ |
7,544 |
|
|
|
7,552 |
|
|
|
7,498 |
|
|
Lithium Technologies, Inc. (17) |
|
Software |
|
Senior Secured |
|
October 2022 |
|
Interest rate 1-month LIBOR + 8.00% or Floor rate of 9.00% |
|
$ |
12,000 |
|
|
|
11,740 |
|
|
|
11,740 |
|
|
Microsystems Holding Company, LLC |
|
Software |
|
Senior Secured |
|
July 2022 |
|
Interest rate 3-month LIBOR + 8.25% or Floor rate of 9.25% |
|
$ |
12,000 |
|
|
|
11,821 |
|
|
|
11,821 |
|
|
OneLogin, Inc. (14)(15) |
|
Software |
|
Senior Secured |
|
August 2019 |
|
Interest rate PRIME + 6.45% or Floor rate of 9.95%, PIK Interest 3.25% |
|
$ |
15,883 |
|
|
|
15,811 |
|
|
|
16,071 |
|
|
PerfectServe, Inc. |
|
Software |
|
Senior Secured |
|
April 2021 |
|
Interest rate 3-month LIBOR + 9.00% or Floor rate of 10.00%, 2.50% Exit Fee |
|
$ |
16,000 |
|
|
|
16,023 |
|
|
|
16,023 |
|
|
|
|
Software |
|
Senior Secured |
|
April 2021 |
|
Interest rate 3-month LIBOR + 9.00% or Floor rate of 10.00%, 2.50% Exit Fee |
|
$ |
4,000 |
|
|
|
4,005 |
|
|
|
4,005 |
|
|
Total PerfectServe, Inc. |
|
|
|
|
|
|
|
$ |
20,000 |
|
|
|
20,028 |
|
|
|
20,028 |
|
||
|
Pollen, Inc. (15) |
|
Software |
|
Senior Secured |
|
April 2019 |
|
Interest rate PRIME + 4.25% or Floor rate of 8.50%, 4.00% Exit Fee |
|
$ |
7,000 |
|
|
|
6,964 |
|
|
|
6,964 |
|
|
Poplicus, Inc. (8)(14) |
|
Software |
|
Senior Secured |
|
May 2022 |
|
Interest rate FIXED 6.00%, PIK Interest 3.00% |
|
$ |
1,250 |
|
|
|
1,250 |
|
|
|
— |
|
|
Quid, Inc. (14)(15) |
|
Software |
|
Senior Secured |
|
October 2019 |
|
Interest rate PRIME + 4.75% or Floor rate of 8.25%, PIK Interest 2.25%, 3.00% Exit Fee |
|
$ |
8,303 |
|
|
|
8,397 |
|
|
|
8,430 |
|
|
RapidMiner, Inc. (14) |
|
Software |
|
Senior Secured |
|
December 2020 |
|
Interest rate PRIME + 5.50% or Floor rate of 9.75%, PIK Interest 1.65% |
|
$ |
7,001 |
|
|
|
6,971 |
|
|
|
6,971 |
|
|
Regent Education (14) |
|
Software |
|
Senior Secured |
|
January 2021 |
|
Interest rate FIXED 10.00%, PIK Interest 2.00%, 6.35% Exit Fee |
|
$ |
3,285 |
|
|
|
3,291 |
|
|
|
3,291 |
|
|
Signpost, Inc. (14) |
|
Software |
|
Senior Secured |
|
February 2020 |
|
Interest rate PRIME + 4.15% or Floor rate of 8.15%, PIK Interest 1.75%, 3.75% Exit Fee |
|
$ |
15,510 |
|
|
|
15,603 |
|
|
|
15,685 |
|
|
Vela Trading Technologies |
|
Software |
|
Senior Secured |
|
July 2022 |
|
Interest rate daily LIBOR + 9.50% or Floor rate of 10.50% |
|
$ |
20,000 |
|
|
|
19,495 |
|
|
|
19,557 |
|
|
Wrike, Inc. (14)(17) |
|
Software |
|
Senior Secured |
|
February 2021 |
|
Interest rate PRIME + 6.00% or Floor rate of 9.50%, PIK Interest 2.00%, 3.00% Exit Fee |
|
$ |
10,165 |
|
|
|
9,971 |
|
|
|
10,007 |
|
|
ZocDoc |
|
Software |
|
Senior Secured |
|
April 2021 |
|
Interest rate 3-month LIBOR + 9.50% or Floor rate of 10.50%, 1.00% Exit Fee |
|
$ |
20,000 |
|
|
|
20,011 |
|
|
|
20,011 |
|
|
|
|
Software |
|
Senior Secured |
|
November 2021 |
|
Interest rate 3-month LIBOR + 9.50% or Floor rate of 10.50%, 1.00% Exit Fee |
|
$ |
10,000 |
|
|
|
10,005 |
|
|
|
10,005 |
|
|
Total ZocDoc |
|
|
|
|
|
|
|
$ |
30,000 |
|
|
|
30,016 |
|
|
|
30,016 |
|
||
|
Subtotal: 1-5 Years Maturity |
|
|
|
|
|
|
|
|
|
|
|
|
318,782 |
|
|
|
318,219 |
|
||
|
Subtotal: Software (39.24%)* |
|
|
|
|
|
|
|
|
|
|
|
|
332,124 |
|
|
|
329,963 |
|
||
See notes to consolidated financial statements.
124
CONSOLIDATED SCHEDULE OF INVESTMENTS
December 31, 2017
(dollars in thousands)
|
Portfolio Company |
|
Sub-Industry |
|
Type of Investment (1) |
|
Maturity Date |
|
Interest Rate and Floor (2) |
|
Principal Amount |
|
|
Cost (3) |
|
|
Value (4) |
|
|||||||
|
Specialty Pharmaceuticals |
|
|
|
|
|
|
|
|
|
|
|
|
|
|
|
|
|
|
|
|
||||
|
Under 1 Year Maturity |
|
|
|
|
|
|
|
|
|
|
|
|
|
|
|
|
|
|
|
|
||||
|
Jaguar Animal Health, Inc. (11) |
|
Specialty Pharmaceuticals |
|
Senior Secured |
|
August 2018 |
|
Interest rate PRIME + 5.65% or Floor rate of 9.90%, 7.00% Exit Fee |
|
$ |
1,089 |
|
|
$ |
1,496 |
|
|
$ |
1,496 |
|
||||
|
Subtotal: Under 1 Year Maturity |
|
|
|
|
|
|
|
|
|
|
|
|
1,496 |
|
|
|
1,496 |
|
||||||
|
1-5 Years Maturity |
|
|
|
|
|
|
|
|
|
|
|
|
|
|
|
|
|
|
|
|
||||
|
Alimera Sciences, Inc. (11)(14) |
|
Specialty Pharmaceuticals |
|
Senior Secured |
|
November 2020 |
|
Interest rate PRIME + 7.50% or Floor rate of 11.00%, PIK Interest 1.00%, 4.00% Exit Fee |
|
$ |
35,398 |
|
|
|
35,517 |
|
|
|
35,517 |
|
||||
|
Subtotal: 1-5 Years Maturity |
|
|
|
|
|
|
|
|
|
|
|
|
35,517 |
|
|
|
35,517 |
|
||||||
|
Subtotal: Specialty Pharmaceuticals (4.40%)* |
|
|
|
|
|
|
|
|
|
|
|
|
37,013 |
|
|
|
37,013 |
|
||||||
|
|
|
|
|
|
|
|
|
|
|
|
|
|
|
|
|
|
|
|
|
|
||||
|
Surgical Devices |
|
|
|
|
|
|
|
|
|
|
|
|
|
|
|
|
|
|
|
|
||||
|
1-5 Years Maturity |
|
|
|
|
|
|
|
|
|
|
|
|
|
|
|
|
|
|
|
|
||||
|
Transmedics, Inc. (13) |
|
Surgical Devices |
|
Senior Secured |
|
February 2020 |
|
Interest rate PRIME + 5.30% or Floor rate of 9.55%, 6.70% Exit Fee |
|
$ |
8,500 |
|
|
|
8,756 |
|
|
|
8,757 |
|
||||
|
Subtotal: 1-5 Years Maturity |
|
|
|
|
|
|
|
|
|
|
|
|
8,756 |
|
|
|
8,757 |
|
||||||
|
Subtotal: Surgical Devices (1.04%)* |
|
|
|
|
|
|
|
|
|
|
|
|
8,756 |
|
|
|
8,757 |
|
||||||
|
|
|
|
|
|
|
|
|
|
|
|
|
|
|
|
|
|
|
|
|
|
||||
|
Sustainable and Renewable Technology |
|
|
|
|
|
|
|
|
|
|
|
|
|
|
|
|
|
|
||||||
|
Under 1 Year Maturity |
|
|
|
|
|
|
|
|
|
|
|
|
|
|
|
|
|
|
|
|
||||
|
FuelCell Energy, Inc. (12) |
|
Sustainable and Renewable Technology |
|
Senior Secured |
|
October 2018 |
|
Interest rate PRIME + 5.50% or Floor rate of 9.50%, 8.50% Exit Fee |
|
$ |
16,806 |
|
|
|
18,190 |
|
|
|
18,190 |
|
||||
|
Kinestral Technologies Inc. |
|
Sustainable and Renewable Technology |
|
Senior Secured |
|
October 2018 |
|
Interest rate 3-month LIBOR + 7.75% or Floor rate of 8.75%, 3.23% Exit Fee |
|
$ |
3,867 |
|
|
|
3,882 |
|
|
|
3,882 |
|
||||
|
Subtotal: Under 1 Year Maturity |
|
|
|
|
|
|
|
|
|
|
|
|
22,072 |
|
|
|
22,072 |
|
||||||
|
1-5 Years Maturity |
|
|
|
|
|
|
|
|
|
|
|
|
|
|
|
|
|
|
|
|
||||
|
ChargePoint Inc. |
|
Sustainable and Renewable Technology |
|
Senior Secured |
|
August 2020 |
|
Interest rate 3-month LIBOR + 8.75% or Floor rate of 9.75%, 2.00% Exit Fee |
|
$ |
19,394 |
|
|
|
19,416 |
|
|
|
19,416 |
|
||||
|
Solar Spectrum Holdings LLC (p.k.a. Sungevity, Inc.) (6) |
|
Sustainable and Renewable Technology |
|
Senior Secured |
|
August 2019 |
|
Interest rate PRIME + 8.70% or Floor rate of 12.95%, 4.50% Exit Fee |
|
$ |
14,000 |
|
|
|
13,604 |
|
|
|
13,604 |
|
||||
|
Proterra, Inc. (11)(14)(17) |
|
Sustainable and Renewable Technology |
|
Senior Secured |
|
November 2020 |
|
Interest rate PRIME + 3.70% or Floor rate of 7.95%, PIK Interest 1.75%, 5.95% Exit Fee |
|
$ |
25,036 |
|
|
|
25,997 |
|
|
|
26,097 |
|
||||
|
|
|
Sustainable and Renewable Technology |
|
Senior Secured |
|
November 2020 |
|
Interest rate PRIME + 3.70% or Floor rate of 7.95%, PIK Interest 1.75%, 7.00% Exit Fee |
|
$ |
5,007 |
|
|
|
5,173 |
|
|
|
5,190 |
|
||||
|
Total Proterra, Inc. |
|
|
|
|
|
|
|
$ |
30,043 |
|
|
|
31,170 |
|
|
|
31,287 |
|
||||||
|
Rive Technology, Inc. (15) |
|
Sustainable and Renewable Technology |
|
Senior Secured |
|
January 2019 |
|
Interest rate PRIME + 6.20% or Floor rate of 9.45%, 4.00% Exit Fee |
|
$ |
4,258 |
|
|
|
4,498 |
|
|
|
4,515 |
|
||||
|
Tendril Networks (12) |
|
Sustainable and Renewable Technology |
|
Senior Secured |
|
June 2019 |
|
Interest rate FIXED 9.25%, 8.50% Exit Fee |
|
$ |
13,156 |
|
|
|
13,863 |
|
|
|
13,845 |
|
||||
|
Subtotal: 1-5 Years Maturity |
|
|
|
|
|
|
|
|
|
|
|
|
82,551 |
|
|
|
82,667 |
|
||||||
|
Subtotal: Sustainable and Renewable Technology (12.45%)* |
|
|
|
|
|
|
|
|
|
|
104,623 |
|
|
|
104,739 |
|
||||||||
|
Total: Debt Investments (168.38%)* |
|
|
|
|
|
|
|
|
|
|
|
|
1,440,055 |
|
|
|
1,415,984 |
|
||||||
See notes to consolidated financial statements.
125
CONSOLIDATED SCHEDULE OF INVESTMENTS
December 31, 2017
(dollars in thousands)
|
Portfolio Company |
|
Sub-Industry |
|
Type of Investment (1) |
|
Series |
|
Shares |
|
|
Cost (3) |
|
|
Value (4) |
|
|||
|
Equity Investments |
|
|
|
|
|
|
|
|
|
|
|
|
|
|
|
|
|
|
|
Biotechnology Tools |
|
|
|
|
|
|
|
|
|
|
|
|
|
|
|
|
|
|
|
NuGEN Technologies, Inc. (15) |
|
Biotechnology Tools |
|
Equity |
|
Common Stock |
|
|
55,780 |
|
|
$ |
500 |
|
|
$ |
— |
|
|
Subtotal: Biotechnology Tools (0.00%)* |
|
|
|
|
|
|
|
|
|
|
500 |
|
|
|
— |
|
||
|
|
|
|
|
|
|
|
|
|
|
|
|
|
|
|
|
|
|
|
|
Communications & Networking |
|
|
|
|
|
|
|
|
|
|
|
|
|
|
|
|
|
|
|
Achilles Technology Management Co II, Inc. (7)(15) |
|
Communications & Networking |
|
Equity |
|
Common Stock |
|
|
100 |
|
|
|
3,100 |
|
|
|
242 |
|
|
GlowPoint, Inc. (4) |
|
Communications & Networking |
|
Equity |
|
Common Stock |
|
|
114,192 |
|
|
|
102 |
|
|
|
41 |
|
|
Peerless Network Holdings, Inc. |
|
Communications & Networking |
|
Equity |
|
Preferred Series A |
|
|
1,000,000 |
|
|
|
1,000 |
|
|
|
5,865 |
|
|
Subtotal: Communications & Networking (0.73%)* |
|
|
|
|
|
|
|
|
|
|
4,202 |
|
|
|
6,148 |
|
||
|
|
|
|
|
|
|
|
|
|
|
|
|
|
|
|
|
|
|
|
|
Diagnostic |
|
|
|
|
|
|
|
|
|
|
|
|
|
|
|
|
|
|
|
Singulex, Inc. |
|
Diagnostic |
|
Equity |
|
Common Stock |
|
|
937,998 |
|
|
|
750 |
|
|
|
720 |
|
|
Subtotal: Diagnostic (0.09%)* |
|
|
|
|
|
|
|
|
|
|
750 |
|
|
|
720 |
|
||
|
Drug Delivery |
|
|
|
|
|
|
|
|
|
|
|
|
|
|
|
|
|
|
|
AcelRx Pharmaceuticals, Inc. (4)(10) |
|
Drug Delivery |
|
Equity |
|
Common Stock |
|
|
54,240 |
|
|
|
108 |
|
|
|
109 |
|
|
BioQ Pharma Incorporated (15) |
|
Drug Delivery |
|
Equity |
|
Preferred Series D |
|
|
165,000 |
|
|
|
500 |
|
|
|
826 |
|
|
Edge Therapeutics, Inc. (4) |
|
Drug Delivery |
|
Equity |
|
Common Stock |
|
|
49,965 |
|
|
|
309 |
|
|
|
468 |
|
|
Neos Therapeutics, Inc. (4)(15) |
|
Drug Delivery |
|
Equity |
|
Common Stock |
|
|
125,000 |
|
|
|
1,500 |
|
|
|
1,275 |
|
|
Subtotal: Drug Delivery (0.32%)* |
|
|
|
|
|
|
|
|
|
|
2,417 |
|
|
|
2,678 |
|
||
|
|
|
|
|
|
|
|
|
|
|
|
|
|
|
|
|
|
|
|
|
Drug Discovery & Development |
|
|
|
|
|
|
|
|
|
|
|
|
|
|
|
|
|
|
|
Aveo Pharmaceuticals, Inc. (4)(10)(15) |
|
Drug Discovery & Development |
|
Equity |
|
Common Stock |
|
|
1,901,791 |
|
|
|
1,715 |
|
|
|
5,315 |
|
|
Axovant Sciences Ltd. (4)(5)(10) |
|
Drug Discovery & Development |
|
Equity |
|
Common Stock |
|
|
129,827 |
|
|
|
1,270 |
|
|
|
707 |
|
|
Cerecor, Inc. (4) |
|
Drug Discovery & Development |
|
Equity |
|
Common Stock |
|
|
119,087 |
|
|
|
1,000 |
|
|
|
381 |
|
|
Dare Biosciences, Inc. (p.k.a. Cerulean Pharma, Inc.) (4) |
|
Drug Discovery & Development |
|
Equity |
|
Common Stock |
|
|
13,550 |
|
|
|
1,000 |
|
|
|
29 |
|
|
Dicerna Pharmaceuticals, Inc. (4)(15) |
|
Drug Discovery & Development |
|
Equity |
|
Common Stock |
|
|
142,858 |
|
|
|
1,000 |
|
|
|
1,290 |
|
|
Dynavax Technologies (4)(10) |
|
Drug Discovery & Development |
|
Equity |
|
Common Stock |
|
|
20,000 |
|
|
|
550 |
|
|
|
374 |
|
|
Epirus Biopharmaceuticals, Inc. (4) |
|
Drug Discovery & Development |
|
Equity |
|
Common Stock |
|
|
200,000 |
|
|
|
1,000 |
|
|
|
— |
|
|
Genocea Biosciences, Inc. (4) |
|
Drug Discovery & Development |
|
Equity |
|
Common Stock |
|
|
223,463 |
|
|
|
2,000 |
|
|
|
259 |
|
|
Inotek Pharmaceuticals Corporation (4) |
|
Drug Discovery & Development |
|
Equity |
|
Common Stock |
|
|
3,778 |
|
|
|
1,500 |
|
|
|
10 |
|
|
Insmed, Incorporated (4) |
|
Drug Discovery & Development |
|
Equity |
|
Common Stock |
|
|
70,771 |
|
|
|
1,000 |
|
|
|
2,154 |
|
|
Melinta Therapeutics (4) |
|
Drug Discovery & Development |
|
Equity |
|
Common Stock |
|
|
43,840 |
|
|
|
2,000 |
|
|
|
693 |
|
|
Paratek Pharmaceuticals, Inc. (p.k.a. Transcept Pharmaceuticals, Inc.) (4) |
|
Drug Discovery & Development |
|
Equity |
|
Common Stock |
|
|
76,362 |
|
|
|
2,743 |
|
|
|
1,367 |
|
|
Subtotal: Drug Discovery & Development (1.50%)* |
|
|
|
|
|
|
|
|
|
|
16,778 |
|
|
|
12,579 |
|
||
|
|
|
|
|
|
|
|
|
|
|
|
|
|
|
|
|
|
|
|
|
Electronics & Computer Hardware |
|
|
|
|
|
|
|
|
|
|
|
|
|
|
|
|
|
|
|
Identiv, Inc. (4) |
|
Electronics & Computer Hardware |
|
Equity |
|
Common Stock |
|
|
6,700 |
|
|
|
34 |
|
|
|
22 |
|
|
Subtotal: Electronics & Computer Hardware (0.00%)* |
|
|
|
|
|
|
|
|
|
|
34 |
|
|
|
22 |
|
||
|
|
|
|
|
|
|
|
|
|
|
|
|
|
|
|
|
|
|
|
|
Information Services |
|
|
|
|
|
|
|
|
|
|
|
|
|
|
|
|
|
|
|
DocuSign, Inc. |
|
Information Services |
|
Equity |
|
Common Stock |
|
|
385,000 |
|
|
|
6,081 |
|
|
|
8,011 |
|
|
Subtotal: Information Services (0.95%)* |
|
|
|
|
|
|
|
|
|
|
6,081 |
|
|
|
8,011 |
|
||
See notes to consolidated financial statements.
126
CONSOLIDATED SCHEDULE OF INVESTMENTS
December 31, 2017
(dollars in thousands)
|
Portfolio Company |
|
Sub-Industry |
|
Type of Investment (1) |
|
Series |
|
Shares |
|
|
Cost (3) |
|
|
Value (4) |
|
|||
|
Internet Consumer & Business Services |
|
|
|
|
|
|
|
|
|
|
|
|
|
|
|
|
|
|
|
Blurb, Inc. (15) |
|
Internet Consumer & Business Services |
|
Equity |
|
Preferred Series B |
|
|
220,653 |
|
|
$ |
175 |
|
|
$ |
46 |
|
|
Brigade Group, Inc. (p.k.a. Philotic, Inc.) |
|
Internet Consumer & Business Services |
|
Equity |
|
Common Stock |
|
|
9,023 |
|
|
|
93 |
|
|
|
— |
|
|
Lightspeed POS, Inc. (5)(10) |
|
Internet Consumer & Business Services |
|
Equity |
|
Preferred Series C |
|
|
230,030 |
|
|
|
250 |
|
|
|
233 |
|
|
|
|
Internet Consumer & Business Services |
|
Equity |
|
Preferred Series D |
|
|
198,677 |
|
|
|
250 |
|
|
|
213 |
|
|
Total Lightspeed POS, Inc. |
|
|
|
|
|
|
|
|
428,707 |
|
|
|
500 |
|
|
|
446 |
|
|
OfferUp, Inc. |
|
Internet Consumer & Business Services |
|
Equity |
|
Preferred Series A |
|
|
286,080 |
|
|
|
1,663 |
|
|
|
2,236 |
|
|
|
|
Internet Consumer & Business Services |
|
Equity |
|
Preferred Series A-1 |
|
|
108,710 |
|
|
|
632 |
|
|
|
850 |
|
|
Total OfferUp, Inc. |
|
|
394,790 |
|
|
|
2,295 |
|
|
|
3,086 |
|
||||||
|
Oportun (p.k.a. Progress Financial) |
|
Internet Consumer & Business Services |
|
Equity |
|
Preferred Series G |
|
|
218,351 |
|
|
|
250 |
|
|
|
451 |
|
|
|
|
Internet Consumer & Business Services |
|
Equity |
|
Preferred Series H |
|
|
87,802 |
|
|
|
250 |
|
|
|
255 |
|
|
Total Oportun (p.k.a. Progress Financial) |
|
|
306,153 |
|
|
|
500 |
|
|
|
706 |
|
||||||
|
RazorGator Interactive Group, Inc. |
|
Internet Consumer & Business Services |
|
Equity |
|
Preferred Series AA |
|
|
34,783 |
|
|
|
15 |
|
|
|
49 |
|
|
Tectura Corporation (7) |
|
Internet Consumer & Business Services |
|
Equity |
|
Preferred Series BB |
|
|
1,000,000 |
|
|
|
— |
|
|
|
— |
|
|
Subtotal: Internet Consumer & Business Services (0.52%)* |
|
|
|
|
|
|
|
|
|
|
3,578 |
|
|
|
4,333 |
|
||
|
|
|
|
|
|
|
|
|
|
|
|
|
|
|
|
|
|
|
|
|
Media/Content/Info |
|
|
|
|
|
|
|
|
|
|
|
|
|
|
|
|
|
|
|
Pinterest, Inc. |
|
Media/Content/Info |
|
Equity |
|
Preferred Series Seed |
|
|
620,000 |
|
|
|
4,085 |
|
|
|
5,055 |
|
|
Subtotal: Media/Content/Info (0.60%)* |
|
|
|
|
|
|
|
|
|
|
4,085 |
|
|
|
5,055 |
|
||
|
|
|
|
|
|
|
|
|
|
|
|
|
|
|
|
|
|
|
|
|
Medical Devices & Equipment |
|
|
|
|
|
|
|
|
|
|
|
|
|
|
|
|
|
|
|
AtriCure, Inc. (4)(15) |
|
Medical Devices & Equipment |
|
Equity |
|
Common Stock |
|
|
7,536 |
|
|
|
266 |
|
|
|
138 |
|
|
Flowonix Medical Incorporated |
|
Medical Devices & Equipment |
|
Equity |
|
Preferred Series AA |
|
|
221,893 |
|
|
|
1,500 |
|
|
|
— |
|
|
Gelesis, Inc. (15) |
|
Medical Devices & Equipment |
|
Equity |
|
Common Stock |
|
|
198,202 |
|
|
|
— |
|
|
|
879 |
|
|
|
|
Medical Devices & Equipment |
|
Equity |
|
Preferred Series A-1 |
|
|
191,210 |
|
|
|
425 |
|
|
|
939 |
|
|
|
|
Medical Devices & Equipment |
|
Equity |
|
Preferred Series A-2 |
|
|
191,626 |
|
|
|
500 |
|
|
|
894 |
|
|
Total Gelesis, Inc. |
|
|
581,038 |
|
|
|
925 |
|
|
|
2,712 |
|
||||||
|
Medrobotics Corporation (15) |
|
Medical Devices & Equipment |
|
Equity |
|
Preferred Series E |
|
|
136,798 |
|
|
|
250 |
|
|
|
302 |
|
|
|
|
Medical Devices & Equipment |
|
Equity |
|
Preferred Series F |
|
|
73,971 |
|
|
|
155 |
|
|
|
225 |
|
|
|
|
Medical Devices & Equipment |
|
Equity |
|
Preferred Series G |
|
|
163,934 |
|
|
|
500 |
|
|
|
532 |
|
|
Total Medrobotics Corporation |
|
|
374,703 |
|
|
|
905 |
|
|
|
1,059 |
|
||||||
|
Optiscan Biomedical, Corp. (6)(15) |
|
Medical Devices & Equipment |
|
Equity |
|
Preferred Series B |
|
|
6,185,567 |
|
|
|
3,000 |
|
|
|
402 |
|
|
|
|
Medical Devices & Equipment |
|
Equity |
|
Preferred Series C |
|
|
1,927,309 |
|
|
|
655 |
|
|
|
114 |
|
|
|
|
Medical Devices & Equipment |
|
Equity |
|
Preferred Series D |
|
|
55,103,923 |
|
|
|
5,257 |
|
|
|
4,232 |
|
|
|
|
Medical Devices & Equipment |
|
Equity |
|
Preferred Series E |
|
|
15,638,888 |
|
|
|
1,307 |
|
|
|
1,457 |
|
|
Total Optiscan Biomedical, Corp. |
|
|
78,855,687 |
|
|
|
10,219 |
|
|
|
6,205 |
|
||||||
|
Outset Medical, Inc. (p.k.a. Home Dialysis Plus, Inc.) |
|
Medical Devices & Equipment |
|
Equity |
|
Preferred Series B |
|
|
232,061 |
|
|
|
527 |
|
|
|
596 |
|
|
Quanterix Corporation (4) |
|
Medical Devices & Equipment |
|
Equity |
|
Common Stock |
|
|
84,778 |
|
|
|
1,000 |
|
|
|
1,820 |
|
|
Subtotal: Medical Devices & Equipment (1.49%)* |
|
|
|
|
|
|
|
|
|
|
15,342 |
|
|
|
12,530 |
|
||
|
|
|
|
|
|
|
|
|
|
|
|
|
|
|
|
|
|
|
|
|
Software |
|
|
|
|
|
|
|
|
|
|
|
|
|
|
|
|
|
|
|
CapLinked, Inc. |
|
Software |
|
Equity |
|
Preferred Series A-3 |
|
|
53,614 |
|
|
|
51 |
|
|
|
90 |
|
|
Druva, Inc. |
|
Software |
|
Equity |
|
Preferred Series 2 |
|
|
458,841 |
|
|
|
1,000 |
|
|
|
1,044 |
|
|
|
|
Software |
|
Equity |
|
Preferred Series 3 |
|
|
93,620 |
|
|
|
300 |
|
|
|
312 |
|
|
Total Druva, Inc. |
|
|
552,461 |
|
|
|
1,300 |
|
|
|
1,356 |
|
||||||
|
ForeScout Technologies, Inc. (4) |
|
Software |
|
Equity |
|
Common Stock |
|
|
199,844 |
|
|
|
529 |
|
|
|
6,373 |
|
|
HighRoads, Inc. |
|
Software |
|
Equity |
|
Common Stock |
|
|
190 |
|
|
|
307 |
|
|
|
— |
|
|
NewVoiceMedia Limited (5)(10) |
|
Software |
|
Equity |
|
Preferred Series E |
|
|
669,173 |
|
|
|
963 |
|
|
|
1,544 |
|
|
Palantir Technologies |
|
Software |
|
Equity |
|
Preferred Series E |
|
|
727,696 |
|
|
|
5,431 |
|
|
|
4,923 |
|
|
|
|
Software |
|
Equity |
|
Preferred Series G |
|
|
326,797 |
|
|
|
2,211 |
|
|
|
2,211 |
|
|
Total Palantir Technologies |
|
|
1,054,493 |
|
|
|
7,642 |
|
|
|
7,134 |
|
||||||
|
Sprinklr, Inc. |
|
Software |
|
Equity |
|
Common Stock |
|
|
700,000 |
|
|
|
3,749 |
|
|
|
4,600 |
|
|
WildTangent, Inc. (15) |
|
Software |
|
Equity |
|
Preferred Series 3 |
|
|
100,000 |
|
|
|
402 |
|
|
|
179 |
|
|
Subtotal: Software (2.53%)* |
|
|
|
|
|
|
|
|
|
|
|
|
14,943 |
|
|
|
21,276 |
|
See notes to consolidated financial statements.
127
HERCULES CAPITAL, INC.
CONSOLIDATED SCHEDULE OF INVESTMENTS
December 31, 2017
(dollars in thousands)
|
Portfolio Company |
|
Sub-Industry |
|
Type of Investment (1) |
|
Series |
|
Shares |
|
|
Cost (3) |
|
|
Value (4) |
|
|||
|
Surgical Devices |
|
|
|
|
|
|
|
|
|
|
|
|
|
|
|
|
|
|
|
Gynesonics, Inc. (15) |
|
Surgical Devices |
|
Equity |
|
Preferred Series B |
|
|
219,298 |
|
|
$ |
250 |
|
|
$ |
44 |
|
|
|
|
Surgical Devices |
|
Equity |
|
Preferred Series C |
|
|
656,538 |
|
|
|
282 |
|
|
|
60 |
|
|
|
|
Surgical Devices |
|
Equity |
|
Preferred Series D |
|
|
1,991,157 |
|
|
|
712 |
|
|
|
795 |
|
|
|
|
Surgical Devices |
|
Equity |
|
Preferred Series E |
|
|
2,786,367 |
|
|
|
429 |
|
|
|
521 |
|
|
Total Gynesonics, Inc. |
|
|
5,653,360 |
|
|
|
1,673 |
|
|
|
1,420 |
|
||||||
|
Transmedics, Inc. |
|
Surgical Devices |
|
Equity |
|
Preferred Series B |
|
|
88,961 |
|
|
|
1,100 |
|
|
|
376 |
|
|
|
|
Surgical Devices |
|
Equity |
|
Preferred Series C |
|
|
119,999 |
|
|
|
300 |
|
|
|
309 |
|
|
|
|
Surgical Devices |
|
Equity |
|
Preferred Series D |
|
|
260,000 |
|
|
|
650 |
|
|
|
957 |
|
|
|
|
Surgical Devices |
|
Equity |
|
Preferred Series F |
|
|
100,200 |
|
|
|
500 |
|
|
|
531 |
|
|
Total Transmedics, Inc. |
|
|
569,160 |
|
|
|
2,550 |
|
|
|
2,173 |
|
||||||
|
Subtotal: Surgical Devices (0.43%)* |
|
|
|
|
|
|
|
|
|
|
4,223 |
|
|
|
3,593 |
|
||
|
|
|
|
|
|
|
|
|
|
|
|
|
|
|
|
|
|
|
|
|
Sustainable and Renewable Technology |
|
|
|
|
|
|
|
|
|
|
|
|
|
|
|
|
|
|
|
Flywheel Building Intelligence, Inc. (p.k.a. SCIEnergy, Inc.) |
|
Sustainable and Renewable Technology |
|
Equity |
|
Common Stock |
|
|
19,250 |
|
|
|
761 |
|
|
|
— |
|
|
Modumetal, Inc. |
|
Sustainable and Renewable Technology |
|
Equity |
|
Preferred Series C |
|
|
3,107,520 |
|
|
|
500 |
|
|
|
477 |
|
|
Proterra, Inc. |
|
Sustainable and Renewable Technology |
|
Equity |
|
Preferred Series 5 |
|
|
99,280 |
|
|
|
500 |
|
|
|
539 |
|
|
Solar Spectrum Holdings LLC (p.k.a. Sungevity, Inc.) (6) |
|
Sustainable and Renewable Technology |
|
Equity |
|
Common Stock |
|
|
288 |
|
|
|
61,502 |
|
|
|
11,400 |
|
|
Subtotal: Sustainable and Renewable Technology (1.48%)* |
|
|
|
|
|
|
|
|
|
|
63,263 |
|
|
|
12,416 |
|
||
|
Total: Equity Investments (10.63%)* |
|
|
|
|
|
|
136,196 |
|
|
|
89,361 |
|
||||||
See notes to consolidated financial statements.
128
CONSOLIDATED SCHEDULE OF INVESTMENTS
December 31, 2017
(dollars in thousands)
|
Portfolio Company |
|
Sub-Industry |
|
Type of Investment (1) |
|
Series |
|
Shares |
|
|
Cost (3) |
|
|
Value (4) |
|
|||
|
Warrant Investments |
|
|
|
|
|
|
|
|
|
|
|
|
|
|
|
|
|
|
|
Biotechnology Tools |
|
|
|
|
|
|
|
|
|
|
|
|
|
|
|
|
|
|
|
Labcyte, Inc. (15) |
|
Biotechnology Tools |
|
Warrant |
|
Preferred Series C |
|
|
1,127,624 |
|
|
$ |
323 |
|
|
$ |
458 |
|
|
Subtotal: Biotechnology Tools (0.05%)* |
|
|
|
|
|
|
|
|
|
|
323 |
|
|
|
458 |
|
||
|
Communications & Networking |
|
|
|
|
|
|
|
|
|
|
|
|
|
|
|
|
|
|
|
PeerApp, Inc. |
|
Communications & Networking |
|
Warrant |
|
Preferred Series B |
|
|
298,779 |
|
|
|
61 |
|
|
|
— |
|
|
Peerless Network Holdings, Inc. |
|
Communications & Networking |
|
Warrant |
|
Preferred Series A |
|
|
135,000 |
|
|
|
95 |
|
|
|
501 |
|
|
Spring Mobile Solutions, Inc. |
|
Communications & Networking |
|
Warrant |
|
Common Stock |
|
|
2,834,375 |
|
|
|
418 |
|
|
|
— |
|
|
Subtotal: Communications & Networking (0.06%)* |
|
|
|
|
|
|
|
|
|
|
574 |
|
|
|
501 |
|
||
|
|
|
|
|
|
|
|
|
|
|
|
|
|
|
|
|
|
|
|
|
Consumer & Business Products |
|
|
|
|
|
|
|
|
|
|
|
|
|
|
|
|
|
|
|
Antenna79 (p.k.a. Pong Research Corporation) (15) |
|
Consumer & Business Products |
|
Warrant |
|
Common Stock |
|
|
1,662,441 |
|
|
|
228 |
|
|
|
— |
|
|
Intelligent Beauty, Inc. (15) |
|
Consumer & Business Products |
|
Warrant |
|
Preferred Series B |
|
|
190,234 |
|
|
|
230 |
|
|
|
221 |
|
|
The Neat Company (15) |
|
Consumer & Business Products |
|
Warrant |
|
Preferred Series C-1 |
|
|
540,540 |
|
|
|
365 |
|
|
|
— |
|
|
Subtotal: Consumer & Business Products (0.03%)* |
|
|
|
|
|
|
|
|
|
|
823 |
|
|
|
221 |
|
||
|
|
|
|
|
|
|
|
|
|
|
|
|
|
|
|
|
|
|
|
|
Drug Delivery |
|
|
|
|
|
|
|
|
|
|
|
|
|
|
|
|
|
|
|
AcelRx Pharmaceuticals, Inc. (4)(10)(15) |
|
Drug Delivery |
|
Warrant |
|
Common Stock |
|
|
176,730 |
|
|
|
786 |
|
|
|
61 |
|
|
Agile Therapeutics, Inc. (4) |
|
Drug Delivery |
|
Warrant |
|
Common Stock |
|
|
180,274 |
|
|
|
730 |
|
|
|
65 |
|
|
BioQ Pharma Incorporated |
|
Drug Delivery |
|
Warrant |
|
Common Stock |
|
|
459,183 |
|
|
|
1 |
|
|
|
968 |
|
|
Celsion Corporation (4) |
|
Drug Delivery |
|
Warrant |
|
Common Stock |
|
|
13,927 |
|
|
|
428 |
|
|
|
— |
|
|
Dance Biopharm, Inc. (15) |
|
Drug Delivery |
|
Warrant |
|
Common Stock |
|
|
110,882 |
|
|
|
74 |
|
|
|
— |
|
|
Edge Therapeutics, Inc. (4) |
|
Drug Delivery |
|
Warrant |
|
Common Stock |
|
|
78,595 |
|
|
|
390 |
|
|
|
230 |
|
|
Kaleo, Inc. (p.k.a. Intelliject, Inc.) |
|
Drug Delivery |
|
Warrant |
|
Preferred Series B |
|
|
82,500 |
|
|
|
594 |
|
|
|
1,540 |
|
|
Neos Therapeutics, Inc. (4)(15) |
|
Drug Delivery |
|
Warrant |
|
Common Stock |
|
|
70,833 |
|
|
|
285 |
|
|
|
148 |
|
|
Pulmatrix Inc. (4) |
|
Drug Delivery |
|
Warrant |
|
Common Stock |
|
|
25,150 |
|
|
|
116 |
|
|
|
4 |
|
|
ZP Opco, Inc (p.k.a. Zosano Pharma) (4) |
|
Drug Delivery |
|
Warrant |
|
Common Stock |
|
|
72,379 |
|
|
|
266 |
|
|
|
— |
|
|
Subtotal: Drug Delivery (0.36%)* |
|
|
|
|
|
|
|
|
|
|
3,670 |
|
|
|
3,016 |
|
||
See notes to consolidated financial statements.
129
CONSOLIDATED SCHEDULE OF INVESTMENTS
December 31, 2017
(dollars in thousands)
|
Portfolio Company |
|
Sub-Industry |
|
Type of Investment (1) |
|
Series |
|
Shares |
|
|
Cost (3) |
|
|
Value (4) |
|
|||
|
Drug Discovery & Development |
|
|
|
|
|
|
|
|
|
|
|
|
|
|
|
|
|
|
|
ADMA Biologics, Inc. (4) |
|
Drug Discovery & Development |
|
Warrant |
|
Common Stock |
|
|
89,750 |
|
|
$ |
295 |
|
|
$ |
12 |
|
|
Anthera Pharmaceuticals, Inc. (4)(15) |
|
Drug Discovery & Development |
|
Warrant |
|
Common Stock |
|
|
5,022 |
|
|
|
984 |
|
|
|
— |
|
|
Audentes Therapeutics, Inc (4)(10)(15) |
|
Drug Discovery & Development |
|
Warrant |
|
Common Stock |
|
|
9,914 |
|
|
|
62 |
|
|
|
147 |
|
|
Auris Medical Holding, AG (4)(5)(10) |
|
Drug Discovery & Development |
|
Warrant |
|
Common Stock |
|
|
156,726 |
|
|
|
249 |
|
|
|
19 |
|
|
Brickell Biotech, Inc. |
|
Drug Discovery & Development |
|
Warrant |
|
Preferred Series C |
|
|
26,086 |
|
|
|
119 |
|
|
|
93 |
|
|
Cerecor, Inc. (4) |
|
Drug Discovery & Development |
|
Warrant |
|
Common Stock |
|
|
22,328 |
|
|
|
70 |
|
|
|
15 |
|
|
Chroma Therapeutics, Ltd. (5)(10) |
|
Drug Discovery & Development |
|
Warrant |
|
Preferred Series D |
|
|
325,261 |
|
|
|
490 |
|
|
|
— |
|
|
Cleveland BioLabs, Inc. (4)(15) |
|
Drug Discovery & Development |
|
Warrant |
|
Common Stock |
|
|
7,813 |
|
|
|
105 |
|
|
|
3 |
|
|
Concert Pharmaceuticals, Inc. (4)(15) |
|
Drug Discovery & Development |
|
Warrant |
|
Common Stock |
|
|
132,069 |
|
|
|
545 |
|
|
|
1,344 |
|
|
CTI BioPharma Corp. (p.k.a. Cell Therapeutics, Inc.) (4) |
|
Drug Discovery & Development |
|
Warrant |
|
Common Stock |
|
|
29,239 |
|
|
|
165 |
|
|
|
2 |
|
|
CytRx Corporation (4)(15) |
|
Drug Discovery & Development |
|
Warrant |
|
Common Stock |
|
|
105,694 |
|
|
|
160 |
|
|
|
58 |
|
|
Dare Biosciences, Inc. (p.k.a. Cerulean Pharma, Inc.) (4) |
|
Drug Discovery & Development |
|
Warrant |
|
Common Stock |
|
|
17,190 |
|
|
|
369 |
|
|
|
— |
|
|
Dicerna Pharmaceuticals, Inc. (4)(15) |
|
Drug Discovery & Development |
|
Warrant |
|
Common Stock |
|
|
200 |
|
|
|
28 |
|
|
|
— |
|
|
Epirus Biopharmaceuticals, Inc. (4) |
|
Drug Discovery & Development |
|
Warrant |
|
Common Stock |
|
|
64,194 |
|
|
|
276 |
|
|
|
— |
|
|
Fortress Biotech, Inc. (p.k.a. Coronado Biosciences, Inc.) (4) |
|
Drug Discovery & Development |
|
Warrant |
|
Common Stock |
|
|
73,009 |
|
|
|
142 |
|
|
|
29 |
|
|
Genocea Biosciences, Inc. (4) |
|
Drug Discovery & Development |
|
Warrant |
|
Common Stock |
|
|
73,725 |
|
|
|
266 |
|
|
|
4 |
|
|
Immune Pharmaceuticals (4) |
|
Drug Discovery & Development |
|
Warrant |
|
Common Stock |
|
|
10,742 |
|
|
|
164 |
|
|
|
— |
|
|
Melinta Therapeutics (4) |
|
Drug Discovery & Development |
|
Warrant |
|
Common Stock |
|
|
31,655 |
|
|
|
626 |
|
|
|
12 |
|
|
Motif BioSciences Inc. (4)(15) |
|
Drug Discovery & Development |
|
Warrant |
|
Common Stock |
|
|
73,452 |
|
|
|
282 |
|
|
|
414 |
|
|
Myovant Sciences, Ltd. (4)(5)(10) |
|
Drug Discovery & Development |
|
Warrant |
|
Common Stock |
|
|
49,800 |
|
|
|
283 |
|
|
|
128 |
|
|
Neothetics, Inc. (p.k.a. Lithera, Inc) (4)(15) |
|
Drug Discovery & Development |
|
Warrant |
|
Common Stock |
|
|
46,838 |
|
|
|
266 |
|
|
|
53 |
|
|
Neuralstem, Inc. (4)(15) |
|
Drug Discovery & Development |
|
Warrant |
|
Common Stock |
|
|
5,783 |
|
|
|
77 |
|
|
|
— |
|
|
Ology Bioservices, Inc. (p.k.a. Nanotherapeutics, Inc.) (15) |
|
Drug Discovery & Development |
|
Warrant |
|
Common Stock |
|
|
171,389 |
|
|
|
838 |
|
|
|
— |
|
|
Paratek Pharmaceuticals, Inc. (p.k.a. Transcept Pharmaceuticals, Inc.) (4)(15) |
|
Drug Discovery & Development |
|
Warrant |
|
Common Stock |
|
|
75,214 |
|
|
|
178 |
|
|
|
212 |
|
|
PhaseRx, Inc. (4)(15) |
|
Drug Discovery & Development |
|
Warrant |
|
Common Stock |
|
|
63,000 |
|
|
|
125 |
|
|
|
— |
|
|
Savara Inc. (p.k.a. Mast Therapeutics, Inc.) (4)(15) |
|
Drug Discovery & Development |
|
Warrant |
|
Common Stock |
|
|
32,467 |
|
|
|
203 |
|
|
|
8 |
|
|
Sorrento Therapeutics, Inc. (4)(10) |
|
Drug Discovery & Development |
|
Warrant |
|
Common Stock |
|
|
306,748 |
|
|
|
889 |
|
|
|
453 |
|
|
Stealth Bio Therapeutics Corp. (5)(10) |
|
Drug Discovery & Development |
|
Warrant |
|
Preferred Series A |
|
|
487,500 |
|
|
|
116 |
|
|
|
107 |
|
|
uniQure B.V. (4)(5)(10) |
|
Drug Discovery & Development |
|
Warrant |
|
Common Stock |
|
|
37,174 |
|
|
|
218 |
|
|
|
240 |
|
|
XOMA Corporation (4)(10)(15) |
|
Drug Discovery & Development |
|
Warrant |
|
Common Stock |
|
|
9,063 |
|
|
|
279 |
|
|
|
50 |
|
|
Subtotal: Drug Discovery & Development (0.40%)* |
|
|
|
|
|
|
|
|
|
|
8,869 |
|
|
|
3,403 |
|
||
|
|
|
|
|
|
|
|
|
|
|
|
|
|
|
|
|
|
|
|
|
Electronics & Computer Hardware |
|
|
|
|
|
|
|
|
|
|
|
|
|
|
|
|
|
|
|
908 DEVICES INC. (15) |
|
Electronics & Computer Hardware |
|
Warrant |
|
Preferred Series D |
|
|
79,856 |
|
|
|
100 |
|
|
|
73 |
|
|
Clustrix, Inc. |
|
Electronics & Computer Hardware |
|
Warrant |
|
Common Stock |
|
|
50,000 |
|
|
|
12 |
|
|
|
— |
|
|
Subtotal: Electronics & Computer Hardware (0.01%)* |
|
|
|
|
|
|
|
|
|
|
112 |
|
|
|
73 |
|
||
|
|
|
|
|
|
|
|
|
|
|
|
|
|
|
|
|
|
|
|
|
Healthcare Services, Other |
|
|
|
|
|
|
|
|
|
|
|
|
|
|
|
|
|
|
|
Chromadex Corporation (4)(15) |
|
Healthcare Services, Other |
|
Warrant |
|
Common Stock |
|
|
139,673 |
|
|
|
157 |
|
|
|
329 |
|
|
Subtotal: Healthcare Services, Other (0.04%)* |
|
|
|
|
|
|
|
|
|
|
157 |
|
|
|
329 |
|
||
See notes to consolidated financial statements.
130
CONSOLIDATED SCHEDULE OF INVESTMENTS
December 31, 2017
(dollars in thousands)
|
Portfolio Company |
|
Sub-Industry |
|
Type of Investment (1) |
|
Series |
|
Shares |
|
|
Cost (3) |
|
|
Value (4) |
|
|||
|
Information Services |
|
|
|
|
|
|
|
|
|
|
|
|
|
|
|
|
|
|
|
INMOBI Inc. (5)(10) |
|
Information Services |
|
Warrant |
|
Common Stock |
|
|
65,587 |
|
|
$ |
82 |
|
|
$ |
— |
|
|
InXpo, Inc. (15) |
|
Information Services |
|
Warrant |
|
Preferred Series C |
|
|
648,400 |
|
|
|
98 |
|
|
|
21 |
|
|
|
|
Information Services |
|
Warrant |
|
Preferred Series C-1 |
|
|
1,165,183 |
|
|
|
74 |
|
|
|
37 |
|
|
Total InXpo, Inc. |
|
|
1,813,583 |
|
|
|
172 |
|
|
|
58 |
|
||||||
|
MDX Medical, Inc. (15) |
|
Information Services |
|
Warrant |
|
Common Stock |
|
|
2,250,000 |
|
|
|
246 |
|
|
|
129 |
|
|
Netbase Solutions, Inc. |
|
Information Services |
|
Warrant |
|
Preferred Series 1 |
|
|
60,000 |
|
|
|
356 |
|
|
|
363 |
|
|
RichRelevance, Inc. (15) |
|
Information Services |
|
Warrant |
|
Preferred Series E |
|
|
112,612 |
|
|
|
98 |
|
|
|
— |
|
|
Subtotal: Information Services (0.07%)* |
|
|
|
|
|
|
|
|
|
|
954 |
|
|
|
550 |
|
||
|
|
|
|
|
|
|
|
|
|
|
|
|
|
|
|
|
|
|
|
|
Internet Consumer & Business Services |
|
|
|
|
|
|
|
|
|
|
|
|
|
|
|
|
|
|
|
Aria Systems, Inc. |
|
Internet Consumer & Business Services |
|
Warrant |
|
Preferred Series G |
|
|
231,535 |
|
|
|
73 |
|
|
|
— |
|
|
Blurb, Inc. (15) |
|
Internet Consumer & Business Services |
|
Warrant |
|
Preferred Series C |
|
|
234,280 |
|
|
|
636 |
|
|
|
9 |
|
|
ClearObject, Inc. (p.k.a. CloudOne, Inc.) |
|
Internet Consumer & Business Services |
|
Warrant |
|
Preferred Series E |
|
|
968,992 |
|
|
|
18 |
|
|
|
154 |
|
|
The Faction Group |
|
Internet Consumer & Business Services |
|
Warrant |
|
Preferred Series A |
|
|
8,703 |
|
|
|
234 |
|
|
|
234 |
|
|
Intent Media, Inc. (15) |
|
Internet Consumer & Business Services |
|
Warrant |
|
Common Stock |
|
|
140,077 |
|
|
|
168 |
|
|
|
207 |
|
|
Interactions Corporation |
|
Internet Consumer & Business Services |
|
Warrant |
|
Preferred Series G-3 |
|
|
68,187 |
|
|
|
204 |
|
|
|
204 |
|
|
Just Fabulous, Inc. |
|
Internet Consumer & Business Services |
|
Warrant |
|
Preferred Series B |
|
|
206,184 |
|
|
|
1,102 |
|
|
|
2,627 |
|
|
Lightspeed POS, Inc. (5)(10) |
|
Internet Consumer & Business Services |
|
Warrant |
|
Preferred Series C |
|
|
245,610 |
|
|
|
20 |
|
|
|
93 |
|
|
LogicSource (15) |
|
Internet Consumer & Business Services |
|
Warrant |
|
Preferred Series C |
|
|
79,625 |
|
|
|
30 |
|
|
|
36 |
|
|
Oportun (p.k.a. Progress Financial) |
|
Internet Consumer & Business Services |
|
Warrant |
|
Preferred Series G |
|
|
174,562 |
|
|
|
78 |
|
|
|
196 |
|
|
ShareThis, Inc. (15) |
|
Internet Consumer & Business Services |
|
Warrant |
|
Preferred Series C |
|
|
493,502 |
|
|
|
547 |
|
|
|
— |
|
|
Snagajob.com, Inc. |
|
Internet Consumer & Business Services |
|
Warrant |
|
Preferred Series A |
|
|
1,800,000 |
|
|
|
782 |
|
|
|
1,257 |
|
|
Tapjoy, Inc. |
|
Internet Consumer & Business Services |
|
Warrant |
|
Preferred Series D |
|
|
748,670 |
|
|
|
316 |
|
|
|
7 |
|
|
TraceLink, Inc. |
|
Internet Consumer & Business Services |
|
Warrant |
|
Preferred Series A-2 |
|
|
283,353 |
|
|
|
1,833 |
|
|
|
1,833 |
|
|
Subtotal: Internet Consumer & Business Services (0.82%)* |
|
|
|
|
|
|
|
|
|
|
6,041 |
|
|
|
6,857 |
|
||
|
|
|
|
|
|
|
|
|
|
|
|
|
|
|
|
|
|
|
|
|
Media/Content/Info |
|
|
|
|
|
|
|
|
|
|
|
|
|
|
|
|
|
|
|
FanDuel, Inc. |
|
Media/Content/Info |
|
Warrant |
|
Common Stock |
|
|
15,570 |
|
|
|
— |
|
|
|
— |
|
|
|
|
Media/Content/Info |
|
Warrant |
|
Preferred Series A |
|
|
4,648 |
|
|
|
730 |
|
|
|
1,875 |
|
|
Total FanDuel, Inc. |
|
|
20,218 |
|
|
|
730 |
|
|
|
1,875 |
|
||||||
|
Machine Zone, Inc. (16) |
|
Media/Content/Info |
|
Warrant |
|
Common Stock |
|
|
1,552,710 |
|
|
|
1,958 |
|
|
|
3,743 |
|
|
Rhapsody International, Inc. (15) |
|
Media/Content/Info |
|
Warrant |
|
Common Stock |
|
|
715,755 |
|
|
|
385 |
|
|
|
4 |
|
|
WP Technology, Inc. (Wattpad, Inc.) (5)(10) |
|
Media/Content/Info |
|
Warrant |
|
Common Stock |
|
|
255,818 |
|
|
|
4 |
|
|
|
17 |
|
|
Zoom Media Group, Inc. |
|
Media/Content/Info |
|
Warrant |
|
Preferred Series A |
|
|
1,204 |
|
|
|
348 |
|
|
|
33 |
|
|
Subtotal: Media/Content/Info (0.67%)* |
|
|
|
|
|
|
|
|
|
|
3,425 |
|
|
|
5,672 |
|
||
|
|
|
|
|
|
|
|
|
|
|
|
|
|
|
|
|
|
|
|
|
Medical Devices & Equipment |
|
|
|
|
|
|
|
|
|
|
|
|
|
|
|
|
|
|
|
Amedica Corporation (4)(15) |
|
Medical Devices & Equipment |
|
Warrant |
|
Common Stock |
|
|
8,603 |
|
|
|
459 |
|
|
|
1 |
|
|
Aspire Bariatrics, Inc. (15) |
|
Medical Devices & Equipment |
|
Warrant |
|
Preferred Series B-1 |
|
|
112,858 |
|
|
|
455 |
|
|
|
65 |
|
|
Avedro, Inc. (15) |
|
Medical Devices & Equipment |
|
Warrant |
|
Preferred Series AA |
|
|
300,000 |
|
|
|
401 |
|
|
|
275 |
|
|
Flowonix Medical Incorporated |
|
Medical Devices & Equipment |
|
Warrant |
|
Preferred Series AA |
|
|
155,325 |
|
|
|
362 |
|
|
|
— |
|
|
Gelesis, Inc. (15) |
|
Medical Devices & Equipment |
|
Warrant |
|
Preferred Series A-1 |
|
|
74,784 |
|
|
|
78 |
|
|
|
216 |
|
|
InspireMD, Inc. (4)(5)(10) |
|
Medical Devices & Equipment |
|
Warrant |
|
Common Stock |
|
|
39,364 |
|
|
|
242 |
|
|
|
— |
|
|
IntegenX, Inc. (15) |
|
Medical Devices & Equipment |
|
Warrant |
|
Preferred Series C |
|
|
547,752 |
|
|
|
15 |
|
|
|
— |
|
|
Intuity Medical, Inc. (15) |
|
Medical Devices & Equipment |
|
Warrant |
|
Preferred Series 4 |
|
|
1,819,078 |
|
|
|
294 |
|
|
|
294 |
|
|
Medrobotics Corporation (15) |
|
Medical Devices & Equipment |
|
Warrant |
|
Preferred Series E |
|
|
455,539 |
|
|
|
370 |
|
|
|
411 |
|
|
Micell Technologies, Inc. |
|
Medical Devices & Equipment |
|
Warrant |
|
Preferred Series D-2 |
|
|
84,955 |
|
|
|
262 |
|
|
|
150 |
|
|
NetBio, Inc. |
|
Medical Devices & Equipment |
|
Warrant |
|
Preferred Series A |
|
|
7,841 |
|
|
|
408 |
|
|
|
56 |
|
|
NinePoint Medical, Inc. (15) |
|
Medical Devices & Equipment |
|
Warrant |
|
Preferred Series A-1 |
|
|
587,840 |
|
|
|
170 |
|
|
|
82 |
|
|
Optiscan Biomedical, Corp. (6)(15) |
|
Medical Devices & Equipment |
|
Warrant |
|
Preferred Series D |
|
|
10,535,275 |
|
|
|
1,252 |
|
|
|
86 |
|
|
Outset Medical, Inc. (p.k.a. Home Dialysis Plus, Inc.) |
|
Medical Devices & Equipment |
|
Warrant |
|
Preferred Series A |
|
|
500,000 |
|
|
|
402 |
|
|
|
430 |
|
|
Quanterix Corporation (4) |
|
Medical Devices & Equipment |
|
Warrant |
|
Common Stock |
|
|
66,039 |
|
|
|
205 |
|
|
|
536 |
|
|
Sebacia, Inc. (15) |
|
Medical Devices & Equipment |
|
Warrant |
|
Preferred Series D |
|
|
778,301 |
|
|
|
133 |
|
|
|
127 |
|
|
SonaCare Medical, LLC (p.k.a. US HIFU, LLC) |
|
Medical Devices & Equipment |
|
Warrant |
|
Preferred Series A |
|
|
6,464 |
|
|
|
188 |
|
|
|
— |
|
|
Strata Skin Sciences, Inc. (p.k.a. MELA Sciences, Inc.) (4) |
|
Medical Devices & Equipment |
|
Warrant |
|
Common Stock |
|
|
13,864 |
|
|
|
401 |
|
|
|
— |
|
|
Tela Bio, Inc. (15) |
|
Medical Devices & Equipment |
|
Warrant |
|
Preferred Series B |
|
|
387,930 |
|
|
|
62 |
|
|
|
153 |
|
|
ViewRay, Inc. (4)(15) |
|
Medical Devices & Equipment |
|
Warrant |
|
Common Stock |
|
|
128,231 |
|
|
|
333 |
|
|
|
414 |
|
|
Subtotal: Medical Devices & Equipment (0.39%)* |
|
|
|
|
|
|
|
|
|
|
6,492 |
|
|
|
3,296 |
|
||
See notes to consolidated financial statements.
131
CONSOLIDATED SCHEDULE OF INVESTMENTS
December 31, 2017
(dollars in thousands)
|
Portfolio Company |
|
Sub-Industry |
|
Type of Investment (1) |
|
Series |
|
Shares |
|
|
Cost (3) |
|
|
Value (4) |
|
|||
|
Semiconductors |
|
|
|
|
|
|
|
|
|
|
|
|
|
|
|
|
|
|
|
Achronix Semiconductor Corporation (15) |
|
Semiconductors |
|
Warrant |
|
Preferred Series C |
|
|
360,000 |
|
|
$ |
160 |
|
|
$ |
308 |
|
|
|
|
Semiconductors |
|
Warrant |
|
Preferred Series D-2 |
|
|
750,000 |
|
|
|
99 |
|
|
|
519 |
|
|
Total Achronix Semiconductor Corporation |
|
|
1,110,000 |
|
|
|
259 |
|
|
|
827 |
|
||||||
|
Aquantia Corp. (4) |
|
Semiconductors |
|
Warrant |
|
Common Stock |
|
|
19,683 |
|
|
|
4 |
|
|
|
11 |
|
|
Avnera Corporation |
|
Semiconductors |
|
Warrant |
|
Preferred Series E |
|
|
141,567 |
|
|
|
46 |
|
|
|
195 |
|
|
Subtotal: Semiconductors (0.12%)* |
|
|
|
|
|
|
|
|
|
|
309 |
|
|
|
1,033 |
|
||
|
|
|
|
|
|
|
|
|
|
|
|
|
|
|
|
|
|
|
|
|
Software |
|
|
|
|
|
|
|
|
|
|
|
|
|
|
|
|
|
|
|
Actifio, Inc. |
|
Software |
|
Warrant |
|
Common Stock |
|
|
73,584 |
|
|
|
249 |
|
|
|
84 |
|
|
|
|
Software |
|
Warrant |
|
Preferred Series F |
|
|
31,673 |
|
|
|
343 |
|
|
|
79 |
|
|
Total Actifio, Inc. |
|
|
105,257 |
|
|
|
592 |
|
|
|
163 |
|
||||||
|
Braxton Technologies, LLC |
|
Software |
|
Warrant |
|
Preferred Series A |
|
|
168,750 |
|
|
|
188 |
|
|
|
— |
|
|
CareCloud Corporation (15) |
|
Software |
|
Warrant |
|
Preferred Series B |
|
|
413,433 |
|
|
|
258 |
|
|
|
113 |
|
|
Clickfox, Inc. (15) |
|
Software |
|
Warrant |
|
Preferred Series B |
|
|
1,038,563 |
|
|
|
330 |
|
|
|
129 |
|
|
|
|
Software |
|
Warrant |
|
Preferred Series C |
|
|
592,019 |
|
|
|
730 |
|
|
|
179 |
|
|
|
|
Software |
|
Warrant |
|
Preferred Series C-A |
|
|
2,218,214 |
|
|
|
230 |
|
|
|
4,458 |
|
|
Total Clickfox, Inc. |
|
|
3,848,796 |
|
|
|
1,290 |
|
|
|
4,766 |
|
||||||
|
DNAnexus, Inc. |
|
Software |
|
Warrant |
|
Preferred Series C |
|
|
909,091 |
|
|
|
97 |
|
|
|
97 |
|
|
Evernote Corporation (15) |
|
Software |
|
Warrant |
|
Common Stock |
|
|
62,500 |
|
|
|
106 |
|
|
|
175 |
|
|
Fuze, Inc. (15) |
|
Software |
|
Warrant |
|
Preferred Series F |
|
|
256,158 |
|
|
|
89 |
|
|
|
53 |
|
|
Mattersight Corporation (4) |
|
Software |
|
Warrant |
|
Common Stock |
|
|
357,143 |
|
|
|
538 |
|
|
|
168 |
|
|
Message Systems, Inc. (15) |
|
Software |
|
Warrant |
|
Preferred Series C |
|
|
503,718 |
|
|
|
334 |
|
|
|
639 |
|
|
Mobile Posse, Inc. (15) |
|
Software |
|
Warrant |
|
Preferred Series C |
|
|
396,430 |
|
|
|
130 |
|
|
|
353 |
|
|
Neos, Inc. (15) |
|
Software |
|
Warrant |
|
Common Stock |
|
|
221,150 |
|
|
|
22 |
|
|
|
— |
|
|
NewVoiceMedia Limited (5)(10) |
|
Software |
|
Warrant |
|
Preferred Series E |
|
|
225,586 |
|
|
|
33 |
|
|
|
190 |
|
|
OneLogin, Inc. (15) |
|
Software |
|
Warrant |
|
Common Stock |
|
|
228,972 |
|
|
|
150 |
|
|
|
227 |
|
|
PerfectServe, Inc. |
|
Software |
|
Warrant |
|
Preferred Series C |
|
|
129,073 |
|
|
|
720 |
|
|
|
720 |
|
|
Poplicus, Inc. |
|
Software |
|
Warrant |
|
Common Stock |
|
|
132,168 |
|
|
|
— |
|
|
|
— |
|
|
Quid, Inc. (15) |
|
Software |
|
Warrant |
|
Preferred Series D |
|
|
71,576 |
|
|
|
1 |
|
|
|
7 |
|
|
RapidMiner, Inc. |
|
Software |
|
Warrant |
|
Preferred Series C-1 |
|
|
4,982 |
|
|
|
23 |
|
|
|
23 |
|
|
RedSeal Inc. (15) |
|
Software |
|
Warrant |
|
Preferred Series C-Prime |
|
|
640,603 |
|
|
|
66 |
|
|
|
44 |
|
|
Signpost, Inc. |
|
Software |
|
Warrant |
|
Preferred Series C |
|
|
324,005 |
|
|
|
314 |
|
|
|
106 |
|
|
Wrike, Inc. |
|
Software |
|
Warrant |
|
Common Stock |
|
|
698,760 |
|
|
|
462 |
|
|
|
1,040 |
|
|
Subtotal: Software (1.06%)* |
|
|
|
|
|
|
|
|
|
|
5,413 |
|
|
|
8,884 |
|
||
|
|
|
|
|
|
|
|
|
|
|
|
|
|
|
|
|
|
|
|
|
Specialty Pharmaceuticals |
|
|
|
|
|
|
|
|
|
|
|
|
|
|
|
|
|
|
|
Alimera Sciences, Inc. (4) |
|
Specialty Pharmaceuticals |
|
Warrant |
|
Common Stock |
|
|
1,717,709 |
|
|
|
861 |
|
|
|
488 |
|
|
Subtotal: Specialty Pharmaceuticals (0.06%)* |
|
|
|
|
|
|
|
|
|
|
861 |
|
|
|
488 |
|
||
|
|
|
|
|
|
|
|
|
|
|
|
|
|
|
|
|
|
|
|
|
Surgical Devices |
|
|
|
|
|
|
|
|
|
|
|
|
|
|
|
|
|
|
|
Gynesonics, Inc. (15) |
|
Surgical Devices |
|
Warrant |
|
Preferred Series C |
|
|
180,480 |
|
|
|
75 |
|
|
|
15 |
|
|
|
|
Surgical Devices |
|
Warrant |
|
Preferred Series D |
|
|
1,575,965 |
|
|
|
320 |
|
|
|
291 |
|
|
Total Gynesonics, Inc. |
|
|
1,756,445 |
|
|
|
395 |
|
|
|
306 |
|
||||||
|
Transmedics, Inc. |
|
Surgical Devices |
|
Warrant |
|
Preferred Series B |
|
|
40,436 |
|
|
|
225 |
|
|
|
16 |
|
|
|
|
Surgical Devices |
|
Warrant |
|
Preferred Series D |
|
|
175,000 |
|
|
|
100 |
|
|
|
429 |
|
|
|
|
Surgical Devices |
|
Warrant |
|
Preferred Series F |
|
|
50,544 |
|
|
|
38 |
|
|
|
60 |
|
|
Total Transmedics, Inc. |
|
|
265,980 |
|
|
|
363 |
|
|
|
505 |
|
||||||
|
Subtotal: Surgical Devices (0.10%)* |
|
|
|
|
|
|
|
|
|
|
758 |
|
|
|
811 |
|
||
See notes to consolidated financial statements.
132
CONSOLIDATED SCHEDULE OF INVESTMENTS
December 31, 2017
(dollars in thousands)
|
Portfolio Company |
|
Sub-Industry |
|
Type of Investment (1) |
|
Series |
|
Shares |
|
|
Cost (3) |
|
|
Value (4) |
|
|||
|
Sustainable and Renewable Technology |
|
|
|
|
|
|
|
|
|
|
|
|
|
|
|
|
|
|
|
Agrivida, Inc. (15) |
|
Sustainable and Renewable Technology |
|
Warrant |
|
Preferred Series D |
|
|
471,327 |
|
|
$ |
120 |
|
|
$ |
88 |
|
|
Alphabet Energy, Inc. (15) |
|
Sustainable and Renewable Technology |
|
Warrant |
|
Preferred Series 1B |
|
|
13,667 |
|
|
|
82 |
|
|
|
— |
|
|
American Superconductor Corporation (4) |
|
Sustainable and Renewable Technology |
|
Warrant |
|
Common Stock |
|
|
58,823 |
|
|
|
39 |
|
|
|
7 |
|
|
Brightsource Energy, Inc. |
|
Sustainable and Renewable Technology |
|
Warrant |
|
Preferred Series 1 |
|
|
116,666 |
|
|
|
104 |
|
|
|
— |
|
|
Calera, Inc. (15) |
|
Sustainable and Renewable Technology |
|
Warrant |
|
Preferred Series C |
|
|
44,529 |
|
|
|
513 |
|
|
|
— |
|
|
EcoMotors, Inc. (15) |
|
Sustainable and Renewable Technology |
|
Warrant |
|
Preferred Series B |
|
|
437,500 |
|
|
|
308 |
|
|
|
— |
|
|
Fluidic, Inc. |
|
Sustainable and Renewable Technology |
|
Warrant |
|
Preferred Series D |
|
|
61,804 |
|
|
|
102 |
|
|
|
— |
|
|
Flywheel Building Intelligence, Inc. (p.k.a. SCIEnergy, Inc.) |
|
Sustainable and Renewable Technology |
|
Warrant |
|
Common Stock |
|
|
530,811 |
|
|
|
181 |
|
|
|
— |
|
|
|
|
Sustainable and Renewable Technology |
|
Warrant |
|
Preferred Series 2-A |
|
|
6,229 |
|
|
|
50 |
|
|
|
— |
|
|
Total Flywheel Building Intelligence, Inc. (p.k.a. SCIEnergy, Inc.) |
|
|
537,040 |
|
|
|
231 |
|
|
|
— |
|
||||||
|
Fulcrum Bioenergy, Inc. |
|
Sustainable and Renewable Technology |
|
Warrant |
|
Preferred Series C-1 |
|
|
280,897 |
|
|
|
275 |
|
|
|
357 |
|
|
GreatPoint Energy, Inc. (15) |
|
Sustainable and Renewable Technology |
|
Warrant |
|
Preferred Series D-1 |
|
|
393,212 |
|
|
|
548 |
|
|
|
— |
|
|
Kinestral Technologies, Inc. |
|
Sustainable and Renewable Technology |
|
Warrant |
|
Preferred Series A |
|
|
325,000 |
|
|
|
155 |
|
|
|
155 |
|
|
|
|
Sustainable and Renewable Technology |
|
Warrant |
|
Preferred Series B |
|
|
131,883 |
|
|
|
63 |
|
|
|
63 |
|
|
Total Kinestral Technologies, Inc. |
|
|
456,883 |
|
|
|
218 |
|
|
|
218 |
|
||||||
|
Polyera Corporation (15) |
|
Sustainable and Renewable Technology |
|
Warrant |
|
Preferred Series C |
|
|
311,609 |
|
|
|
338 |
|
|
|
— |
|
|
Proterra, Inc. |
|
Sustainable and Renewable Technology |
|
Warrant |
|
Preferred Series 4 |
|
|
477,517 |
|
|
|
41 |
|
|
|
599 |
|
|
Rive Technology, Inc. (15) |
|
Sustainable and Renewable Technology |
|
Warrant |
|
Preferred Series E |
|
|
234,477 |
|
|
|
12 |
|
|
|
8 |
|
|
Stion Corporation (6) |
|
Sustainable and Renewable Technology |
|
Warrant |
|
Preferred Series Seed |
|
|
2,154 |
|
|
|
1,378 |
|
|
|
— |
|
|
TAS Energy, Inc. |
|
Sustainable and Renewable Technology |
|
Warrant |
|
Preferred Series AA |
|
|
428,571 |
|
|
|
299 |
|
|
|
— |
|
|
Tendril Networks |
|
Sustainable and Renewable Technology |
|
Warrant |
|
Preferred Series 3-A |
|
|
1,019,793 |
|
|
|
189 |
|
|
|
— |
|
|
Subtotal: Sustainable and Renewable Technology (0.15%)* |
|
|
|
|
|
|
|
|
|
|
4,797 |
|
|
|
1,277 |
|
||
|
Total: Warrant Investments (4.38%)* |
|
|
|
|
|
|
43,578 |
|
|
|
36,869 |
|
||||||
|
Total Investments in Securities (183.39%)* |
|
|
|
|
|
$ |
1,619,829 |
|
|
$ |
1,542,214 |
|
||||||
|
* |
Value as a percent of net assets |
|
(1) |
Preferred and common stock, warrants, and equity interests are generally non-income producing. |
|
(2) |
Interest rate PRIME represents 4.50% at December 31, 2017. Daily LIBOR, 1-month LIBOR, 3-month LIBOR and 12-month LIBOR represent 1.44%, 1.57%, 1.69% and 2.11%, respectively, at December 31, 2017. |
|
(3) |
Gross unrealized appreciation, gross unrealized depreciation, and net unrealized depreciation for federal income tax purposes totaled $32.5 million, $119.7 million and $87.2 million respectively. The tax cost of investments is $1.6 billion. |
|
(4) |
Except for warrants in 43 publicly traded companies and common stock in 20 publicly traded companies, all investments are restricted at December 31, 2017 and were valued at fair value using Level 3 significant unobservable inputs as determined in good faith by the Board of Directors. No unrestricted securities of the same issuer are outstanding. The Company uses the Standard Industrial Code for classifying the industry grouping of its portfolio companies. |
|
(5) |
Non-U.S. company or the company’s principal place of business is outside the United States. |
|
(6) |
Affiliate investment as defined under the 1940 Act in which Hercules owns at least 5% but generally less than 25% of the company’s voting securities. |
|
(7) |
Control investment as defined under the 1940 Act in which Hercules owns at least 25% of the company’s voting securities or has greater than 50% representation on its board. |
|
(8) |
Debt is on non-accrual status at December 31, 2017, and is therefore considered non-income producing. Note that at December 31, 2017, only the $11.0 million PIK loan is on non-accrual for the Company’s debt investment in Tectura Corporation. |
|
(9) |
Denotes that all or a portion of the debt investment is convertible debt. |
|
(10) |
Indicates assets that the Company deems not “qualifying assets” under section 55(a) of 1940 Act. Qualifying assets must represent at least 70% of the Company’s total assets at the time of acquisition of any additional non-qualifying assets. |
|
(11) |
Denotes that all or a portion of the debt investment secures the notes offered in the Debt Securitization (as defined in Note 4). |
|
(12) |
Denotes that all or a portion of the debt investment is pledged as collateral under the Wells Facility (as defined in Note 4). |
|
(13) |
Denotes that all or a portion of the debt investment is pledged as collateral under the Union Bank Facility (as defined in Note 4). |
|
(14) |
Denotes that all or a portion of the debt investment principal includes accumulated PIK interest and is net of repayments. |
|
(15) |
Denotes that all or a portion of the investment in this portfolio company is held by HT II or HT III, the Company’s wholly owned SBIC subsidiaries. |
|
(16) |
Denotes that the fair value of the Company’s total investments in this portfolio company represent greater than 5% of the Company’s total assets at December 31, 2017. |
|
(17) |
Denotes that there is an unfunded contractual commitment available at the request of this portfolio company at December 31, 2017. Refer to Note 10. |
See notes to consolidated financial statements.
133
NOTES TO CONSOLIDATED FINANCIAL STATEMENTS
1. Description of Business and Basis of Presentation
Hercules Capital, Inc. (the “Company”) is a specialty finance company focused on providing senior secured loans to high-growth, innovative venture capital-backed companies in a variety of technology, life sciences, and sustainable and renewable technology industries. The Company sources its investments through its principal office located in Palo Alto, CA, as well as through its additional offices in Boston, MA, New York, NY, Washington, DC, Hartford, CT, Westport, CT, Chicago, IL, and San Diego, CA. The Company was incorporated under the General Corporation Law of the State of Maryland in December 2003.
The Company is an internally managed, non-diversified closed-end investment company that has elected to be regulated as a business development company (“BDC”) under the 1940 Act. From incorporation through December 31, 2005, the Company was subject to tax as a corporation under Subchapter C of the Code. Effective January 1, 2006, the Company elected to be treated for tax purposes as a RIC under Subchapter M of the Code (see Note 5). As an investment company, the Company follows accounting and reporting guidance as set forth in Topic 946 (“Financial Services – Investment Companies”) of the FASB Accounting Standards Codification, as amended (“ASC”).
HT II, HT III, and HT IV, are Delaware limited partnerships that were formed in January 2005, September 2009 and December 2010, respectively. HT II and HT III were licensed to operate as small business investment companies (“SBICs”) under the authority of the Small Business Administration (“SBA”) on September 27, 2006 and May 26, 2010, respectively. On July 13, 2018, the Company completed repayment of the remaining outstanding HT II debentures and subsequently surrendered the SBA license with respect to HT II.
As an SBIC, HT III is subject to a variety of regulations concerning, among other things, the size and nature of the companies in which it may invest and the structure of those investments. HT IV was formed in anticipation of receiving an additional SBIC license; however, the Company has not received such license, and HT IV currently has no material assets or liabilities. The Company also formed Hercules Technology SBIC Management, LLC (“HTM”), a limited liability company, in November 2003. HTM is a wholly owned subsidiary of the Company and serves as the limited partner and general partner of HT II and HT III (see Note 4 to the Company’s consolidated financial statements).
HT III holds approximately $307.5 million in assets which accounts for approximately 14.3% of the Company’s total assets, prior to consolidation at December 31, 2018.
The Company also established wholly owned subsidiaries, all of which are structured as Delaware corporations and limited liability companies, to hold portfolio companies organized as limited liability companies, or LLCs (or other forms of pass-through entities). By investing through these wholly owned subsidiaries, the Company is able to benefit from the tax treatment of these entities and create a tax structure that is more advantageous with respect to the Company’s RIC status. These taxable subsidiaries are consolidated for financial reporting purposes and in accordance with U.S. GAAP, and the portfolio investments held by these taxable subsidiaries are included in the Company’s consolidated financial statements and recorded at fair value. These taxable subsidiaries are not consolidated with Hercules for income tax purposes and may generate income tax expense, or benefit, and tax assets and liabilities as a result of their ownership of certain portfolio investments.
Financial statements prepared on a U.S. GAAP basis require management to make estimates and assumptions that affect the amounts and disclosures reported in the consolidated financial statements and accompanying notes. Such estimates and assumptions could change in the future as more information becomes known, which could impact the amounts reported and disclosed herein.
134
2. Summary of Significant Accounting Policies
Principles of Consolidation
The Consolidated Financial Statements include the accounts of the Company and its subsidiaries and all VIEs of which the Company is the primary beneficiary. All intercompany accounts and transactions have been eliminated in consolidation.
A VIE is an entity that either (i) has insufficient equity to permit the entity to finance its activities without additional subordinated financial support or (ii) has equity investors who lack the characteristics of a controlling financial interest. The primary beneficiary of a VIE is the party with both the power to direct the activities of the VIE that most significantly impact the VIE’s economic performance and the obligation to absorb the losses or the right to receive benefits that could be significant to the VIE.
To assess whether the Company has the power to direct the activities of a VIE that most significantly impact its economic performance, the Company considers all the facts and circumstances including its role in establishing the VIE and its ongoing rights and responsibilities. This assessment includes identifying the activities that most significantly impact the VIE’s economic performance and identifying which party, if any, has power over those activities. In general, the party that makes the most significant decisions affecting the VIE is determined to have the power to direct the activities of a VIE. To assess whether the Company has the obligation to absorb the losses or the right to receive benefits that could potentially be significant to the VIE, the Company considers all of its economic interests, including debt and equity interests, servicing rights and fee arrangements, and any other variable interests in the VIE. If the Company determines that it is the party with the power to make the most significant decisions affecting the VIE, and the Company has a potentially significant interest in the VIE, then it consolidates the VIE.
The Company performs periodic reassessments, usually quarterly, of whether it is the primary beneficiary of a VIE. The reassessment process considers whether the Company has acquired or divested the power to direct the activities of the VIE through changes in governing documents or other circumstances. The Company also reconsiders whether entities previously determined not to be VIEs have become VIEs, based on certain events, and therefore are subject to the VIE consolidation framework.
As of the date of this report, the only VIE consolidated by the Company is its securitization VIE formed in conjunction with the issuance of the 2027 Asset-Backed Notes (as defined herein). See “Note 4 – Borrowings.”
Valuation of Investments
The most significant estimate inherent in the preparation of the Company’s consolidated financial statements is the valuation of investments and the related amounts of unrealized appreciation and depreciation of investments recorded.
At December 31, 2018, approximately 96.7% of the Company’s total assets represented investments in portfolio companies whose fair value is determined in good faith by the Board of Directors. Value, as defined in Section 2(a)(41) of the 1940 Act, is (i) the market price for those securities for which a market quotation is readily available and (ii) for all other securities and assets, fair value is as determined in good faith by the Board of Directors. The Company’s investments are carried at fair value in accordance with the 1940 Act and ASC Topic 946 and measured in accordance with ASC Topic 820 (“Fair Value Measurements”). The Company’s debt securities are primarily invested in venture capital-backed companies in technology-related industries including technology, drug discovery and development, biotechnology, life sciences, healthcare, and sustainable and renewable technology at all stages of development. Given the nature of lending to these types of businesses, substantially all of the Company’s investments in these portfolio companies are considered Level 3 assets under ASC Topic 820 because there is no known or accessible market or market indexes for these investment securities to be traded or exchanged. As such, the Company values substantially all of its investments at fair value as determined in good faith pursuant to a consistent valuation policy by the Board of Directors in accordance with the provisions of ASC Topic 820 and the 1940 Act. Due to the inherent uncertainty in determining the fair value of investments that do not have a readily available market value, the fair value of the Company’s investments determined in good faith by its Board of Directors may differ significantly from the value that would have been used had a readily available market existed for such investments, and the differences could be material.
The Company may from time to time engage an independent valuation firm to provide the Company with valuation assistance with respect to certain portfolio investments. The Company engages independent valuation firms on a discretionary basis. Specifically, on a quarterly basis, the Company will identify portfolio investments with respect to which an independent valuation firm will assist in valuing. The Company selects these portfolio investments based on a number of factors, including, but not limited to, the potential for material fluctuations in valuation results, size, credit quality and the time lapse since the last valuation of the portfolio investment by an independent valuation firm.
135
The Company intends to continue to engage an independent valuation firm to provide management with assistance regarding the Company’s determination of the fair value of selected portfolio investments each quarter unless directed by the Board of Directors to cancel such valuation services. The scope of services rendered by an independent valuation firm is at the discretion of the Board of Directors. The Board of Directors are ultimately and solely, responsible for determining the fair value of the Company’s investments in good faith.
With respect to investments for which market quotations are not readily available or when such market quotations are deemed not to represent fair value, the Board of Directors have approved a multi-step valuation process each quarter, as described below:
(1) the Company’s quarterly valuation process begins with each portfolio company being initially valued by the investment professionals responsible for the portfolio investment;
(2) preliminary valuation conclusions are then documented and business based assumptions are discussed with the Company’s investment committee;
(3) the Audit Committee of the Board of Directors reviews the preliminary valuation of the investments in the portfolio as provided by the investment committee which incorporates the results of the independent valuation firm as appropriate; and
(4) the Board of Directors, upon the recommendation of the Audit Committee, discusses valuations and determines the fair value of each investment in the Company’s portfolio in good faith based on the input of, where applicable, the respective independent valuation firm and the investment committee.
ASC Topic 820 establishes a framework for measuring the fair value of assets and liabilities and outlines a fair value hierarchy which prioritizes the inputs used to measure fair value and the effect of fair value measures on earnings. ASC Topic 820 also requires disclosure for fair value measurements based on the level within the hierarchy of the information used in the valuation. ASC Topic 820 applies whenever other standards require (or permit) assets or liabilities to be measured at fair value. ASC Topic 820 defines fair value as the price that would be received to sell an asset or paid to transfer a liability in an orderly transaction between market participants at the measurement date.
The Company has categorized all investments recorded at fair value in accordance with ASC Topic 820 based upon the level of judgment associated with the inputs used to measure their fair value. Hierarchical levels, defined by ASC Topic 820 and directly related to the amount of subjectivity associated with the inputs to fair valuation of these assets and liabilities, are as follows:
Level 1—Inputs are unadjusted, quoted prices in active markets for identical assets at the measurement date. The types of assets carried at Level 1 fair value generally are equities listed in active markets.
Level 2—Inputs (other than quoted prices included in Level 1) are either directly or indirectly observable for the asset in connection with market data at the measurement date and for the extent of the instrument’s anticipated life. Fair valued assets that are generally included in this category are publicly held debt investments and warrants held in a public company.
Level 3—Inputs reflect management’s best estimate of what market participants would use in pricing the asset at the measurement date. It includes prices or valuations that require inputs that are both significant to the fair value measurement and unobservable. Generally, assets carried at fair value and included in this category are the debt investments and warrants and equities held in a private company.
Investments measured at fair value on a recurring basis are categorized in the tables below based upon the lowest level of significant input to the valuations as of December 31, 2018 and December 31, 2017.
136
The Company transfers investments in and out of Level 1, 2 and 3 as of the beginning of the period, based on changes in the use of observable and unobservable inputs utilized to perform the valuation for the period. During the year ended December 31, 2018, there were no transfers between Levels 1 or 2.
|
|
|
|
|
|
|
Quoted Prices In |
|
|
|
|
|
|
|
|
|
|
|
|
|
|
|
|
|
Active Markets For |
|
|
Significant Other |
|
|
Significant |
|
|||
|
(in thousands) |
|
Balance |
|
|
Identical Assets |
|
|
Observable Inputs |
|
|
Unobservable Inputs |
|
||||
|
Description |
|
December 31, 2018 |
|
|
(Level 1) |
|
|
(Level 2) |
|
|
(Level 3) |
|
||||
|
Senior Secured Debt |
|
$ |
1,719,091 |
|
|
$ |
— |
|
|
$ |
— |
|
|
$ |
1,719,091 |
|
|
Unsecured Debt |
|
|
14,401 |
|
|
|
— |
|
|
|
— |
|
|
|
14,401 |
|
|
Preferred Stock |
|
|
68,625 |
|
|
|
— |
|
|
|
— |
|
|
|
68,625 |
|
|
Common Stock |
|
|
51,587 |
|
|
|
27,346 |
|
|
|
— |
|
|
|
24,241 |
|
|
Warrants |
|
|
26,669 |
|
|
|
— |
|
|
|
3,996 |
|
|
|
22,673 |
|
|
Escrow Receivable |
|
|
970 |
|
|
|
— |
|
|
|
— |
|
|
|
970 |
|
|
Total |
|
$ |
1,881,343 |
|
|
$ |
27,346 |
|
|
$ |
3,996 |
|
|
$ |
1,850,001 |
|
|
|
|
|
|
|
|
|
|
|
|
|
|
|
|
|
|
|
|
|
|
|
|
|
|
Quoted Prices In |
|
|
|
|
|
|
|
|
|
|
|
|
|
|
|
|
|
Active Markets For |
|
|
Significant Other |
|
|
Significant |
|
|||
|
(in thousands) |
|
Balance |
|
|
Identical Assets |
|
|
Observable Inputs |
|
|
Unobservable Inputs |
|
||||
|
Description |
|
December 31, 2017 |
|
|
(Level 1) |
|
|
(Level 2) |
|
|
(Level 3) |
|
||||
|
Senior Secured Debt |
|
$ |
1,415,984 |
|
|
$ |
— |
|
|
$ |
— |
|
|
$ |
1,415,984 |
|
|
Preferred Stock |
|
|
40,683 |
|
|
|
— |
|
|
|
— |
|
|
|
40,683 |
|
|
Common Stock |
|
|
48,678 |
|
|
|
22,825 |
|
|
|
— |
|
|
|
25,853 |
|
|
Warrants |
|
|
36,869 |
|
|
|
— |
|
|
|
5,664 |
|
|
|
31,205 |
|
|
Escrow Receivable |
|
|
752 |
|
|
|
— |
|
|
|
— |
|
|
|
752 |
|
|
Total |
|
$ |
1,542,966 |
|
|
$ |
22,825 |
|
|
$ |
5,664 |
|
|
$ |
1,514,477 |
|
The table below presents a reconciliation for all financial assets and liabilities measured at fair value on a recurring basis, excluding accrued interest components, using significant unobservable inputs (Level 3) for the years ended December 31, 2018 and December 31, 2017.
|
(in thousands) |
|
Balance January 1, 2018 |
|
|
Net Realized Gains (Losses) (1) |
|
|
Net Change in Unrealized Appreciation (Depreciation) (2) |
|
|
Purchases (5) |
|
|
Sales |
|
|
Repayments (6) |
|
|
Gross Transfers into Level 3 (3) |
|
|
Gross Transfers out of Level 3 (3) |
|
|
Balance December 31, 2018 |
|
|||||||||
|
Senior Debt |
|
$ |
1,415,984 |
|
|
$ |
(14,066 |
) |
|
$ |
4,947 |
|
|
$ |
896,831 |
|
|
$ |
— |
|
|
$ |
(584,605 |
) |
|
$ |
— |
|
|
$ |
— |
|
|
$ |
1,719,091 |
|
|
Unsecured Debt |
|
|
— |
|
|
|
— |
|
|
|
(328 |
) |
|
|
20,583 |
|
|
|
— |
|
|
|
(5,671 |
) |
|
|
— |
|
|
|
(183 |
) |
|
|
14,401 |
|
|
Preferred Stock |
|
|
40,683 |
|
|
|
2,540 |
|
|
|
(11,068 |
) |
|
|
39,993 |
|
|
|
(3,706 |
) |
|
|
— |
|
|
|
183 |
|
|
|
— |
|
|
|
68,625 |
|
|
Common Stock |
|
|
25,853 |
|
|
|
(3,299 |
) |
|
|
(7,583 |
) |
|
|
17,950 |
|
|
|
(301 |
) |
|
|
— |
|
|
|
— |
|
|
|
(8,379 |
) |
|
|
24,241 |
|
|
Warrants |
|
|
31,205 |
|
|
|
(982 |
) |
|
|
(2,982 |
) |
|
|
2,050 |
|
|
|
(6,402 |
) |
|
|
— |
|
|
|
— |
|
|
|
(216 |
) |
|
|
22,673 |
|
|
Escrow Receivable |
|
|
752 |
|
|
|
1 |
|
|
|
(143 |
) |
|
|
892 |
|
|
|
(532 |
) |
|
|
— |
|
|
|
— |
|
|
|
— |
|
|
|
970 |
|
|
Total |
|
$ |
1,514,477 |
|
|
$ |
(15,806 |
) |
|
$ |
(17,157 |
) |
|
$ |
978,299 |
|
|
$ |
(10,941 |
) |
|
$ |
(590,276 |
) |
|
$ |
183 |
|
|
$ |
(8,778 |
) |
|
$ |
1,850,001 |
|
|
|
|
|
|
|
|
|
|
|
|
|
|
|
|
|
|
|
|
|
|
|
|
|
|
|
|
|
|
|
|
|
|
|
|
|
|
|
|
(in thousands) |
|
Balance January 1, 2017 |
|
|
Net Realized Gains (Losses) (1) |
|
|
Net Change in Unrealized Appreciation (Depreciation) (2) |
|
|
Purchases (5) |
|
|
Sales |
|
|
Repayments (6) |
|
|
Gross Transfers into Level 3 (4) |
|
|
Gross Transfers out of Level 3 (4) |
|
|
Balance December 31, 2017 |
|
|||||||||
|
Senior Debt |
|
$ |
1,323,978 |
|
|
$ |
(24,684 |
) |
|
$ |
29,610 |
|
|
$ |
776,648 |
|
|
$ |
— |
|
|
$ |
(626,897 |
) |
|
$ |
— |
|
|
$ |
(62,671 |
) |
|
$ |
1,415,984 |
|
|
Preferred Stock |
|
|
39,418 |
|
|
|
(7,531 |
) |
|
|
11,955 |
|
|
|
2,683 |
|
|
|
(468 |
) |
|
|
— |
|
|
|
— |
|
|
|
(5,374 |
) |
|
|
40,683 |
|
|
Common Stock |
|
|
10,965 |
|
|
|
(487 |
) |
|
|
(49,462 |
) |
|
|
3,748 |
|
|
|
(1,582 |
) |
|
|
— |
|
|
|
62,671 |
|
|
|
— |
|
|
|
25,853 |
|
|
Warrants |
|
|
24,246 |
|
|
|
727 |
|
|
|
8,450 |
|
|
|
5,449 |
|
|
|
(7,303 |
) |
|
|
— |
|
|
|
— |
|
|
|
(364 |
) |
|
|
31,205 |
|
|
Escrow Receivable |
|
|
1,382 |
|
|
|
261 |
|
|
|
— |
|
|
|
3,127 |
|
|
|
(4,018 |
) |
|
|
— |
|
|
|
— |
|
|
|
— |
|
|
|
752 |
|
|
Total |
|
$ |
1,399,989 |
|
|
$ |
(31,714 |
) |
|
$ |
553 |
|
|
$ |
791,655 |
|
|
$ |
(13,371 |
) |
|
$ |
(626,897 |
) |
|
$ |
62,671 |
|
|
$ |
(68,409 |
) |
|
$ |
1,514,477 |
|
|
(1) |
Included in net realized gains or losses in the accompanying Consolidated Statement of Operations. |
|
(2) |
Included in net change in unrealized appreciation (depreciation) in the accompanying Consolidated Statement of Operations. |
|
(3) |
Transfers out of Level 3 during the year ended December 31, 2018 relate to the initial public offerings of DocuSign, Inc. and Tricida, Inc. and the conversion of our debt investment in Gynesonics, Inc. to preferred stock. Transfers into Level 3 for the year ended December 31, 2018 relate to the conversion of our debt investment in Gynesonics, Inc. to preferred stock. |
|
(4) |
Transfers out of Level 3 during the year ended December 31, 2017 relate to the conversion of our debt investment in Sungevity, Inc. and a portion of our debt investment in Gamma Medica, Inc. to common stock through bankruptcy transactions, IPOs of ForeScout Technologies, Inc., Aquantia Corporation, and Quanterix Corporation, and merger of our former portfolio company Cempra, Inc. and current portfolio company Melinta Therapeutics, Inc. into NASDAQ-listed company Melinta Therapeutics, Inc. Transfers into Level 3 during the year ended December 31, 2017 relate to the conversion of our debt investment in Sungevity, Inc. and a portion of our debt investment in Gamma Medica, Inc. to common stock through bankruptcy transactions. |
|
(5) |
Amounts listed above are inclusive of loan origination fees received at the inception of the loan which are deferred and amortized into fee income as well as the accretion of existing loan discounts and fees during the period. Escrow receivable purchases may include additions due to proceeds held in escrow from the liquidation of level 3 investments. |
|
(6) |
Amounts listed above include the acceleration and payment of loan discounts and loan fees due to early payoffs or restructures. |
137
For the year ended December 31, 2018, approximately $10.5 million and $10.9 million in net unrealized depreciation was recorded for preferred stock and common stock Level 3 investments, respectively, relating to assets still held at the reporting date. For the same period, approximately $14.5 million and $294,000 in net unrealized depreciation was recorded for debt and warrant Level 3 investments, respectively, relating to assets still held at the reporting date.
For the year ended December 31, 2017, approximately $4.2 million in net unrealized appreciation and $49.2 million in net unrealized depreciation was recorded for preferred stock and common stock Level 3 investments, respectively, relating to assets still held at the reporting date. The depreciation on common stock during the period reflects the conversion of the Company’s debt investment in Sungevity, Inc. to common stock at cost through a bankruptcy transaction and subsequent depreciation to fair value. For the same period, approximately $10.5 million in net unrealized depreciation and $9.0 million in net unrealized appreciation was recorded for debt and warrant Level 3 investments, respectively, relating to assets still held at the reporting date.
The following tables provide quantitative information about the Company’s Level 3 fair value measurements as of December 31, 2018 and December 31, 2017. In addition to the techniques and inputs noted in the tables below, according to the Company’s valuation policy the Company may also use other valuation techniques and methodologies when determining the Company’s fair value measurements. The tables below are not intended to be all-inclusive, but rather provide information on the significant Level 3 inputs as they relate to the Company’s fair value measurements.
The significant unobservable input used in the fair value measurement of the Company’s escrow receivables is the amount recoverable at the contractual maturity date of the escrow receivable.
|
Investment Type - Level Three Debt Investments |
|
Fair Value at December 31, 2018 (in thousands) |
|
|
Valuation Techniques/ Methodologies |
|
Unobservable Input (1) |
|
Range |
|
|
Weighted Average (2) |
|
|||||||
|
Pharmaceuticals |
|
$ |
25,039 |
|
|
Originated Within 4-6 Months |
|
Origination Yield |
|
10.50% - 12.47% |
|
|
11.68% |
|
||||||
|
|
|
|
480,737 |
|
|
Market Comparable Companies |
|
Hypothetical Market Yield |
|
10.25% - 16.86% |
|
|
13.33% |
|
||||||
|
|
|
|
|
|
|
|
|
Premium/(Discount) |
|
(0.25%) - 0.50% |
|
|
|
|
|
|||||
|
Technology |
|
|
63,125 |
|
|
Originated Within 4-6 Months |
|
Origination Yield |
|
11.71% - 19.94% |
|
|
13.02% |
|
||||||
|
|
|
|
618,141 |
|
|
Market Comparable Companies |
|
Hypothetical Market Yield |
|
10.73% - 16.13% |
|
|
13.08% |
|
||||||
|
|
|
|
|
|
|
|
|
Premium/(Discount) |
|
0.00% - 0.75% |
|
|
|
|
|
|||||
|
|
|
|
1,579 |
|
|
Liquidation (3) |
|
Probability weighting of alternative outcomes |
|
40.00% - 60.00% |
|
|
|
|
|
|||||
|
Sustainable and Renewable Technology |
|
|
75,834 |
|
|
Market Comparable Companies |
|
Hypothetical Market Yield |
|
11.90% - 17.48% |
|
|
13.47% |
|
||||||
|
|
|
|
|
|
|
|
|
Premium/(Discount) |
|
(0.25%) - 0.25% |
|
|
|
|
|
|||||
|
|
|
|
5,556 |
|
|
Liquidation (3) |
|
Probability weighting of alternative outcomes |
|
20.00% - 50.00% |
|
|
|
|
|
|||||
|
Medical Devices |
|
|
14,673 |
|
|
Originated Within 4-6 Months |
|
Origination Yield |
|
15.15% |
|
|
15.15% |
|
||||||
|
|
|
|
115,355 |
|
|
Market Comparable Companies |
|
Hypothetical Market Yield |
|
10.99% - 22.38% |
|
|
13.77% |
|
||||||
|
|
|
|
|
|
|
|
|
Premium/(Discount) |
|
0.00% - 0.75% |
|
|
|
|
|
|||||
|
|
|
|
2,405 |
|
|
Liquidation (3) |
|
Probability weighting of alternative outcomes |
|
50.00% |
|
|
|
|
|
|||||
|
Lower Middle Market |
|
|
123,589 |
|
|
Market Comparable Companies |
|
Hypothetical Market Yield |
|
9.74% - 17.25% |
|
|
14.24% |
|
||||||
|
|
|
|
|
|
|
|
|
Premium/(Discount) |
|
(0.25%) - 0.00% |
|
|
|
|
|
|||||
|
|
|
|
18,128 |
|
|
Liquidation (3) |
|
Probability weighting of alternative outcomes |
|
30.00% - 70.00% |
|
|
|
|
|
|||||
|
|
|
|
|
|
|
|
|
|
|
|
|
|
|
|
|
|
||||
|
|
|
|
|
|
|
Debt Investments Where Fair Value Approximates Cost |
|
|||||||||||||
|
|
|
|
153,312 |
|
|
Debt Investments originated within 3 months |
|
|
|
|
|
|
|
|
||||||
|
|
|
|
36,019 |
|
|
Debt Investments Maturing in Less than One Year |
|
|||||||||||||
|
|
|
$ |
1,733,492 |
|
|
Total Level Three Debt Investments |
|
|||||||||||||
|
(1) |
The significant unobservable inputs used in the fair value measurement of the Company’s debt securities are hypothetical market yields and premiums/(discounts). The hypothetical market yield is defined as the exit price of an investment in a hypothetical market to hypothetical market participants where buyers and sellers are willing participants. The premiums/(discounts) relate to company specific characteristics such as underlying investment performance, security liens, and other characteristics of the investment. Significant increases (decreases) in the inputs in isolation may result in a significantly lower (higher) fair value measurement, depending on the materiality of the investment. Debt investments in the industries noted in the Company’s Consolidated Schedule of Investments are included in the industries noted above as follows: |
|
|
• |
Pharmaceuticals, above, is comprised of debt investments in the Healthcare Services - Other, Drug Discovery & Development, Drug Delivery and Biotechnology Tools industries in the Consolidated Schedule of Investments. |
|
|
• |
Technology, above, is comprised of debt investments in the Software, Electronics & Computer Hardware, Media/Content/Info, Internet Consumer & Business Services, Consumer & Business Products, and Information Services industries in the Consolidated Schedule of Investments. |
|
|
• |
Sustainable and Renewable Technology, above, is comprised of debt investments in the Sustainable and Renewable Technology, Internet Consumer & Business Services, and Electronics & Computer Hardware industries in the Consolidated Schedule of Investments. |
|
|
• |
Medical Devices, above, is comprised of debt investments in the Drug Delivery, and Medical Devices & Equipment industries in the Consolidated Schedule of Investments. |
|
|
• |
Lower Middle Market, above, is comprised of debt investments in the Healthcare Services - Other, Internet Consumer & Business Services, Diversified Financial Services, Sustainable and Renewable Technology, and Software industries in the Consolidated Schedule of Investments. |
|
(2) |
The weighted averages are calculated based on the fair market value of each investment. |
|
(3) |
The significant unobservable input used in the fair value measurement of impaired debt securities is the probability weighting of alternative outcomes. |
138
|
Investment Type - Level Three Debt Investments |
|
Fair Value at December 31, 2017 (in thousands) |
|
|
Valuation Techniques/ Methodologies |
|
Unobservable Input (1) |
|
Range |
|
|
Weighted Average (2) |
|
|||
|
Pharmaceuticals |
|
$ |
44,301 |
|
|
Originated Within 6 Months |
|
Origination Yield |
|
10.71% - 12.61% |
|
|
11.89% |
|
||
|
|
|
|
379,841 |
|
|
Market Comparable Companies |
|
Hypothetical Market Yield |
|
10.14% - 16.14% |
|
|
12.94% |
|
||
|
|
|
|
|
|
|
|
|
Premium/(Discount) |
|
(0.25%) - 0.75% |
|
|
|
|
|
|
|
|
|
|
2,257 |
|
|
Liquidation (3) |
|
Probability weighting of alternative outcomes |
|
100.00% |
|
|
|
|
|
|
|
Technology |
|
|
158,916 |
|
|
Originated Within 6 Months |
|
Origination Yield |
|
9.4% - 25.11% |
|
|
11.68% |
|
||
|
|
|
|
290,561 |
|
|
Market Comparable Companies |
|
Hypothetical Market Yield |
|
9.47% - 19.21% |
|
|
13.55% |
|
||
|
|
|
|
|
|
|
|
|
Premium/(Discount) |
|
(0.25%) - 1.00% |
|
|
|
|
|
|
|
|
|
|
22,020 |
|
|
Liquidation (3) |
|
Probability weighting of alternative outcomes |
|
5.00% - 100.00% |
|
|
|
|
|
|
|
Sustainable and Renewable |
|
|
33,020 |
|
|
Originated Within 6 Months |
|
Origination Yield |
|
11.97% - 20.06% |
|
|
15.31% |
|
||
|
Technology |
|
|
49,647 |
|
|
Market Comparable Companies |
|
Hypothetical Market Yield |
|
11.15% - 14.16% |
|
|
12.13% |
|
||
|
|
|
|
|
|
|
|
|
Premium/(Discount) |
|
0.00% - 0.25% |
|
|
|
|
|
|
|
Medical Devices |
|
|
17,013 |
|
|
Originated Within 6 Months |
|
Origination Yield |
|
13.49% |
|
|
13.49% |
|
||
|
|
|
|
89,869 |
|
|
Market Comparable Companies |
|
Hypothetical Market Yield |
|
9.66% - 17.57% |
|
|
12.28% |
|
||
|
|
|
|
|
|
|
|
|
Premium/(Discount) |
|
0.00% - 0.50% |
|
|
|
|
|
|
|
Lower Middle Market |
|
|
97,291 |
|
|
Originated Within 6 Months |
|
Origination Yield |
|
8.29% - 12.68% |
|
|
12.01% |
|
||
|
|
|
|
19,219 |
|
|
Liquidation (3) |
|
Probability weighting of alternative outcomes |
|
10.00% - 100.00% |
|
|
|
|
|
|
|
|
|
|
|
|
|
|
|
|
|
|
|
|
|
|
|
|
|
|
|
|
|
|
|
Debt Investments Where Fair Value Approximates Cost |
|
|||||||||
|
|
|
|
35,517 |
|
|
Imminent Payoffs (4) |
|
|
|
|
|
|
|
|
|
|
|
|
|
|
176,512 |
|
|
Debt Investments Maturing in Less than One Year |
|
|||||||||
|
|
|
$ |
1,415,984 |
|
|
Total Level Three Debt Investments |
|
|||||||||
|
(1) |
The significant unobservable inputs used in the fair value measurement of the Company’s debt securities are hypothetical market yields and premiums/(discounts). The hypothetical market yield is defined as the exit price of an investment in a hypothetical market to hypothetical market participants where buyers and sellers are willing participants. The premiums/(discounts) relate to company specific characteristics such as underlying investment performance, security liens, and other characteristics of the investment. Significant increases (decreases) in the inputs in isolation may result in a significantly lower (higher) fair value measurement, depending on the materiality of the investment. Debt investments in the industries noted in the Company’s Consolidated Schedule of Investments are included in the industries noted above as follows: |
|
|
• |
Pharmaceuticals, above, is comprised of debt investments in the Specialty Pharmaceuticals, Drug Discovery and Development, Drug Delivery and Biotechnology Tools industries in the Consolidated Schedule of Investments. |
|
|
• |
Technology, above, is comprised of debt investments in the Software, Semiconductors, Internet Consumer and Business Services, Consumer and Business Products, Information Services, and Communications and Networking industries in the Consolidated Schedule of Investments. |
|
|
• |
Sustainable and Renewable Technology, above, aligns with the Sustainable and Renewable Technology Industry in the Consolidated Schedule of Investments. |
|
|
• |
Medical Devices, above, is comprised of debt investments in the Surgical Devices and Medical Devices and Equipment industries in the Consolidated Schedule of Investments. |
|
|
• |
Lower Middle Market, above, is comprised of debt investments in the Communications and Networking, Electronics and Computer Hardware, Healthcare Services - Other, Information Services, Internet Consumer and Business Services, Media/Content/Info, and Specialty Pharmaceuticals industries in the Consolidated Schedule of Investments. |
|
(2) |
The weighted averages are calculated based on the fair market value of each investment. |
|
(3) |
The significant unobservable input used in the fair value measurement of impaired debt securities is the probability weighting of alternative outcomes. |
|
(4) |
Imminent payoffs represent debt investments that the Company expects to be fully repaid within the next three months, prior to their scheduled maturity date. |
139
|
Investment Type - Level Three Equity and Warrant Investments |
|
Fair Value at December 31, 2018 (in thousands) |
|
|
Valuation Techniques/ Methodologies |
|
Unobservable Input (1) |
|
Range |
|
|
Weighted Average (6) |
|
|||||||||||
|
Equity Investments |
|
$ |
34,204 |
|
|
Market Comparable Companies |
|
EBITDA Multiple (2) |
|
6.3x - 14.7x |
|
|
8.4x |
|
||||||||||
|
|
|
|
|
|
|
|
|
Revenue Multiple (2) |
|
0.4x - 11.8x |
|
|
3.9x |
|
||||||||||
|
|
|
|
|
|
|
|
|
Discount for Lack of Marketability (3) |
|
12.53% - 22.68% |
|
|
15.79% |
|
||||||||||
|
|
|
|
|
|
|
|
|
Average Industry Volatility (4) |
|
40.19% - 88.21% |
|
|
60.37% |
|
||||||||||
|
|
|
|
|
|
|
|
|
Risk-Free Interest Rate |
|
2.61% |
|
|
2.61% |
|
||||||||||
|
|
|
|
|
|
|
|
|
Estimated Time to Exit (in months) |
|
10 - 14 |
|
|
|
12 |
|
|||||||||
|
|
|
|
16,040 |
|
|
Market Adjusted OPM Backsolve |
|
Market Equity Adjustment (5) |
|
(95.22%) - 12.81% |
|
|
(3.45%) |
|
||||||||||
|
|
|
|
|
|
|
|
|
Average Industry Volatility (4) |
|
34.1% - 100.56% |
|
|
76.79% |
|
||||||||||
|
|
|
|
|
|
|
|
|
Risk-Free Interest Rate |
|
1.00% - 2.84% |
|
|
2.16% |
|
||||||||||
|
|
|
|
|
|
|
|
|
Estimated Time to Exit (in months) |
|
10 - 43 |
|
|
|
16 |
|
|||||||||
|
|
|
|
3,115 |
|
|
Liquidation |
|
EBITDA Multiple (2) |
|
11.3x |
|
|
11.3x |
|
||||||||||
|
|
|
|
|
|
|
|
|
Revenue Multiple (2) |
|
1.5x - 1.7x |
|
|
1.6x |
|
||||||||||
|
|
|
|
39,507 |
|
|
Other (7) |
|
|
|
|
|
|
|
|
|
|
||||||||
|
Warrant Investments |
|
|
11,267 |
|
|
Market Comparable Companies |
|
EBITDA Multiple (2) |
|
6.3x - 13.8x |
|
|
9.3x |
|
||||||||||
|
|
|
|
|
|
|
|
|
Revenue Multiple (2) |
|
0.2x - 7.7x |
|
|
4.0x |
|
||||||||||
|
|
|
|
|
|
|
|
|
Discount for Lack of Marketability (3) |
|
12.53% - 32.2% |
|
|
17.14% |
|
||||||||||
|
|
|
|
|
|
|
|
|
Average Industry Volatility (4) |
|
33.76% - 100.71% |
|
|
63.71% |
|
||||||||||
|
|
|
|
|
|
|
|
|
Risk-Free Interest Rate |
|
2.46% - 2.63% |
|
|
2.59% |
|
||||||||||
|
|
|
|
|
|
|
|
|
Estimated Time to Exit (in months) |
|
10 - 48 |
|
|
|
14 |
|
|||||||||
|
|
|
|
4,243 |
|
|
Market Adjusted OPM Backsolve |
|
Market Equity Adjustment (5) |
|
(69.28%) - 22.02% |
|
|
(7.75%) |
|
||||||||||
|
|
|
|
|
|
|
|
|
Average Industry Volatility (4) |
|
34.1% - 109.24% |
|
|
74.15% |
|
||||||||||
|
|
|
|
|
|
|
|
|
Risk-Free Interest Rate |
|
1.04% - 2.97% |
|
|
2.27% |
|
||||||||||
|
|
|
|
|
|
|
|
|
Estimated Time to Exit (in months) |
|
4 - 47 |
|
|
|
23 |
|
|||||||||
|
|
|
|
7,163 |
|
|
Other (7) |
|
|
|
|
|
|
|
|
|
|
||||||||
|
Total Level Three Warrant and Equity Investments |
|
$ |
115,539 |
|
|
|
|
|
|
|
|
|
|
|
|
|
||||||||
|
(1) |
The significant unobservable inputs used in the fair value measurement of the Company’s warrant and equity-related securities are revenue and/or EBITDA multiples, market equity adjustment factors, and discounts for lack of marketability. Additional inputs used in the OPM include industry volatility, risk free interest rate and estimated time to exit. Significant increases (decreases) in the inputs in isolation would result in a significantly higher (lower) fair value measurement, depending on the materiality of the investment. For some investments, additional consideration may be given to data from the last round of financing or merger/acquisition events near the measurement date. |
|
(2) |
Represents amounts used when the Company has determined that market participants would use such multiples when pricing the investments. |
|
(3) |
Represents amounts used when the Company has determined market participants would take into account these discounts when pricing the investments. |
|
(4) |
Represents the range of industry volatility used by market participants when pricing the investment. |
|
(5) |
Represents the range of changes in industry valuations since the portfolio company's last external valuation event. |
|
(6) |
Weighted averages are calculated based on the fair market value of each investment. |
|
(7) |
The fair market value of these investments is derived based on recent private market and merger and acquisition transaction prices. |
140
|
Investment Type - Level Three Equity and Warrant Investments |
|
Fair Value at December 31, 2017 (in thousands) |
|
|
Valuation Techniques/ Methodologies |
|
Unobservable Input (1) |
|
Range |
|
Weighted Average (6) |
|
||
|
Equity Investments |
|
$ |
7,684 |
|
|
Market Comparable Companies |
|
EBITDA Multiple (2) |
|
5.1x - 40.2x |
|
13.2x |
|
|
|
|
|
|
|
|
|
|
|
Revenue Multiple (2) |
|
0.5x - 6.2x |
|
2.9x |
|
|
|
|
|
|
|
|
|
|
|
Discount for Lack of Marketability (3) |
|
7.49% - 12.97% |
|
8.77% |
|
|
|
|
|
|
|
|
|
|
|
Average Industry Volatility (4) |
|
27.8% - 77.3% |
|
53.35% |
|
|
|
|
|
|
|
|
|
|
|
Risk-Free Interest Rate |
|
1.40% - 1.90% |
|
1.47% |
|
|
|
|
|
|
|
|
|
|
|
Estimated Time to Exit (in months) |
|
3 - 10 |
|
|
5 |
|
|
|
|
|
19,323 |
|
|
Market Adjusted OPM Backsolve |
|
Market Equity Adjustment (5) |
|
(16.43%) - 29.4% |
|
11.79% |
|
|
|
|
|
|
|
|
|
|
|
Average Industry Volatility (4) |
|
33.17% - 78.77% |
|
68.99% |
|
|
|
|
|
|
|
|
|
|
|
Risk-Free Interest Rate |
|
0.84% - 1.51% |
|
1.42% |
|
|
|
|
|
|
|
|
|
|
|
Estimated Time to Exit (in months) |
|
5 - 26 |
|
|
13 |
|
|
|
|
|
39,529 |
|
|
Other (7) |
|
|
|
|
|
|
|
|
|
Warrant Investments |
|
|
19,310 |
|
|
Market Comparable Companies |
|
EBITDA Multiple (2) |
|
5x - 40.2x |
|
14.6x |
|
|
|
|
|
|
|
|
|
|
|
Revenue Multiple (2) |
|
0.5x - 6.4x |
|
2.6x |
|
|
|
|
|
|
|
|
|
|
|
Discount for Lack of Marketability (3) |
|
5.16% - 27.41% |
|
13.57% |
|
|
|
|
|
|
|
|
|
|
|
Average Industry Volatility (4) |
|
27.8% - 102.77% |
|
55.15% |
|
|
|
|
|
|
|
|
|
|
|
Risk-Free Interest Rate |
|
1.31% - 2.09% |
|
1.66% |
|
|
|
|
|
|
|
|
|
|
|
Estimated Time to Exit (in months) |
|
2 - 48 |
|
|
13 |
|
|
|
|
|
6,713 |
|
|
Market Adjusted OPM Backsolve |
|
Market Equity Adjustment (5) |
|
(68.52%) - 154.5% |
|
11.76% |
|
|
|
|
|
|
|
|
|
|
|
Average Industry Volatility (4) |
|
33.17% - 110.32% |
|
66.97% |
|
|
|
|
|
|
|
|
|
|
|
Risk-Free Interest Rate |
|
0.96% - 2.09% |
|
1.59% |
|
|
|
|
|
|
|
|
|
|
|
Estimated Time to Exit (in months) |
|
5 - 48 |
|
|
20 |
|
|
|
|
|
5,182 |
|
|
Other (7) |
|
|
|
|
|
|
|
|
|
Total Level Three Warrant and Equity Investments |
|
$ |
97,741 |
|
|
|
|
|
|
|
|
|
|
|
|
(1) |
The significant unobservable inputs used in the fair value measurement of the Company’s warrant and equity-related securities are revenue and/or EBITDA multiples, market equity adjustment factors, and discounts for lack of marketability. Additional inputs used in the OPM include industry volatility, risk free interest rate and estimated time to exit. Significant increases (decreases) in the inputs in isolation would result in a significantly higher (lower) fair value measurement, depending on the materiality of the investment. For some investments, additional consideration may be given to data from the last round of financing or merger/acquisition events near the measurement date. |
|
(2) |
Represents amounts used when the Company has determined that market participants would use such multiples when pricing the investments. |
|
(3) |
Represents amounts used when the Company has determined market participants would take into account these discounts when pricing the investments. |
|
(4) |
Represents the range of industry volatility used by market participants when pricing the investment. |
|
(5) |
Represents the range of changes in industry valuations since the portfolio company's last external valuation event. |
|
(6) |
Weighted averages are calculated based on the fair market value of each investment. |
|
(7) |
The fair market value of these investments is derived based on recent private market and merger and acquisition transaction prices. |
Debt Investments
The Company follows the guidance set forth in ASC Topic 820 which establishes a framework for measuring the fair value of assets and liabilities and outlines a fair value hierarchy, which prioritizes the inputs used to measure fair value and the effect of fair value measures on earnings. The Company’s debt securities are primarily invested in venture capital-backed companies in technology-related industries including technology, drug discovery and development, biotechnology, life sciences, healthcare, and sustainable and renewable technology at all stages of development. Given the nature of lending to these types of businesses, substantially all of the Company’s investments in these portfolio companies are considered Level 3 assets under ASC Topic 820 because there is no known or accessible market or market indexes for debt instruments for these investment securities to be traded or exchanged. In addition, the Company may, from time to time, invest in public debt of companies that meet the Company’s investment objectives. These investments are considered Level 2 assets.
In making a good faith determination of the value of the Company’s investments, the Company generally starts with the cost basis of the investment, which includes the value attributed to the original issue discount (“OID”), if any, and payment-in-kind (“PIK”) interest or other receivables which have been accrued as earned. The Company then applies the valuation methods as set forth below.
The Company applies a procedure for debt investments that assumes the sale of each investment in a hypothetical market to a hypothetical market participant where buyers and sellers are willing participants. The hypothetical market does not include scenarios where the underlying security was simply repaid or extinguished, but includes an exit concept. The Company determines the yield at inception for each debt investment. The Company then uses senior secured, leveraged loan yields provided by third party providers to determine the change in market yields between inception of the debt investment and the measurement date. Industry specific indices and other relevant market data are used to benchmark and assess market-based movements.
141
Under this process, the Company also evaluates the collateral for recoverability of the debt investments. The Company considers each portfolio company’s credit rating, security liens and other characteristics of the investment to adjust the baseline yield to derive a credit adjusted hypothetical yield for each investment as of the measurement date. The anticipated future cash flows from each investment are then discounted at the hypothetical yield to estimate each investment’s fair value as of the measurement date.
The Company’s process includes an analysis of, among other things, the underlying investment performance, the current portfolio company’s financial condition and market changing events that impact valuation, estimated remaining life, current market yield and interest rate spreads of similar securities as of the measurement date. The Company values its syndicated debt investments using broker quotes and bond indices amongst other factors. If there is a significant deterioration of the credit quality of a debt investment, the Company may consider other factors to estimate fair value, including the proceeds that would be received in a liquidation analysis.
The Company records unrealized depreciation on investments when it believes that an investment has decreased in value, including where collection of a debt investment is doubtful or, if under the in-exchange premise, when the value of a debt investment is less than amortized cost of the investment. Conversely, where appropriate, the Company records unrealized appreciation if it believes that the underlying portfolio company has appreciated in value and, therefore, that its investment has also appreciated in value or, if under the in-exchange premise, the value of a debt investment is greater than amortized cost.
When originating a debt instrument, the Company generally receives warrants or other equity-related securities from the borrower. The Company determines the cost basis of the warrants or other equity-related securities received based upon their respective fair values on the date of receipt in proportion to the total fair value of the debt and warrants or other equity-related securities received. Any resulting discount on the debt investments from recordation of the warrant or other equity instruments is accreted into interest income over the life of the debt investment.
Debt investments that are traded on a public exchange are valued at the prevailing market price as of the valuation date.
Equity-Related Securities and Warrants
Securities that are traded in the over-the-counter markets or on a stock exchange will be valued at the prevailing bid price at period end. The Company has a limited amount of equity securities in public companies. In accordance with the 1940 Act, unrestricted publicly traded securities for which market quotations are readily available are valued at the closing market quote on the measurement date.
The Company estimates the fair value of warrants using a Black Scholes OPM. At each reporting date, privately held warrant and equity-related securities are valued based on an analysis of various factors including, but not limited to, the portfolio company’s operating performance and financial condition and general market conditions, price to enterprise value or price to equity ratios, discounted cash flow, valuation comparisons to comparable public companies or other industry benchmarks. When an external event occurs, such as a purchase transaction, public offering, or subsequent equity sale, the pricing indicated by that external event is utilized to corroborate the Company’s valuation of the warrant and equity-related securities. The Company periodically reviews the valuation of its portfolio companies that have not been involved in a qualifying external event to determine if the enterprise value of the portfolio company may have increased or decreased since the last valuation measurement date.
Escrow Receivables
Escrow receivables are collected in accordance with the terms and conditions of the escrow agreement. Escrow balances are typically distributed over a period greater than one year and may accrue interest during the escrow period. Escrow balances are measured for collectability on at least a quarterly basis and fair value is determined based on the amount of the estimated recoverable balances and the contractual maturity date. As of December 31, 2018 there were no material past due escrow receivables.
Portfolio Composition
As required by the 1940 Act, the Company classifies its investments by level of control. “Control investments” are defined in the 1940 Act as investments in those companies that the Company is deemed to “control.” Under the 1940 Act, the Company is generally deemed to “control” a company in which it has invested if it owns 25% or more of the voting securities of such company or has greater than 50% representation on its board. “Affiliate investments” are investments in those companies that are “affiliated companies” of the Company, as defined in the 1940 Act, which are not control investments. The Company is deemed to be an “affiliate” of a company in which it has invested if it owns 5% or more, but generally less than 25%, of the voting securities of such company. “Non-control/non-affiliate investments” are investments that are neither control investments nor affiliate investments.
142
The following table summarizes the Company’s realized gains and losses and changes in unrealized appreciation and depreciation on control and affiliate investments for the years ended December 31, 2018, 2017, and 2016.
|
(in thousands) |
|
|
|
|
|
|
|
Year Ended December 31, 2018 |
|
|||||||||||||||
|
Portfolio Company |
|
Type |
|
Fair Value at December 31, 2018 |
|
|
Interest Income |
|
|
Fee Income |
|
|
Net Change in Unrealized Appreciation/ (Depreciation) |
|
|
Realized Gain/(Loss) |
|
|||||||
|
Control Investments |
|
|
|
|
|
|
|
|
|
|
|
|
|
|
|
|
|
|
|
|
|
|
||
|
Achilles Technology Management Co II, Inc. |
|
Control |
|
$ |
— |
|
|
$ |
— |
|
|
$ |
— |
|
|
$ |
2,858 |
|
|
$ |
(2,900 |
) |
||
|
Gibraltar Business Capital, LLC |
|
Control |
|
|
39,491 |
|
|
|
1,508 |
|
|
|
5 |
|
|
|
(3,244 |
) |
|
|
— |
|
||
|
Second Time Around (Simplify Holdings, LLC) |
|
Control |
|
|
— |
|
|
|
— |
|
|
|
— |
|
|
|
1,781 |
|
|
|
(1,743 |
) |
||
|
Tectura Corporation |
|
Control |
|
|
18,128 |
|
|
|
1,883 |
|
|
|
— |
|
|
|
(2,617 |
) |
|
|
335 |
|
||
|
Total Control Investments |
|
$ |
57,619 |
|
|
$ |
3,391 |
|
|
$ |
5 |
|
|
$ |
(1,222 |
) |
|
$ |
(4,308 |
) |
||||
|
|
|
|
|
|
|
|
|
|
|
|
|
|
|
|
|
|
|
|
|
|
|
|
||
|
Affiliate Investments |
|
|
|
|
|
|
|
|
|
|
|
|
|
|
|
|
|
|
|
|
|
|
||
|
Optiscan BioMedical, Corp. |
|
Affiliate |
|
$ |
6,977 |
|
|
$ |
— |
|
|
$ |
— |
|
|
$ |
65 |
|
|
$ |
(680 |
) |
||
|
Solar Spectrum Holdings LLC (p.k.a. Sungevity, Inc.) |
|
Affiliate |
|
|
14,519 |
|
|
|
2,058 |
|
|
|
336 |
|
|
|
(8,285 |
) |
|
|
— |
|
||
|
Stion Corporation |
|
Affiliate |
|
|
— |
|
|
|
— |
|
|
|
— |
|
|
|
1,378 |
|
|
|
(1,378 |
) |
||
|
Total Affiliate Investments |
|
$ |
21,496 |
|
|
$ |
2,058 |
|
|
$ |
336 |
|
|
$ |
(6,842 |
) |
|
$ |
(2,058 |
) |
||||
|
Total Control & Affiliate Investments |
|
$ |
79,115 |
|
|
$ |
5,449 |
|
|
$ |
341 |
|
|
$ |
(8,064 |
) |
|
$ |
(6,366 |
) |
||||
|
|
|
|
|
|
|
|
|
|
|
|
|
|
|
|
|
|
|
|
|
|
|
|
||
|
(in thousands) |
|
|
|
|
|
|
|
Year Ended December 31, 2017 |
|
|||||||||||||||
|
Portfolio Company |
|
Type |
|
Fair Value at December 31, 2017 |
|
|
Interest Income |
|
|
Fee Income |
|
|
Net Change in Unrealized Appreciation/ (Depreciation) |
|
|
Realized Gain/(Loss) |
|
|||||||
|
Control Investments |
|
|
|
|
|
|
|
|
|
|
|
|
|
|
|
|
|
|
|
|
|
|
||
|
Achilles Technology Management Co II, Inc. |
|
Control |
|
$ |
242 |
|
|
$ |
144 |
|
|
$ |
11 |
|
|
$ |
(2,254 |
) |
|
$ |
(486 |
) |
||
|
HercGamma, Inc. |
|
Control |
|
|
— |
|
|
|
— |
|
|
|
— |
|
|
|
— |
|
|
|
(487 |
) |
||
|
SkyCross, Inc. |
|
Control |
|
|
— |
|
|
|
— |
|
|
|
— |
|
|
|
17,294 |
|
|
|
(15,452 |
) |
||
|
Tectura Corporation |
|
Control |
|
|
19,219 |
|
|
|
1,827 |
|
|
|
— |
|
|
|
(1,028 |
) |
|
|
(51 |
) |
||
|
Second Time Around (Simplify Holdings, LLC) |
|
Control |
|
|
— |
|
|
|
— |
|
|
|
— |
|
|
|
140 |
|
|
|
— |
|
||
|
Total Control Investments |
|
$ |
19,461 |
|
|
$ |
1,971 |
|
|
$ |
11 |
|
|
$ |
14,152 |
|
|
$ |
(16,476 |
) |
||||
|
|
|
|
|
|
|
|
|
|
|
|
|
|
|
|
|
|
|
|
|
|
|
|
||
|
Affiliate Investments |
|
|
|
|
|
|
|
|
|
|
|
|
|
|
|
|
|
|
|
|
|
|
||
|
Optiscan BioMedical, Corp. |
|
Affiliate |
|
$ |
6,291 |
|
|
$ |
— |
|
|
$ |
— |
|
|
$ |
1,419 |
|
|
$ |
— |
|
||
|
Stion Corporation |
|
Affiliate |
|
|
— |
|
|
|
2 |
|
|
|
— |
|
|
|
— |
|
|
|
— |
|
||
|
Solar Spectrum Holdings LLC (p.k.a. Sungevity, Inc.) |
|
Affiliate |
|
|
25,004 |
|
|
|
799 |
|
|
|
43 |
|
|
|
(50,102 |
) |
|
|
— |
|
||
|
Total Affiliate Investments |
|
$ |
31,295 |
|
|
$ |
801 |
|
|
$ |
43 |
|
|
$ |
(48,683 |
) |
|
$ |
— |
|
||||
|
Total Control & Affiliate Investments |
|
$ |
50,756 |
|
|
$ |
2,772 |
|
|
$ |
54 |
|
|
$ |
(34,531 |
) |
|
$ |
(16,476 |
) |
||||
|
|
|
|
|
|
|
|
|
|
|
|
|
|
|
|
|
|
|
|
|
|
|
|
||
|
|
|
|
|
|
|
|
|
|
|
|
|
|
|
|
|
|
|
|
|
|
|
|
||
|
(in thousands) |
|
|
|
|
|
|
|
Year Ended December 31, 2016 |
|
|||||||||||||||
|
Portfolio Company |
|
Type |
|
Fair Value at December 31, 2016 |
|
|
Interest Income |
|
|
Fee Income |
|
|
Net Change in Unrealized Appreciation/ (Depreciation) |
|
|
Realized Gain/(Loss) |
|
|||||||
|
Control Investments |
|
|
|
|
|
|
|
|
|
|
|
|
|
|
|
|
|
|
|
|
|
|
||
|
SkyCross, Inc. |
|
Control |
|
$ |
— |
|
|
$ |
— |
|
|
$ |
— |
|
|
$ |
(3,421 |
) |
|
$ |
— |
|
||
|
Achilles Technology Management Co II, Inc. |
|
Control |
|
|
4,700 |
|
|
|
78 |
|
|
|
6 |
|
|
|
(604 |
) |
|
|
— |
|
||
|
Total Control Investments |
|
$ |
4,700 |
|
|
$ |
78 |
|
|
$ |
6 |
|
|
$ |
(4,025 |
) |
|
$ |
— |
|
||||
|
|
|
|
|
|
|
|
|
|
|
|
|
|
|
|
|
|
|
|
|
|
|
|
||
|
Affiliate Investments |
|
|
|
|
|
|
|
|
|
|
|
|
|
|
|
|
|
|
|
|
|
|
||
|
Optiscan BioMedical, Corp. |
|
Affiliate |
|
$ |
4,699 |
|
|
$ |
12 |
|
|
$ |
— |
|
|
$ |
(3,409 |
) |
|
$ |
— |
|
||
|
Stion Corporation |
|
Affiliate |
|
|
333 |
|
|
|
148 |
|
|
|
— |
|
|
|
1,187 |
|
|
|
— |
|
||
|
Total Affiliate Investments |
|
|
|
$ |
5,032 |
|
|
$ |
160 |
|
|
$ |
— |
|
|
$ |
(2,222 |
) |
|
$ |
— |
|
||
|
Total Control & Affiliate Investments |
|
$ |
9,732 |
|
|
$ |
238 |
|
|
$ |
6 |
|
|
$ |
(6,247 |
) |
|
$ |
— |
|
||||
In March 2018, the Company acquired 100% ownership in Gibraltar Business Capital LLC and classified it as a control investment in accordance with the requirements of the 1940 Act. Gibraltar Business Capital LLC is focused on providing asset-based and other secured financing solutions.
In July 2017, the Company acquired the primary assets of Second Time Around (Simplify Holdings, LLC) as part of an article 9 consensual foreclosure and public auction. These assets represent the remaining possible recovery on the Company’s debt and as such
143
this investment became classified as a control investment as of September 30, 2017. In February 2018, all material recoveries had been made and subsequently the Company’s investments were deemed wholly worthless and written off for a realized loss.
In April 2017, the Company’s investment in Solar Spectrum Holdings LLC (p.k.a. Sungevity, Inc.) became classified as a control investment as a result of obtaining more than 25% of the portfolio company’s voting securities. In April 2017, under Section 363 of the Bankruptcy Code, Sungevity, Inc. entered into a $50.0 million asset purchase agreement and DIP financing facility with a group of investors, led by Northern Pacific Group and including the Company. On April 7, 2017, the U.S. Bankruptcy Court approved the DIP financing facility and on April 17, 2017, the U.S. Bankruptcy Court approved the asset purchase agreement. On April 26, 2017, Solar Spectrum Holdings LLC, a new company backed by the investment group, announced that it had acquired certain assets of Sungevity, Inc. as part of the bankruptcy court-approved sale. As a result, the cost basis of the Company’s debt investment in Sungevity, Inc. was converted to an equity position in Solar Spectrum Holdings LLC and the Company’s warrant and equity positions in Sungevity, Inc. were written off for a realized loss.
In August 2017, the Company’s ownership in Solar Spectrum Holdings LLC was diluted below 25% as a result of additional equity contributions by other investors to fund the acquisition of Horizon Solar Power, Inc. by Solar Spectrum Holdings LLC. The Company made a $15.0 million debt investment to fund the acquisition. Accordingly, the Company’s equity and new debt investment in Solar Spectrum Holdings LLC became classified as affiliate investments as of September 30, 2017.
In January 2017, the Company’s investment in Tectura Corporation became classified as a control investment as a result of obtaining more than 50% representation on the portfolio company’s board. In March 2017, the Company’s warrants in Tectura Corporation expired and were written off for a realized loss. In May 2018, the Company purchased common shares, thereby obtaining greater than 25% of voting securities of Tectura.
In June 2016, the Company acquired 100% ownership of the equity of Achilles Technology Management Co II, Inc. and classified it as a control investment in accordance with the requirements of the 1940 Act. In August 2017, the Company’s debt investment in Achilles Technology Management II, Inc. was fully repaid by net proceeds from sales of the portfolio company’s assets. In addition, the Company’s equity investment in Achilles Technology Management II, Inc. was reduced by $900,000 in lieu of a success fee on the repayment of our debt investment. In May 2018, the Company received $375,000 as part of a legal settlement and the remaining equity investment in Achilles Technology Management II, Inc. was deemed wholly worthless and written off for realized loss.
The following table shows the fair value of the Company’s portfolio of investments by asset class as of December 31, 2018 and December 31, 2017:
|
|
|
December 31, 2018 |
|
|
December 31, 2017 |
|
||||||||||
|
(in thousands) |
|
Investments at Fair Value |
|
|
Percentage of Total Portfolio |
|
|
Investments at Fair Value |
|
|
Percentage of Total Portfolio |
|
||||
|
Senior Secured Debt with Warrants |
|
$ |
716,505 |
|
|
|
38.1 |
% |
|
$ |
880,115 |
|
|
|
57.1 |
% |
|
Senior Secured Debt |
|
|
1,029,255 |
|
|
|
54.8 |
% |
|
|
572,738 |
|
|
|
37.1 |
% |
|
Unsecured Debt |
|
|
14,401 |
|
|
|
0.8 |
% |
|
|
— |
|
|
|
— |
|
|
Preferred Stock |
|
|
68,625 |
|
|
|
3.6 |
% |
|
|
40,683 |
|
|
|
2.6 |
% |
|
Common Stock |
|
|
51,587 |
|
|
|
2.7 |
% |
|
|
48,678 |
|
|
|
3.2 |
% |
|
Total |
|
$ |
1,880,373 |
|
|
|
100.0 |
% |
|
$ |
1,542,214 |
|
|
|
100.0 |
% |
The increase in senior secured debt and the decrease in senior secured debt with warrants during the period is primarily due to an increase in new debt investments that do not include detachable equity enhancement features.
144
A summary of the Company’s investment portfolio, at value, by geographic location as of December 31, 2018 and December 31, 2017 is shown as follows:
|
|
|
December 31, 2018 |
|
|
December 31, 2017 |
|
||||||||||
|
(in thousands) |
|
Investments at Fair Value |
|
|
Percentage of Total Portfolio |
|
|
Investments at Fair Value |
|
|
Percentage of Total Portfolio |
|
||||
|
United States |
|
$ |
1,668,027 |
|
|
|
88.8 |
% |
|
$ |
1,404,235 |
|
|
|
91.1 |
% |
|
United Kingdom |
|
|
89,016 |
|
|
|
4.7 |
% |
|
|
91,105 |
|
|
|
5.9 |
% |
|
Australia |
|
|
35,190 |
|
|
|
1.9 |
% |
|
|
— |
|
|
|
0.0 |
% |
|
Netherlands |
|
|
35,854 |
|
|
|
1.9 |
% |
|
|
20,783 |
|
|
|
1.3 |
% |
|
Ireland |
|
|
24,750 |
|
|
|
1.3 |
% |
|
|
— |
|
|
|
0.0 |
% |
|
Cayman Islands |
|
|
19,650 |
|
|
|
1.0 |
% |
|
|
14,954 |
|
|
|
1.0 |
% |
|
Sweden |
|
|
5,556 |
|
|
|
0.3 |
% |
|
|
— |
|
|
|
0.0 |
% |
|
Switzerland |
|
|
1,471 |
|
|
|
0.1 |
% |
|
|
10,581 |
|
|
|
0.7 |
% |
|
Canada |
|
|
859 |
|
|
|
0.0 |
% |
|
|
556 |
|
|
|
0.0 |
% |
|
Total |
|
$ |
1,880,373 |
|
|
|
100.0 |
% |
|
$ |
1,542,214 |
|
|
|
100.0 |
% |
The following table shows the fair value of the Company’s portfolio by industry sector at December 31, 2018 and December 31, 2017:
|
|
|
December 31, 2018 |
|
|
December 31, 2017 |
|
||||||||||
|
(in thousands) |
|
Investments at Fair Value |
|
|
Percentage of Total Portfolio |
|
|
Investments at Fair Value |
|
|
Percentage of Total Portfolio |
|
||||
|
Software |
|
$ |
548,952 |
|
|
|
29.2 |
% |
|
$ |
360,123 |
|
|
|
23.4 |
% |
|
Drug Discovery & Development |
|
|
539,977 |
|
|
|
28.7 |
% |
|
|
369,173 |
|
|
|
23.9 |
% |
|
Internet Consumer & Business Services |
|
|
329,512 |
|
|
|
17.5 |
% |
|
|
154,909 |
|
|
|
10.0 |
% |
|
Medical Devices & Equipment |
|
|
121,420 |
|
|
|
6.5 |
% |
|
|
94,595 |
|
|
|
6.1 |
% |
|
Sustainable and Renewable Technology |
|
|
110,303 |
|
|
|
5.9 |
% |
|
|
118,432 |
|
|
|
7.7 |
% |
|
Healthcare Services, Other |
|
|
60,142 |
|
|
|
3.2 |
% |
|
|
72,337 |
|
|
|
4.7 |
% |
|
Drug Delivery |
|
|
40,519 |
|
|
|
2.2 |
% |
|
|
91,214 |
|
|
|
5.9 |
% |
|
Diversified Financial Services |
|
|
39,491 |
|
|
|
2.1 |
% |
|
|
— |
|
|
|
0.0 |
% |
|
Information Services |
|
|
30,940 |
|
|
|
1.6 |
% |
|
|
24,618 |
|
|
|
1.6 |
% |
|
Media/Content/Info |
|
|
21,666 |
|
|
|
1.2 |
% |
|
|
152,998 |
|
|
|
9.9 |
% |
|
Electronics & Computer Hardware |
|
|
15,763 |
|
|
|
0.8 |
% |
|
|
9,982 |
|
|
|
0.6 |
% |
|
Biotechnology Tools |
|
|
6,279 |
|
|
|
0.3 |
% |
|
|
5,604 |
|
|
|
0.4 |
% |
|
Consumer & Business Products |
|
|
6,179 |
|
|
|
0.3 |
% |
|
|
19,792 |
|
|
|
1.3 |
% |
|
Communications & Networking |
|
|
4,871 |
|
|
|
0.3 |
% |
|
|
6,649 |
|
|
|
0.4 |
% |
|
Surgical Devices |
|
|
3,088 |
|
|
|
0.2 |
% |
|
|
13,161 |
|
|
|
0.9 |
% |
|
Semiconductors |
|
|
899 |
|
|
|
0.0 |
% |
|
|
10,406 |
|
|
|
0.7 |
% |
|
Diagnostic |
|
|
348 |
|
|
|
0.0 |
% |
|
|
720 |
|
|
|
0.1 |
% |
|
Specialty Pharmaceuticals |
|
|
24 |
|
|
|
0.0 |
% |
|
|
37,501 |
|
|
|
2.4 |
% |
|
Total |
|
$ |
1,880,373 |
|
|
|
100.0 |
% |
|
$ |
1,542,214 |
|
|
|
100.0 |
% |
No single portfolio investment represents more than 10% of the fair value of the Company’s total investments as of December 31, 2018 or December 31, 2017.
Investment Collateral
In the majority of cases, the Company collateralizes its investments by obtaining a first priority security interest in a portfolio company’s assets, which may include its intellectual property. In other cases, the Company may obtain a negative pledge covering a company’s intellectual property. At December 31, 2018, approximately 85.3% of the Company’s debt investments were in a senior secured first lien position, with 48.5% secured by a first priority security in all of the assets of the portfolio company, including its intellectual property and 28.8% secured by a first priority security in all of the assets of the portfolio company and the portfolio company was prohibited from pledging or encumbering its intellectual property, 1.1% of the Company’s debt investments were senior secured by the equipment of the portfolio company and 6.9% of the Company’s debt investments were in a first lien “last-out” senior secured position with security interest in all of the assets of the portfolio company, whereby the “last-out” loans will be subordinated to the “first-out” portion of the unitranche loan in a liquidation, sale or other disposition. Another 13.8% of the Company’s debt investments were secured by a second priority security interest in the portfolio company’s assets, and 0.9% were unsecured.
145
Cash, Restricted Cash, and Cash Equivalents
Cash and cash equivalents consist solely of funds deposited with financial institutions and short-term liquid investments in money market deposit accounts. Cash and cash equivalents are carried at cost, which approximates fair value. Restricted cash and cash equivalents include amounts that are collected and are held by trustees who have been appointed as custodians of the assets securing certain of the Company’s financing transactions.
Other Assets
Other assets generally consist of prepaid expenses, deferred financing costs net of accumulated amortization, fixed assets net of accumulated depreciation, deferred revenues and deposits and other assets, including escrow receivable. The escrow receivable balance as of December 31, 2018 and December 31, 2017 was approximately $972,000 and $752,000, respectively, and was fair valued and held in accordance with ASC Topic 820.
Income Recognition
The Company records interest income on an accrual basis and recognizes it as earned in accordance with the contractual terms of the loan agreement, to the extent that such amounts are expected to be collected. OID initially represents the value of detachable equity warrants obtained in conjunction with the acquisition of debt securities and is accreted into interest income over the term of the loan as a yield enhancement. When a loan becomes 90 days or more past due, or if management otherwise does not expect that principal, interest, and other obligations due will be collected in full, the Company will generally place the loan on non-accrual status and cease recognizing interest income on that loan until all principal and interest due has been paid or the Company believes the portfolio company has demonstrated the ability to repay the Company’s current and future contractual obligations. Any uncollected interest related to prior periods is reversed from income in the period that collection of the interest receivable is determined to be doubtful. However, the Company may make exceptions to this policy if the investment has sufficient collateral value and is in the process of collection.
At December 31, 2018, the Company had two debt investments on non-accrual with a cumulative investment cost of approximately $2.7 million and a fair value of zero. At December 31, 2017, the Company had five debt investments on non-accrual with a cumulative investment cost and fair value of approximately $14.8 million and $340,000, respectively. The decrease in the cumulative cost and fair value of debt investments on non-accrual between December 31, 2018 and December 31, 2017 is the result of the liquidation of two debt investments that were on non-accrual at December 31, 2017, which resulted in a realized loss of approximately $10.3 million, slightly offset by a loan repayment in full from one debt investment.
Fee income, generally collected in advance, includes loan commitment and facility fees for due diligence and structuring, as well as fees for transaction services and management services rendered by the Company to portfolio companies and other third parties. Loan and commitment fees are amortized into income over the contractual life of the loan. Management fees are generally recognized as income when the services are rendered. Loan origination fees are capitalized and then amortized into interest income using the effective interest rate method. In certain loan arrangements, warrants or other equity interests are received from the borrower as additional origination fees. The Company had approximately $36.3 million of unamortized fees at December 31, 2018, of which approximately $31.1 million was included as an offset to the cost basis of its current debt investments and approximately $5.2 million was deferred contingent upon the occurrence of a funding or milestone. At December 31, 2017, the Company had approximately $33.3 million of unamortized fees, of which approximately $29.3 million was included an offset to the cost basis of the Company’s current debt investments and approximately $4.0 million was deferred contingent upon the occurrence of a funding or milestone.
The Company recognizes nonrecurring fees amortized over the remaining term of the loan commencing in the quarter relating to specific loan modifications. Certain fees may still be recognized as one-time fee income, including prepayment penalties, fees related to select covenant default waiver fees and acceleration of previously deferred loan fees and OID related to early loan pay-off or material modification of the specific debt outstanding. The Company recorded approximately $7.9 million and $8.5 million in one-time fee income during the years ended December 31, 2018 and December 31, 2017, respectively.
In addition, the Company may also be entitled to an exit fee that is amortized into income over the life of the loan. Loan exit fees to be paid at the termination of the loan are accreted into interest income over the contractual life of the loan. At December 31, 2018, the Company had approximately $25.6 million in exit fees receivable, of which approximately $23.3 million was included as a component of the cost basis of its current debt investments and approximately $2.3 million was deferred related to expired commitments. At December 31, 2017, the Company had approximately $27.5 million in exit fees receivable, of which approximately $23.9 million was included as an offset to the cost basis of the Company’s current debt investments and approximately $3.6 million was deferred related to expired commitments.
146
The Company has debt investments in its portfolio that contain a PIK provision. Contractual PIK interest, which represents contractually deferred interest added to the loan balance that is generally due at the end of the loan term, is generally recorded on an accrual basis to the extent such amounts are expected to be collected. The Company will generally cease accruing PIK interest if there is insufficient value to support the accrual or management does not expect the portfolio company to be able to pay all principal and interest due. The Company recorded approximately $9.4 million and $10.0 million in PIK income in the years ended December 31, 2018 and 2017, respectively.
To maintain the Company’s ability to be subject to tax as a RIC, PIK and exit fee income generally must be accrued and distributed to stockholders in the form of dividends for U.S. federal income tax purposes even though the cash has not yet been collected. Amounts necessary to pay these distributions may come from available cash or the liquidation of certain investments.
In certain investment transactions, the Company may provide advisory services. For services that are separately identifiable and external evidence exists to substantiate fair value, income is recognized as earned, which is generally when the investment transaction closes. The Company had no income from advisory services in the years ended December 31, 2018 and December 31, 2017.
Equity Offering Expenses
The Company’s offering costs are charged against the proceeds from equity offerings when received.
Stock Based Compensation
The Company has issued and may, from time to time, issue stock options and restricted stock to employees under the 2018 Equity Incentive Plan and the Director Plan. Management follows the guidelines set forth under ASC Topic 718, to account for stock options granted. Under ASC Topic 718, compensation expense associated with stock-based compensation is measured at the grant date based on the fair value of the award and is recognized over the vesting period. Determining the appropriate fair value model and calculating the fair value of stock-based awards at the grant date requires judgment, including estimating stock price volatility, forfeiture rate and expected option life.
Income Taxes
The Company intends to operate so as to qualify to be subject to tax as a RIC under Subchapter M of the Code and, as such, will not be subject to federal income tax on the portion of taxable income (including gains) distributed as dividends for U.S. federal income tax purposes to stockholders. Taxable income includes the Company’s taxable interest, dividend and fee income, reduced by certain deductions, as well as taxable net realized securities gains. Taxable income generally differs from net income for financial reporting purposes due to temporary and permanent differences in the recognition of income and expenses, and generally excludes net unrealized appreciation or depreciation, as such gains or losses are not included in taxable income until they are realized.
As a RIC, the Company will be subject to a 4% nondeductible U.S. federal excise tax on certain undistributed income unless the Company makes distributions treated as dividends for U.S. federal income tax purposes in a timely manner to its stockholders in respect of each calendar year of an amount at least equal to the Excise Tax Avoidance Requirement. The Company will not be subject to this excise tax on any amount on which the Company incurred U.S. federal corporate income tax (such as the tax imposed on a RIC’s retained net capital gains).
Depending on the level of taxable income earned in a taxable year, the Company may choose to carry over taxable income in excess of current taxable year distributions treated as dividends for U.S. federal income tax purposes from such taxable income into the next taxable year and incur a 4% excise tax on such taxable income, as required. The maximum amount of excess taxable income that may be carried over for distribution in the next taxable year under the Code is the total amount of distributions treated as dividends for U.S. federal income tax purposes paid in the following taxable year, subject to certain declaration and payment guidelines. To the extent the Company chooses to carry over taxable income into the next taxable year, distributions declared and paid by the Company in a taxable year may differ from the Company’s taxable income for that taxable year as such distributions may include the distribution of current taxable year taxable income, the distribution of prior taxable year taxable income carried over into and distributed in the current taxable year, or returns of capital.
The Company intends to distribute 100% of our spillover earnings from ordinary income for the taxable year ended December 31, 2018 to our stockholders during 2019. The Company distributed 100% of our spillover earnings from ordinary income for our taxable year ended December 31, 2017 to our stockholders during 2018.
147
Because federal income tax regulations differ from accounting principles generally accepted in the United States, distributions in accordance with tax regulations may differ from net investment income and net realized securities gains recognized for financial reporting purposes. Differences may be permanent or temporary. Permanent differences are reclassified among capital accounts in the financial statements to reflect their appropriate tax character. Permanent differences may also result from the change in the classification of certain items, such as the treatment of short-term gains as ordinary income for tax purposes. Temporary differences arise when certain items of income, expense, gain or loss are recognized at some time in the future. Also, recent tax legislation requires that income be recognized for tax purposes no later than when recognized for financial reporting purposes.
Earnings Per Share (“EPS”)
Basic EPS is calculated by dividing net earnings applicable to common shareholders by the weighted average number of common shares outstanding. Common shares outstanding includes common stock and restricted stock for which no future service is required as a condition to the delivery of the underlying common stock. Diluted EPS includes the determinants of basic EPS and, in addition, reflects the dilutive effect of the common stock deliverable pursuant to stock options and to restricted stock for which future service is required as a condition to the delivery of the underlying common stock.
Comprehensive Income
The Company reports all changes in comprehensive income in the Consolidated Statement of Operations. The Company did not have other comprehensive income in 2018, 2017, or 2016. The Company’s comprehensive income is equal to its net increase in net assets resulting from operations.
Distributions
Distributions to common stockholders are approved by the Board of Directors on a quarterly basis and the distribution payable is recorded on the ex-dividend date.
The Company maintains an “opt out” dividend reinvestment plan that provides for reinvestment of the Company’s distribution on behalf of the Company’s stockholders, unless a stockholder elects to receive cash. As a result, if the Company declares a distribution, cash distributions will be automatically reinvested in additional shares of its common stock unless the stockholder specifically “opts out” of the dividend reinvestment plan and chooses to receive cash distributions. During 2018, 2017, and 2016, the Company issued 159,560, 163,584, and 144,308 shares, respectively, of common stock to shareholders in connection with the dividend reinvestment plan.
Segments
The Company lends to and invests in portfolio companies in various technology-related industries including technology, drug discovery and development, biotechnology, life sciences, healthcare, and sustainable and renewable technology. The Company separately evaluates the performance of each of its lending and investment relationships. However, because each of these loan and investment relationships has similar business and economic characteristics, they have been aggregated into a single lending and investment segment.
Recent Accounting Pronouncements
In January 2016, the FASB issued Accounting Standards Update (“ASU”) 2016-01, “Financial Instruments – Overall (Subtopic 825-10): Recognition and Measurement of Financial Assets and Financial Liabilities,” which, among other things, requires that (i) all equity investments, other than equity-method investments, in unconsolidated entities generally be measured at fair value through earnings and (ii) an entity to present separately in other comprehensive income the portion of the total change in the fair value of a liability resulting from a change in the instrument-specific credit risk when the entity has elected to measure the liability at fair value in accordance with the fair value option for financial instruments. Additionally, the ASU changes the disclosure requirements for financial instruments. ASU 2016-01 is effective for annual reporting periods, and the interim periods within those periods, beginning after December 15, 2017. The Company has adopted this standard, which did not have a material impact, on its consolidated financial statements and related disclosures for the periods presented.
In February 2016, the FASB issued ASU 2016-02, “Leases (Topic 842),” which, among other things, requires recognition of lease assets and lease liabilities by lessees for those leases classified as operating leases under previous U.S. GAAP. Additionally, the ASU requires the classification of all cash payments on leases within operating activities in the Consolidated Statement of Cash Flows. ASU 2016-02 is effective for annual reporting periods, and the interim periods within those periods, beginning after December 15, 2018. Early adoption is permitted. The Company anticipates an increase in the recognition of right-of-use assets and lease liabilities, however, the Company does not believe that ASU 2016-02 will have a material impact on its consolidated financial statements and disclosures.
148
In August 2016, the FASB issued ASU 2016-15, “Statement of Cash Flows (Topic 230): Classification of Certain Cash Receipts and Cash Payments,” which addresses eight specific cash flow issues including, among other things, the classification of debt prepayment or debt extinguishment costs. ASU 2016-15 is effective for annual reporting periods, and the interim periods within those periods, beginning after December 15, 2017. The Company has adopted this standard, which did not have a material impact, on its consolidated financial statements and related disclosures for the periods presented.
In November 2016, the FASB issued ASU 2016-18, “Statement of Cash Flows (Topic 230),” which requires that a statement of cash flows explain the change during the period in the total of cash, cash equivalents, and amounts generally described as restricted cash or restricted cash equivalents. Therefore, amounts generally described as restricted cash and restricted cash equivalents should be included with cash and cash equivalents when reconciling the beginning-of-period and end-of-period total amounts shown on the statement of cash flows. The new guidance is effective for interim and annual periods beginning after December 15, 2017. The Company has adopted this standard, which did not have a material impact, on its consolidated financial statements and related disclosures for the periods presented.
In June 2018, the FASB issued ASU 2018-07, “Compensation - Stock Compensation (Topic 718): Improvements to Nonemployee Share-Based Payment Accounting”. This amendment expands the scope of Topic 718, Compensation—Stock Compensation (which currently only includes share-based payments to employees) to include share-based payments issued to nonemployees for goods or services. Consequently, the accounting for share-based payments to nonemployees and employees will be substantially aligned. ASU 2018-07 supersedes Subtopic 505-50, Equity—Equity-Based Payments to Non-Employees and is effective for annual reporting periods, and the interim periods within those periods, beginning after December 15, 2018. The Company does not believe that ASU 2018-07 will have a material impact on its consolidated financial statements and disclosures.
In August 2018, the FASB issued ASU 2018-13, “Fair Value Measurement (Topic 820): Disclosure Framework – Changes to Disclosure Requirements for Fair Value Measurement”, which is intended to improve the effectiveness of fair value measurement disclosures. The amendment, among other things, affects certain disclosure requirements related to transfers between level 1 and level 2 of the fair value hierarchy, and level 3 fair value measurements as they relate to valuation process, unrealized gains and losses, measurement uncertainty, and significant unobservable inputs. The new guidance is effective for interim and annual periods beginning after December 15, 2019. Early adoption is permitted for any interim or annual period. The Company does not believe that ASU 2018-13 will have a material impact on its consolidated financial statements and disclosures.
In August 2018, the SEC issued Final Rule Release No. 33-10532 - “Disclosure Update and Simplification.” This rule amends various SEC disclosure requirements that have been determined to be redundant, duplicative, overlapping, outdated, or superseded. The changes are generally expected to reduce or eliminate certain disclosures; however, the amendments did expand interim period disclosure requirements related to changes in stockholders' equity. This final rule is effective on November 5, 2018. The Company has adopted these amendments as currently required and these are reflected in its consolidated financial statements and related disclosures. Certain prior year information has been adjusted to conform with these amendments.
3. Fair Value of Financial Instruments
Fair value estimates are made at discrete points in time based on relevant information. These estimates may be subjective in nature and involve uncertainties and matters of significant judgment and, therefore, cannot be determined with precision. The Company believes that the carrying amounts of its financial instruments, consisting of cash and cash equivalents, receivables including escrow receivables, accounts payable and accrued liabilities, approximate the fair values of such items due to the short maturity of such instruments. The borrowings of the Company are recorded at amortized cost and not at fair value on the Consolidated Statement of Assets and Liabilities. The fair value of the Company’s outstanding borrowings is based on observable market trading prices or quotations and unobservable market rates as applicable for each instrument.
Based on market quotations on or around December 31, 2018, the 2022 Notes, 2027 Asset-Backed Notes, and 2022 Convertible Notes were quoted for 0.976, 1.006 and 0.946 per dollar at par value, respectively. At December 31, 2018, the 2024 Notes, 2025 Notes, and 2033 Notes were trading on the NYSE for $25.28, $24.05 and $23.35 per unit at par value, respectively. The par value at underwriting for the 2024 Notes, 2025 Notes, and 2033 Notes was $25.00 per unit. Calculated based on the net present value of payments over the term of the notes using estimated market rates for similar notes and remaining terms, the fair value of the SBA debentures is approximately $150.4 million, compared to the principal amount of $149.0 million as of December 31, 2018. The fair value of the outstanding borrowings under the Union Bank Facility and the Wells Facility is equal to their principal outstanding balances as of December 31, 2018.
See the accompanying Consolidated Schedule of Investments for the fair value of the Company’s investments. The methodology for the determination of the fair value of the Company’s investments is discussed in Note 2.
149
The following tables provide additional information about the fair value and level in the fair value hierarchy of the Company’s outstanding borrowings at December 31, 2018 and December 31, 2017:
|
(in thousands) |
|
|
|
|
|
Identical Assets |
|
|
Observable Inputs |
|
|
Unobservable Inputs |
|
|||
|
Description |
|
December 31, 2018 |
|
|
(Level 1) |
|
|
(Level 2) |
|
|
(Level 3) |
|
||||
|
SBA Debentures |
|
$ |
150,387 |
|
|
$ |
— |
|
|
$ |
— |
|
|
$ |
150,387 |
|
|
2022 Notes |
|
|
146,385 |
|
|
|
— |
|
|
|
146,385 |
|
|
|
— |
|
|
2024 Notes |
|
|
84,445 |
|
|
|
— |
|
|
|
84,445 |
|
|
|
— |
|
|
2025 Notes |
|
|
72,150 |
|
|
|
— |
|
|
|
72,150 |
|
|
|
— |
|
|
2033 Notes |
|
|
37,360 |
|
|
|
— |
|
|
|
37,360 |
|
|
|
— |
|
|
2027 Asset-Backed Notes |
|
|
201,188 |
|
|
|
— |
|
|
|
201,188 |
|
|
|
— |
|
|
2022 Convertible Notes |
|
|
217,672 |
|
|
|
— |
|
|
|
217,672 |
|
|
|
— |
|
|
Union Facility |
|
|
39,849 |
|
|
|
— |
|
|
|
— |
|
|
|
39,849 |
|
|
Wells Facility |
|
|
13,107 |
|
|
|
— |
|
|
|
— |
|
|
|
13,107 |
|
|
Total |
|
$ |
962,543 |
|
|
$ |
— |
|
|
$ |
759,200 |
|
|
$ |
203,343 |
|
|
(in thousands) |
|
|
|
|
|
Identical Assets |
|
|
Observable Inputs |
|
|
Unobservable Inputs |
|
|||
|
Description (1) |
|
December 31, 2017 |
|
|
(Level 1) |
|
|
(Level 2) |
|
|
(Level 3) |
|
||||
|
SBA Debentures |
|
$ |
198,038 |
|
|
$ |
— |
|
|
$ |
— |
|
|
$ |
198,038 |
|
|
2022 Notes |
|
|
152,091 |
|
|
|
— |
|
|
|
152,091 |
|
|
|
— |
|
|
2024 Notes |
|
|
188,061 |
|
|
|
— |
|
|
|
188,061 |
|
|
|
— |
|
|
2021 Asset-Backed Notes (2) |
|
|
49,199 |
|
|
|
— |
|
|
|
49,199 |
|
|
|
— |
|
|
2022 Convertible Notes |
|
|
236,470 |
|
|
|
— |
|
|
|
236,470 |
|
|
|
— |
|
|
Total |
|
$ |
823,859 |
|
|
$ |
— |
|
|
$ |
625,821 |
|
|
$ |
198,038 |
|
|
(1) |
As of December 31, 2017, there were no borrowings outstanding on both the Well Facility and Union Facility. |
|
(2) |
The 2021 Asset-Backed Notes were fully repaid as of October 16, 2018. |
4. Borrowings
Outstanding Borrowings
At December 31, 2018 and December 31, 2017, the Company had the following available and outstanding borrowings:
|
|
|
December 31, 2018 |
|
|
December 31, 2017 |
|
||||||||||||||||||
|
(in thousands) |
|
Total Available |
|
|
Principal |
|
|
Carrying Value (1) |
|
|
Total Available |
|
|
Principal |
|
|
Carrying Value (1) |
|
||||||
|
SBA Debentures (2) |
|
$ |
149,000 |
|
|
$ |
149,000 |
|
|
$ |
147,655 |
|
|
$ |
190,200 |
|
|
$ |
190,200 |
|
|
$ |
188,141 |
|
|
2022 Notes |
|
|
150,000 |
|
|
|
150,000 |
|
|
|
147,990 |
|
|
|
150,000 |
|
|
|
150,000 |
|
|
|
147,572 |
|
|
2024 Notes |
|
|
83,510 |
|
|
|
83,510 |
|
|
|
81,852 |
|
|
|
183,510 |
|
|
|
183,510 |
|
|
|
179,001 |
|
|
2025 Notes |
|
|
75,000 |
|
|
|
75,000 |
|
|
|
72,590 |
|
|
|
— |
|
|
|
— |
|
|
|
— |
|
|
2033 Notes |
|
|
40,000 |
|
|
|
40,000 |
|
|
|
38,427 |
|
|
|
— |
|
|
|
— |
|
|
|
— |
|
|
2021 Asset-Backed Notes (3) |
|
|
— |
|
|
|
— |
|
|
|
— |
|
|
|
49,153 |
|
|
|
49,153 |
|
|
|
48,650 |
|
|
2027 Asset-Backed Notes |
|
|
200,000 |
|
|
|
200,000 |
|
|
|
197,265 |
|
|
|
— |
|
|
|
— |
|
|
|
— |
|
|
2022 Convertible Notes |
|
|
230,000 |
|
|
|
230,000 |
|
|
|
225,051 |
|
|
|
230,000 |
|
|
|
230,000 |
|
|
|
223,488 |
|
|
Wells Facility (4) |
|
|
75,000 |
|
|
|
13,107 |
|
|
|
13,107 |
|
|
|
120,000 |
|
|
|
— |
|
|
|
— |
|
|
Union Bank Facility (4) |
|
|
100,000 |
|
|
|
39,849 |
|
|
|
39,849 |
|
|
|
75,000 |
|
|
|
— |
|
|
|
— |
|
|
Total |
|
$ |
1,102,510 |
|
|
$ |
980,466 |
|
|
$ |
963,786 |
|
|
$ |
997,863 |
|
|
$ |
802,863 |
|
|
$ |
786,852 |
|
|
(1) |
Except for the Wells Facility and Union Bank Facility, all carrying values represent the principal amount outstanding less the remaining unamortized debt issuance costs and unaccreted premium or discount, if any, associated with the loan as of the balance sheet date. |
|
(2) |
At December 31, 2018, the total available borrowings under the SBA debentures were $149.0 million all of which were available in HT III. On July 13, 2018, the Company completed repayment of the remaining outstanding HT II debentures and subsequently surrendered the SBA license with respect to HT II. At December 31, 2017, the total available borrowings under the SBA debentures were $190.2 million, of which $41.2 million was available in HT II and $149.0 million was available in HT III. |
|
(3) |
The 2021 Asset-Backed Notes were fully repaid as of October 16, 2018. |
|
(4) |
Availability subject to us meeting the borrowing base requirements. On July 31, 2018, the Wells Facility was reduced to $75.0 million as we fully repaid the pro-rata portion of outstanding balances of Alostar Bank of Commerce and Everbank Commercial Finance Inc. On May 25, 2018, the Company entered into an amendment to the Union Bank Facility to increase the commitments thereunder from $75.0 million to $100.0 million. See “Note 4 – Borrowings”. |
150
Debt issuance costs are fees and other direct incremental costs incurred by the Company in obtaining debt financing and are recognized as prepaid expenses and amortized over the life of the related debt instrument using the effective yield method or the straight-line method, which closely approximates the effective yield method. In accordance with ASC Subtopic 835-30 (“Interest – Imputation of Interest”), debt issuance costs are presented as a reduction to the associated liability balance on the Consolidated Statement of Assets and Liabilities, except for debt issuance costs associated with line-of-credit arrangements. Debt issuance costs, net of accumulated amortization, as of December 31, 2018 and December 31, 2017 were as follows:
|
(in thousands) |
|
December 31, 2018 |
|
|
December 31, 2017 |
|
||
|
SBA Debentures |
|
$ |
1,345 |
|
|
$ |
2,059 |
|
|
2022 Notes |
|
|
1,379 |
|
|
|
1,633 |
|
|
2024 Notes |
|
|
1,686 |
|
|
|
4,591 |
|
|
2025 Notes |
|
|
2,410 |
|
|
|
— |
|
|
2033 Notes |
|
|
1,573 |
|
|
|
— |
|
|
2021 Asset-Backed Notes (1) |
|
|
— |
|
|
|
503 |
|
|
2027 Asset-Backed Notes |
|
|
2,735 |
|
|
|
— |
|
|
2022 Convertible Notes |
|
|
2,823 |
|
|
|
3,715 |
|
|
Wells Facility (2) |
|
|
100 |
|
|
|
227 |
|
|
Union Bank Facility (2) |
|
|
165 |
|
|
|
379 |
|
|
Total |
|
$ |
14,216 |
|
|
$ |
13,107 |
|
|
(2) |
As the Wells Facility and Union Bank Facility are line-of-credit arrangements, the debt issuance costs associated with these instruments are presented separately as an asset on the Consolidated Statement of Assets and Liabilities in accordance with ASC Subtopic 835-30. |
Long-Term SBA Debentures
On September 27, 2006, HT II received a license to operate as a SBIC under the SBIC program and was able to borrow funds from the SBA against eligible investments and additional contributions to regulatory capital. On July 13, 2018, the Company completed repayment of the remaining outstanding HT II debentures and subsequently surrendered the SBA license with respect to HT II. Prior to repayment of debentures and surrender of the license, HT II had paid the SBA commitment fees and facility fees of approximately $1.5 million and $3.6 million, respectively.
On May 26, 2010, HT III received a license to operate as a SBIC under the SBIC program in which HT III can borrow funds from the SBA against eligible investments and additional contributions to regulatory capital. With the Company’s net investment of $74.5 million in HT III as of December 31, 2018, HT III has the capacity to issue a total of $149.0 million of SBA guaranteed debentures, subject to SBA approval, of which $149.0 million was outstanding as of December 31, 2018. As of December 31, 2018, HT III has paid the SBA commitment fees and facility fees of approximately $1.5 million and $3.6 million, respectively. As of December 31, 2018, the Company held investments in HT III in 49 companies with a fair value of approximately $244.4 million, accounting for approximately 13.0% of the Company’s total investment portfolio at December 31, 2018. HT III held approximately $307.5 million in assets and accounted for approximately 14.3% of the Company’s total assets prior to consolidation at December 31, 2018.
SBICs are designed to stimulate the flow of private equity capital to eligible small businesses. Under present SBA regulations, eligible small businesses include businesses that have a tangible net worth not exceeding $19.5 million and have average annual fully taxed net income not exceeding $6.5 million for the two most recent fiscal years. In addition, SBICs must devote 25.0% of its investment activity to “smaller” enterprises as defined by the SBA. A smaller enterprise is one that has a tangible net worth not exceeding $6.0 million and has average annual fully taxed net income not exceeding $2.0 million for the two most recent fiscal years. SBA regulations also provide alternative size standard criteria to determine eligibility, which depend on the industry in which the business is engaged and are based on such factors as the number of employees and gross sales. According to SBA regulations, SBICs may make long-term loans to small businesses, invest in the equity securities of such businesses and provide them with consulting and advisory services. Through the Company’s wholly-owned subsidiary HT III, the Company plans to provide long-term loans to qualifying small businesses, and in connection therewith, make equity investments.
HT III is periodically examined and audited by the SBA’s staff to determine its compliance with SBA regulations. If HT III fails to comply with applicable SBA regulations, the SBA could, depending on the severity of the violation, limit or prohibit HT III’s use of debentures, declare outstanding debentures immediately due and payable, and/or limit HT III from making new investments. In addition, HT III may also be limited in its ability to make distributions to the Company if they do not have sufficient capital in accordance with SBA regulations. Such actions by the SBA would, in turn, negatively affect the Company because HT III is the Company’s wholly owned subsidiary. HT III was in compliance with the terms of the SBIC’s leverage as of December 31, 2018 as a result of having sufficient capital as defined under the SBA regulations.
151
The rates of borrowings under various draws from the SBA beginning in March 2009 are set semiannually in March and September and range from 2.25% to 4.62% excluding annual fees. Interest payments on SBA debentures are payable semiannually. There are no principal payments required on these issues prior to maturity and no prepayment penalties. Debentures under the SBA generally mature ten years after being borrowed. Based on the initial draw down date of September 2010 for HT III, the initial maturity of the SBA debentures will occur in September 2020. In addition, the SBA charges a fee that is set annually, depending on the Federal fiscal year the leverage commitment was delegated by the SBA, regardless of the date that the leverage was drawn by the SBIC. The annual fees related to HT III debentures that pooled on March 27, 2013 were 0.804%. The annual fees on other debentures have been set at 0.515%. The rates of borrowings on the Company’s outstanding SBA debentures range from 3.05% to 4.37% when including these annual fees.
On July 13, 2018, the Company completed repayment of the remaining outstanding HT II debentures and subsequently surrendered the SBA license with respect to HT II. The average amount of debentures outstanding for the year ended December 31, 2018 for HT III was approximately $149.0 million with an average interest rate of approximately 3.43%.
For the years ended December 31, 2018, 2017 and 2016, the components of interest expense and related fees and cash paid for interest expense for the SBA debentures are as follows:
|
|
|
Year Ended December 31, |
|
|||||||||
|
(in thousands) |
|
2018 |
|
|
2017 |
|
|
2016 |
|
|||
|
Interest expense |
|
$ |
6,370 |
|
|
$ |
6,969 |
|
|
$ |
6,988 |
|
|
Amortization of debt issuance cost (loan fees) |
|
|
714 |
|
|
|
640 |
|
|
|
671 |
|
|
Total interest expense and fees |
|
$ |
7,084 |
|
|
$ |
7,609 |
|
|
$ |
7,659 |
|
|
Cash paid for interest expense |
|
$ |
6,942 |
|
|
$ |
6,942 |
|
|
$ |
6,961 |
|
At December 31, 2018, with the Company’s net investment of $74.5 million, HT III has the capacity to issue $149.0 million of SBA-guaranteed debentures which is subject to SBA approval. The Company has issued $149.0 million in SBA-guaranteed debentures in the Company’s SBIC subsidiaries.
The Company reported the following SBA debentures outstanding principal balances as of December 31, 2018 and 2017:
|
(in thousands) Issuance/Pooling Date |
|
Maturity Date |
|
Interest Rate (1) |
|
|
December 31, 2018 |
|
|
December 31, 2017 |
|
|||
|
March 25, 2009 |
|
March 1, 2019 |
|
5.53% |
|
|
$ |
— |
|
|
$ |
18,400 |
|
|
|
September 23, 2009 |
|
September 1, 2019 |
|
4.64% |
|
|
|
— |
|
|
|
3,400 |
|
|
|
September 22, 2010 |
|
September 1, 2020 |
|
3.62% |
|
|
|
— |
|
|
|
6,500 |
|
|
|
September 22, 2010 |
|
September 1, 2020 |
|
3.50% |
|
|
|
10,000 |
|
|
|
22,900 |
|
|
|
March 29, 2011 |
|
March 1, 2021 |
|
4.37% |
|
|
|
28,750 |
|
|
|
28,750 |
|
|
|
September 21, 2011 |
|
September 1, 2021 |
|
3.16% |
|
|
|
25,000 |
|
|
|
25,000 |
|
|
|
March 21, 2012 |
|
March 1, 2022 |
|
3.28% |
|
|
|
25,000 |
|
|
|
25,000 |
|
|
|
March 21, 2012 |
|
March 1, 2022 |
|
3.05% |
|
|
|
11,250 |
|
|
|
11,250 |
|
|
|
September 19, 2012 |
|
September 1, 2022 |
|
3.05% |
|
|
|
24,250 |
|
|
|
24,250 |
|
|
|
March 27, 2013 |
|
March 1, 2023 |
|
3.16% |
|
|
|
24,750 |
|
|
|
24,750 |
|
|
|
Total SBA Debentures |
|
|
|
|
|
|
|
$ |
149,000 |
|
|
$ |
190,200 |
|
|
(1) |
Interest rate includes annual charge. |
152
In April and July 2012, the Company issued $84.5 million in aggregate principal amount of 7.00% notes due 2019 (the “April 2019 Notes”). In September and October 2012, the Company issued $85.9 million in aggregate principal amount of 7.00% notes due 2019 (the “September 2019 Notes”). The April 2019 Notes and September 2019 Notes are together referred to as the “2019 Notes.”
In April 2015, the Company redeemed $20.0 million of the $84.5 million issued and outstanding aggregate principal amount of April 2019 Notes, as previously approved by the Board of Directors. In December 2015, the Company redeemed $40.0 million of the $85.9 million issued and outstanding aggregate principal amount of September 2019 Notes, as previously approved by the Board of Directors. The remaining 2019 Notes were fully redeemed on February 24, 2017.
For the years ended December 31, 2018, 2017 and 2016, the components of interest expense and related fees and cash paid for interest expense for the 2019 Notes are as follows:
|
|
|
Year Ended December 31, |
|
|||||||||
|
(in thousands) |
|
2018 |
|
|
2017 |
|
|
2016 |
|
|||
|
Interest expense |
|
$ |
— |
|
|
$ |
1,159 |
|
|
$ |
7,725 |
|
|
Amortization of debt issuance cost (loan fees) |
|
|
— |
|
|
|
1,546 |
|
|
|
639 |
|
|
Total interest expense and fees |
|
$ |
— |
|
|
$ |
2,705 |
|
|
$ |
8,364 |
|
|
Cash paid for interest expense |
|
$ |
— |
|
|
$ |
1,911 |
|
|
$ |
7,726 |
|
2022 Notes
On October 23, 2017, the Company issued $150.0 million in aggregate principal amount of the 2022 Notes. The 2022 Notes were issued pursuant to the Fourth Supplemental Indenture to the Base Indenture, dated October 23, 2017 (the “2022 Notes Indenture”), between the Company and U.S. Bank, National Association, as trustee (the “2022 Trustee”). The sale of the 2022 Notes generated net proceeds of approximately $147.4 million, including a public offering discount of $826,500. Aggregate estimated offering expenses in connection with the transaction, including the underwriter’s discounts and commissions of approximately $975,000, were approximately $1.8 million.
The 2022 Notes mature on October 23, 2022, unless previously repurchased in accordance with their terms. The 2022 Notes bear interest at a rate of 4.625% per year payable semiannually in arrears on April 23 and October 23 of each year, commencing on April 23, 2018.
The 2022 Notes are unsecured obligations of the Company that rank senior in right of payment to all of the Company’s existing and future indebtedness that is expressly subordinated, or junior, in right of payment to the 2022 Notes. The 2022 Notes are not guaranteed by any of the Company’s current or future subsidiaries. The 2022 Notes rank pari passu, or equally, in right of payment with all of the Company’s existing and future liabilities that are not so subordinated, or junior. The 2022 Notes effectively rank subordinated, or junior, to any of the Company’s secured indebtedness (including unsecured indebtedness that the Company later secures) to the extent of the value of the assets securing such indebtedness. The 2022 Notes rank structurally subordinated, or junior, to all existing and future indebtedness (including trade payables) incurred by subsidiaries, financing vehicles or similar facilities of the Company.
The Company may redeem some or all of the 2022 Notes at any time, or from time to time, at the redemption price set forth under the terms of the indenture after September 23, 2022. No sinking fund is provided for the 2022 Notes. The 2022 Notes were issued in denominations of $2,000 and integral multiples of $1,000 thereof. As of December 31, 2018, the Company was in compliance with the terms of the 2022 Notes Indenture.
As of December 31, 2018 and December 31, 2017, the components of the carrying value of the 2022 Notes were as follows:
|
(in thousands) |
|
December 31, 2018 |
|
|
December 31, 2017 |
|
||
|
Principal amount of debt |
|
$ |
150,000 |
|
|
$ |
150,000 |
|
|
Unamortized debt issuance cost |
|
|
(1,379 |
) |
|
|
(1,633 |
) |
|
Original issue discount, net of accretion |
|
|
(631 |
) |
|
|
(795 |
) |
|
Carrying value of 2022 Notes |
|
$ |
147,990 |
|
|
$ |
147,572 |
|
153
For the years ended December 31, 2018, 2017 and 2016, the components of interest expense and related fees and cash paid for interest expense for the 2022 Notes are as follows:
|
|
|
Year Ended December 31, |
|
|||||||||
|
(in thousands) |
|
2018 |
|
|
2017 |
|
|
2016 |
|
|||
|
Interest expense |
|
$ |
6,938 |
|
|
$ |
1,305 |
|
|
$ |
— |
|
|
Amortization of debt issuance cost (loan fees) |
|
|
351 |
|
|
|
49 |
|
|
|
— |
|
|
Accretion of original issue discount |
|
|
165 |
|
|
|
31 |
|
|
|
— |
|
|
Total interest expense and fees |
|
$ |
7,454 |
|
|
$ |
1,385 |
|
|
$ |
— |
|
|
Cash paid for interest expense |
|
$ |
6,938 |
|
|
$ |
— |
|
|
$ |
— |
|
2024 Notes
On July 14, 2014, the Company and U.S. Bank, N.A. (the “2024 Trustee”), entered into the Third Supplemental Indenture (the “Third Supplemental Indenture”) to the Base Indenture between the Company and the 2024 Trustee, dated July 14, 2014, relating to the Company’s issuance, offer and sale of $100.0 million aggregate principal amount the 2024 Notes. On August 6, 2014, the underwriters issued notification to exercise their over-allotment option for an additional $3.0 million in aggregate principal amount of the 2024 Notes.
On May 2, 2016, the Company closed an underwritten public offering of an additional $72.9 million in aggregate principal amount of the 2024 Notes. The $72.9 million in aggregate principal amount includes $65.4 million from the initial offering on April 21, 2016 and $7.5 million as a result of underwriters exercising a portion of their option to purchase up to an additional $9.8 million in aggregate principal to cover overallotments on April 29, 2016.
On June 27, 2016, the Company closed an underwritten public offering of an additional $60.0 million in aggregate principal amount of the 2024 Notes. On June 30, 2016, the underwriters exercised their option to purchase up to an additional $9.0 million in aggregate principal to cover overallotments, resulting in total aggregate principal of $69.0 million from the offering.
On October 11, 2016, the Company entered into a debt distribution agreement, pursuant to which it may offer for sale, from time to time, up to $150.0 million in aggregate principal amount of 2024 Notes through FBR Capital Markets & Co. acting as its sales agent (the “2024 Notes Agent”). Sales of the 2024 Notes may be made in negotiated transactions or transactions that are deemed to be “at the market offerings” as defined in Rule 415 under the Securities Act, including sales made directly on the NYSE, or similar securities exchange or sales made through a market maker other than on an exchange at prices related to prevailing market prices or at negotiated prices.
The 2024 Notes Agent receives a commission from the Company equal to up to 2.00% of the gross sales of any 2024 Notes sold through the 2024 Notes Agent under the debt distribution agreement. The 2024 Notes Agent is not required to sell any specific principal amount of the 2024 Notes, but will use its commercially reasonable efforts consistent with its sales and trading practices to sell the 2024 Notes. The 2024 Notes are expected to trade “flat,” which means that purchasers in the secondary market will not pay, and sellers will not receive, any accrued and unpaid interest on the 2024 Notes that is not reflected in the trading price.
During the year ended December 31, 2018, the Company did not sell any notes under the debt distribution agreement. During the year ended December 31, 2017, the Company sold 225,457 notes for approximately $5.6 million in aggregate principal amount. As of December 31, 2018, approximately $136.4 million in aggregate principal amount remains available for issuance and sale under the debt distribution agreement.
All issuances of 2024 Notes rank equally in right of payment and form a single series of notes.
The 2024 Notes will mature on July 30, 2024 and may be redeemed in whole or in part at the Company’s option at any time or from time to time on or after July 30, 2017, upon not less than 30 days nor more than 60 days written notice by mail prior to the date fixed for redemption thereof, at a redemption price of 100% of the outstanding principal amount thereof plus accrued and unpaid interest payments otherwise payable for the then-current quarterly interest period accrued to but not including the date fixed for redemption. The 2024 Notes bear interest at a rate of 6.25% per year payable quarterly on January 30, April 30, July 30 and October 30 of each year, commencing on July 30, 2014, and trade on the NYSE under the trading symbol “HTGX.”
154
The 2024 Notes are the Company’s direct unsecured obligations and rank: (i) pari passu with the Company’s other outstanding and future senior unsecured indebtedness; (ii) senior to any of the Company’s future indebtedness that expressly provides it is subordinated to the 2024 Notes; (iii) effectively subordinated to all the Company’s existing and future secured indebtedness (including indebtedness that is initially unsecured to which the Company subsequently grants security), to the extent of the value of the assets securing such indebtedness; (iv) structurally subordinated to all existing and future indebtedness and other obligations of any of the Company’s subsidiaries.
The Base Indenture, as supplemented by the Third Supplemental Indenture, contains certain covenants including covenants requiring the Company to comply with (regardless of whether it is subject to) the asset coverage requirements set forth in Section 18 (a)(1)(A) of the 1940 Act as modified by Section 61(a)(1) of the 1940 Act and to comply with the restrictions on dividends and other distributions as well as the purchase of capital stock set forth in Section 18(a)(1)(B) of the 1940 Act as modified by Section 61(a)(1) of the 1940 Act. These covenants are subject to important limitations and exceptions that are described in the Base Indenture, as supplemented by the Third Supplemental Indenture. The Base Indenture, as supplemented by the Third Supplemental Indenture, also contains certain reporting requirements, including a requirement that the Company provide financial information to the holders of the 2024 Notes and the 2024 Trustee if the Company should no longer be subject to the reporting requirements under the Exchange Act of 1934, as amended (the “Exchange Act”). The Base Indenture provides for customary events of default and further provides that the 2024 Trustee or the holders of 25% in aggregate principal amount of the outstanding 2024 Notes in a series may declare such 2024 Notes immediately due and payable upon the occurrence of any event of default after expiration of any applicable grace period. As of December 31, 2018, the Company was in compliance with the terms of the Base Indenture as supplemented by the Third Supplemental Indenture.
On October 24, 2017, the Board of Directors approved a redemption of $75.0 million of outstanding aggregate principal amount of the 2024 Notes, which were redeemed on November 23, 2017. On February 9, 2018, the Board of Directors approved a redemption of $100.0 million of outstanding aggregate principal amount of the 2024 Notes and notice for such redemption was provided. The Company redeemed this portion of the 2024 Notes on April 2, 2018. Further, on December 7, 2018, our Board of Directors approved a full redemption, in two equal transactions, of $83.5 million of the outstanding aggregate principal amount of the 2024 Notes. The 2024 Notes were fully redeemed on January 14, 2019 and February 4, 2019. See “Note 14 – Subsequent Events.”
As of December 31, 2018 and December 31, 2017, the components of the carrying value of the 2024 Notes were as follows:
|
(in thousands) |
|
December 31, 2018 |
|
|
December 31, 2017 |
|
||
|
Principal amount of debt |
|
$ |
83,510 |
|
|
$ |
183,510 |
|
|
Unamortized debt issuance cost |
|
|
(1,686 |
) |
|
|
(4,591 |
) |
|
Original issue premium, net of amortization |
|
|
28 |
|
|
|
82 |
|
|
Carrying value of 2024 Notes |
|
$ |
81,852 |
|
|
$ |
179,001 |
|
For the years ended December 31, 2018, 2017 and 2016, the components of interest expense and related fees and cash paid for interest expense for the 2024 Notes are as follows:
|
|
|
Year Ended December 31, |
|
|||||||||
|
(in thousands) |
|
2018 |
|
|
2017 |
|
|
2016 |
|
|||
|
Interest expense |
|
$ |
6,830 |
|
|
$ |
15,610 |
|
|
$ |
11,775 |
|
|
Amortization of debt issuance cost (loan fees) |
|
|
2,905 |
|
|
|
3,050 |
|
|
|
686 |
|
|
Amortization of original issue premium |
|
|
(54 |
) |
|
|
(56 |
) |
|
|
3 |
|
|
Total interest expense and fees |
|
$ |
9,681 |
|
|
$ |
18,604 |
|
|
$ |
12,464 |
|
|
Cash paid for interest expense |
|
$ |
7,858 |
|
|
$ |
16,370 |
|
|
$ |
10,873 |
|
2025 Notes
On April 26, 2018, the Company issued $75.0 million in aggregate principal amount of the 2025 Notes. The 2025 Notes were issued pursuant to the 2025 Notes Indenture. The sale of the 2025 Notes generated net proceeds of approximately $72.4 million. Aggregate estimated offering expenses in connection with the transaction, including the underwriter’s discount and commissions were approximately $2.6 million.
The 2025 Notes will mature on April 30, 2025, unless previously repurchased in accordance with their terms. The 2025 Notes bear interest at a rate of 5.25% per year payable quarterly in arrears on January 30, April 30, July 30 and October 30 of each year, commencing on July 30, 2018 and trade on the NYSE under the symbol “HCXZ.”
155
The 2025 Notes will be the Company’s direct unsecured obligations and rank pari passu, or equally in right of payment, with all outstanding and future unsecured unsubordinated indebtedness issued by the Company.
The Company may redeem some or all of the 2025 Notes at any time, or from time to time, at the redemption price set forth under the terms of the indenture after April 30, 2021. No sinking fund is provided for the 2025 Notes. The 2025 Notes were issued in denominations of $25 and integral multiples of $25 thereof. As of December 31, 2018, the Company was in compliance with the terms of the 2025 Notes Indenture.
As of December 31, 2018 and December 31, 2017, the components of the carrying value of the 2025 Notes were as follows:
|
(in thousands) |
|
December 31, 2018 |
|
|
December 31, 2017 |
|
||
|
Principal amount of debt |
|
$ |
75,000 |
|
|
$ |
— |
|
|
Unamortized debt issuance cost |
|
|
(2,410 |
) |
|
|
— |
|
|
Carrying value of 2025 Notes |
|
$ |
72,590 |
|
|
$ |
— |
|
For the years ended December 31, 2018, 2017 and 2016, the components of interest expense and related fees and cash paid for interest expense for the 2025 Notes are as follows:
|
|
|
Year Ended December 31, |
|
|||||||||
|
(in thousands) |
|
2018 |
|
|
2017 |
|
|
2016 |
|
|||
|
Interest expense |
|
$ |
2,680 |
|
|
$ |
— |
|
|
$ |
— |
|
|
Amortization of debt issuance cost (loan fees) |
|
|
221 |
|
|
|
— |
|
|
|
— |
|
|
Total interest expense and fees |
|
$ |
2,901 |
|
|
$ |
— |
|
|
$ |
— |
|
|
Cash paid for interest expense |
|
$ |
2,013 |
|
|
$ |
— |
|
|
$ |
— |
|
2033 Notes
On September 24, 2018, the Company issued $40.0 million in aggregate principal amount of the 2033 Notes. The 2033 Notes were issued pursuant to the 2033 Notes Indenture. The sale of the 2033 Notes generated net proceeds of approximately $38.4 million. Aggregate estimated offering expenses in connection with the transaction, including the underwriter’s discount and commissions were approximately $1.6 million.
The 2033 Notes will mature on October 30, 2033, unless previously repurchased in accordance with their terms. The 2033 Notes bear interest at a rate of 6.25% per year payable quarterly in arrears on January 30, April 30, July 30 and October 30 of each year, commencing on October 30, 2018 and trade on the NYSE under the symbol “HCXY.”
The 2033 Notes will be the Company’s direct unsecured obligations and rank pari passu, or equally in right of payment, with all outstanding and future unsecured unsubordinated indebtedness issued by the Company.
The Company may redeem some or all of the 2033 Notes at any time, or from time to time, at the redemption price set forth under the terms of the indenture after October 30, 2023. No sinking fund is provided for the 2033 Notes. The 2033 Notes were issued in denominations of $25 and integral multiples of $25 thereof. As of December 31, 2018, the Company was in compliance with the terms of the 2033 Notes Indenture.
As of December 31, 2018 and December 31, 2017, the components of the carrying value of the 2033 Notes were as follows:
|
(in thousands) |
|
December 31, 2018 |
|
|
December 31, 2017 |
|
||
|
Principal amount of debt |
|
$ |
40,000 |
|
|
$ |
— |
|
|
Unamortized debt issuance cost |
|
|
(1,573 |
) |
|
|
— |
|
|
Carrying value of 2033 Notes |
|
$ |
38,427 |
|
|
$ |
— |
|
156
For the years ended December 31, 2018, 2017 and 2016, the components of interest expense and related fees and cash paid for interest expense for the 2033 Notes are as follows:
|
|
|
Year Ended December 31, |
|
|||||||||
|
(in thousands) |
|
2018 |
|
|
2017 |
|
|
2016 |
|
|||
|
Interest expense |
|
$ |
674 |
|
|
$ |
— |
|
|
$ |
— |
|
|
Amortization of debt issuance cost (loan fees) |
|
|
25 |
|
|
|
— |
|
|
|
— |
|
|
Total interest expense and fees |
|
$ |
699 |
|
|
$ |
— |
|
|
$ |
— |
|
|
Cash paid for interest expense |
|
$ |
250 |
|
|
$ |
— |
|
|
$ |
— |
|
2021 Asset-Backed Notes
On November 13, 2014, the Company completed a $237.4 million term debt securitization in connection with which an affiliate of the Company made an offer of $129.3 million in aggregate principal amount of the 2021 Asset-Backed Notes, which were rated A(sf) by KBRA. The 2021 Asset-Backed Notes were sold by Hercules Capital Funding Trust 2014-1 pursuant to a note purchase agreement, dated as of November 13, 2014, by and among the Company, Hercules Capital Funding 2014-1, LLC as trust depositor (the “2014 Trust Depositor”), Hercules Capital Funding Trust 2014-1 as issuer (the “2014 Securitization Issuer”), and Guggenheim Securities, LLC, as initial purchaser, and are backed by a pool of senior loans made to certain of the Company’s portfolio companies and secured by certain assets of those portfolio companies and are to be serviced by the Company. The securitization has an 18-month reinvestment period during which time principal collections may be reinvested into additional eligible loans. Interest on the 2021 Asset-Backed Notes is paid, to the extent of funds available, at a fixed rate of 3.524% per annum. The 2021 Asset-Backed Notes have a stated maturity of April 16, 2021.
In July 2018, changes in the payment schedule of obligors in the 2021 Asset-Backed Notes collateral pool triggered a rapid amortization event in accordance with the sale and servicing agreement for the 2021 Asset-Backed Notes. Due to this event, the 2021 Asset-Backed Notes were fully repaid as of October 16, 2018. At December 31, 2018, there is no outstanding principal balance for the 2021 Asset-Backed Notes. At December 31, 2017, the 2021 Asset-Backed Notes had an outstanding principal balance of $49.2 million.
For the years ended December 31, 2018, 2017 and 2016, the components of interest expense and related fees and cash paid for interest expense for the 2021 Asset-Backed Notes are as follows:
|
|
|
Year Ended December 31, |
|
|||||||||
|
(in thousands) |
|
2018 |
|
|
2017 |
|
|
2016 |
|
|||
|
Interest expense |
|
$ |
689 |
|
|
$ |
2,830 |
|
|
$ |
4,366 |
|
|
Amortization of debt issuance cost (loan fees) |
|
|
503 |
|
|
|
731 |
|
|
|
1,071 |
|
|
Total interest expense and fees |
|
$ |
1,192 |
|
|
$ |
3,561 |
|
|
$ |
5,437 |
|
|
Cash paid for interest expense |
|
$ |
833 |
|
|
$ |
3,036 |
|
|
$ |
4,396 |
|
Under the terms of the 2021 Asset-Backed Notes, the Company is required to maintain a reserve cash balance, funded through interest and principal collections from the underlying securitized debt portfolio, which may be used to pay monthly interest and principal payments on the 2021 Asset-Backed Notes. The Company has segregated these funds and classified them as restricted cash. As the 2021 Asset-Backed Notes were fully repaid as of October 16, 2018, there were no funds segregated as restricted cash related to the 2021 Asset-Backed Notes at December 31, 2018. There was approximately $3.7 million of restricted cash as of December 31, 2017.
2027 Asset-Backed Notes
On November 1, 2018, the Company completed a term debt securitization in connection with which an affiliate of the Company made an offering of $200.0 million in aggregate principal amount of the 2027 Asset-Backed Notes. The 2027 Asset-Backed Notes were rated A(sf) by KBRA.
The 2027 Asset-Backed Notes were issued by the 2018 Securitization Issuer pursuant to a note purchase agreement, dated as of October 25, 2018, by and among the Company, the 2018 Trust Depositor, the 2018 Securitization Issuer, and Guggenheim Securities, LLC, as Initial Purchaser, and are backed by a pool of senior loans made to certain portfolio companies of the Company and secured by certain assets of those portfolio companies and are to be serviced by the Company. The securitization has a reinvestment period with a scheduled termination date of October 20, 2020 during which time principal collections may be reinvested into additional eligible loans. Interest on the 2027 Asset-Backed Notes will be paid, to the extent of funds available, at a fixed rate of 4.605% per annum. The 2027 Asset-Backed Notes have a stated maturity of November 22, 2027.
157
At December 31, 2018, the 2027 Asset-Backed Notes had an outstanding principal balance of $200.0 million. There is no outstanding principal balance for the 2027 Asset-Backed Notes at December 31, 2017.
For the years ended December 31, 2018, 2017 and 2016, the components of interest expense and related fees and cash paid for interest expense for the 2027 Asset-Backed Notes are as follows:
|
|
|
Year Ended December 31, |
|
|||||||||
|
(in thousands) |
|
2018 |
|
|
2017 |
|
|
2016 |
|
|||
|
Interest expense |
|
$ |
1,509 |
|
|
$ |
— |
|
|
$ |
— |
|
|
Amortization of debt issuance cost (loan fees) |
|
|
44 |
|
|
|
— |
|
|
|
— |
|
|
Total interest expense and fees |
|
$ |
1,553 |
|
|
$ |
— |
|
|
$ |
— |
|
|
Cash paid for interest expense |
|
$ |
1,254 |
|
|
$ |
— |
|
|
$ |
— |
|
Under the terms of the 2027Asset-Backed Notes, the Company is required to maintain a reserve cash balance, funded through proceeds from the sale of the 2027 Asset-Backed Notes and through interest and principal collections from the underlying securitized debt portfolio, which may be used to pay monthly interest and principal payments on the 2027 Asset-Backed Notes. The Company has segregated these funds and classified them as restricted cash. There was approximately $11.6 million of restricted cash as of December 31, 2018. There were no funds segregated as restricted cash related to the 2027 Asset-Backed Notes as of December 31, 2017.
Convertible Notes
2016 Convertible Notes
In April 2011, the Company issued $75.0 million in aggregate principal amount of 6.00% convertible notes due 2016 (the “2016 Convertible Notes”). The 2016 Convertible Notes were fully settled on or before their contractual maturity date of April 15, 2016.
Prior to the close of business on October 14, 2015, holders were able to convert their 2016 Convertible Notes only under certain circumstances set forth in the indenture governing the 2016 Convertible Notes. On or after October 15, 2015 until the close of business on the scheduled trading day immediately preceding the maturity date, holders were able to convert their 2016 Convertible Notes at any time. Throughout the life of the 2016 Convertible Notes, holders of approximately $74.8 million of the 2016 Convertible Notes exercised their conversion rights. These 2016 Convertible Notes were settled with a combination of cash equal to the outstanding principal amount of the 2016 Convertible Notes and approximately 1.6 million shares of the Company’s common stock, or $24.3 million.
The 2016 Convertible Notes were accounted for in accordance with ASC Subtopic 470-20 (“Debt Instruments with Conversion and Other Options”). In accounting for the 2016 Convertible Notes, the Company estimated at the time of issuance that the values of the debt and the embedded conversion feature of the 2016 Convertible Notes were approximately 92.8% and 7.2%, respectively. The original issue discount of 7.2% attributable to the conversion feature of the 2016 Convertible Notes was recorded in “capital in excess of par value” in the Consolidated Statement of Assets and Liabilities. As a result, the Company recorded interest expense comprised of both stated interest expense as well as accretion of the original issue discount resulting in an estimated effective interest rate of approximately 8.1%.
For the years ended December 31, 2018, 2017 and 2016, the components of interest expense, fees and cash paid for interest expense for the 2016 Convertible Notes were as follows:
|
|
|
Year Ended December 31, |
|
|||||||||
|
(in thousands) |
|
2018 |
|
|
2017 |
|
|
2016 |
|
|||
|
Interest expense |
|
$ |
— |
|
|
$ |
— |
|
|
$ |
352 |
|
|
Amortization of debt issuance cost (loan fees) |
|
|
— |
|
|
|
— |
|
|
|
44 |
|
|
Accretion of original issue discount |
|
|
— |
|
|
|
— |
|
|
|
82 |
|
|
Total interest expense and fees |
|
$ |
— |
|
|
$ |
— |
|
|
$ |
478 |
|
|
Cash paid for interest expense |
|
$ |
— |
|
|
$ |
— |
|
|
$ |
440 |
|
The estimated effective interest rate of the debt component of the 2016 Convertible Notes, equal to the stated interest of 6.0% plus the accretion of the original issue discount, was approximately 8.1% for the year ended December 31, 2016.
158
On January 25, 2017, the Company issued $230.0 million in aggregate principal amount of the 2022 Convertible Notes, which amount includes the additional $30.0 million aggregate principal amount of 2022 Convertible Notes issued pursuant to the initial purchaser’s exercise in full of its overallotment option. The 2022 Convertible Notes were issued pursuant to an Indenture, dated January 25, 2017 (the “2022 Convertible Notes Indenture”), between the Company and U.S. Bank, National Association, as trustee (the “2022 Trustee”). The sale of the 2022 Convertible Notes generated net proceeds of approximately $225.5 million, including $4.5 million of debt issuance costs.
The 2022 Convertible Notes mature on February 1, 2022, unless previously converted or repurchased in accordance with their terms. The 2022 Convertible Notes bear interest at a rate of 4.375% per year payable semiannually in arrears on February 1 and August 1 of each year, commencing on August 1, 2017.
The 2022 Convertible Notes are unsecured obligations of the Company and rank senior in right of payment to the Company’s future indebtedness that is expressly subordinated in right of payment to the 2022 Convertible Notes; equal in right of payment to the Company’s existing and future indebtedness that is not so subordinated; effectively junior in right of payment to any of the Company’s secured indebtedness (including unsecured indebtedness that the Company later secures) to the extent of the value of the assets securing such indebtedness; and structurally junior to all existing and future indebtedness (including trade payables) incurred by the Company’s subsidiaries, financing vehicles or similar facilities.
Prior to the close of business on the business day immediately preceding August 1, 2021, holders may convert their 2022 Convertible Notes only under certain circumstances set forth in the 2022 Convertible Notes Indenture. On or after August 1, 2021 until the close of business on the scheduled trading day immediately preceding the maturity date, holders may convert their 2022 Convertible Notes at any time. Upon conversion, the Company will pay or deliver, as the case may be, at its election, cash, shares of its common stock or a combination of cash and shares of its common stock. The conversion rate is initially 60.9366 shares of common stock per $1,000 principal amount of 2022 Convertible Notes (equivalent to an initial conversion price of approximately $16.41 per share of common stock). The conversion rate will be subject to adjustment in some events but will not be adjusted for any accrued and unpaid interest. In addition, if certain corporate events occur prior to the maturity date, the Company will increase the conversion rate for a holder who elects to convert its 2022 Convertible Notes in connection with such a corporate event in certain circumstances. As of December 31, 2018, the conversion rate was 60.9366 shares of common stock per $1,000 principal amount of Convertible Senior Notes (equivalent to an adjusted conversion price of approximately $16.41 per share of common stock).
The Company may not redeem the 2022 Convertible Notes at its option prior to maturity. No sinking fund is provided for the 2022 Convertible Notes. In addition, if certain corporate events occur, holders of the 2022 Convertible Notes may require the Company to repurchase for cash all or part of their 2022 Convertible Notes at a repurchase price equal to 100% of the principal amount of the 2022 Convertible Notes to be repurchased, plus accrued and unpaid interest through, but excluding, the required repurchase date.
The 2022 Convertible Notes Indenture contains certain covenants, including covenants requiring the Company to comply with Section 18(a)(1)(A) of the 1940 Act as modified by Section 61(a)(1) of the 1940 Act and to provide financial information to the holders of the 2022 Convertible Notes and the 2022 Trustee if the Company ceases to be subject to the reporting requirements of the Exchange Act. These covenants are subject to important limitations and exceptions that are described in the 2022 Convertible Notes Indenture. The Company offered and sold the 2022 Convertible Notes to the initial purchaser in reliance on the exemption from registration provided by Section 4(a)(2) of the Securities Act, for resale by the initial purchaser to qualified institutional buyers (as defined in the Securities Act) pursuant to the exemption from registration provided by Rule 144A under the Securities Act. The Company relied on these exemptions from registration based in part on representations made by the initial purchaser in connection with the sale of the 2022 Convertible Notes.
The 2022 Convertible Notes are accounted for in accordance with ASC Subtopic 470-20 (“Debt Instruments with Conversion and Other Options”). In accounting for the 2022 Convertible Notes, the Company estimated at the time of issuance that the values of the debt and the embedded conversion feature of the 2022 Convertible Notes were approximately 98.5% and 1.5%, respectively. The original issue discount of 1.5% or $3.4 million, attributable to the conversion feature of the 2022 Convertible Notes was recorded in “capital in excess of par value” in the Consolidated Statement of Assets and Liabilities. As a result, the Company records interest expense comprised of both stated interest expense as well as accretion of the original issue discount resulting in an estimated effective interest rate of approximately 4.76%.
159
As of December 31, 2018 and December 31, 2017, the components of the carrying value of the 2022 Convertible Notes were as follows:
|
(in thousands) |
|
December 31, 2018 |
|
|
December 31, 2017 |
|
||
|
Principal amount of debt |
|
$ |
230,000 |
|
|
$ |
230,000 |
|
|
Unamortized debt issuance cost |
|
|
(2,823 |
) |
|
|
(3,715 |
) |
|
Original issue discount, net of accretion |
|
|
(2,126 |
) |
|
|
(2,797 |
) |
|
Carrying value of 2022 Convertible Notes |
|
$ |
225,051 |
|
|
$ |
223,488 |
|
For the years ended December 31, 2018, 2017 and 2016, the components of interest expense, fees and cash paid for interest expense for the 2022 Convertible Notes were as follows:
|
|
|
Year Ended December 31, |
|
|||||||||
|
(in thousands) |
|
2018 |
|
|
2017 |
|
|
2016 |
|
|||
|
Interest expense |
|
$ |
10,063 |
|
|
$ |
9,392 |
|
|
$ |
— |
|
|
Amortization of debt issuance cost (loan fees) |
|
|
892 |
|
|
|
781 |
|
|
|
— |
|
|
Accretion of original issue discount |
|
|
671 |
|
|
|
615 |
|
|
|
— |
|
|
Total interest expense and fees |
|
$ |
11,626 |
|
|
$ |
10,788 |
|
|
$ |
— |
|
|
Cash paid for interest expense |
|
$ |
10,062 |
|
|
$ |
5,199 |
|
|
$ |
— |
|
As of December 31, 2018, the Company was in compliance with the terms of the indentures governing the 2022 Convertible Notes.
Credit Facilities
As of December 31, 2018 and December 31, 2017, the Company has two available credit facilities, the Wells Facility and the Union Bank Facility.
Wells Facility
On June 29, 2015, the Company, through a special purpose wholly-owned subsidiary, Hercules Funding II LLC (“Hercules Funding II”), entered into an Amended and Restated Loan and Security Agreement with Wells Fargo Capital Finance, LLC, as a lender and as the arranger and the administrative agent, and the lenders party thereto from time to time.
As of December 31, 2018, the maturity date of the Wells Facility was August 2, 2019, unless terminated sooner in accordance with its terms. On January 11, 2019, the Company entered into the Seventh Amendment to the Wells Facility, which extended the maturity date to January 12, 2023.
Under the Wells Facility, Wells Fargo Capital Finance, LLC made commitments of $75.0 million. Alostar Bank of Commerce made commitments of $20.0 million, and Everbank Commercial Finance Inc. made commitments of $25.0 million. On July 31, 2018, the Company entered into a further amendment to the Wells Facility to extend the maturity date and fully repay the pro-rata portion of outstanding balances of Alostar Bank of Commerce and Everbank Commercial Finance Inc., thereby resigning both as lenders and terminating their commitments thereunder.
The Wells Facility contains an accordion feature, in which the Company can increase the credit line up to an aggregate of $300.0 million, funded by additional lenders and with the agreement of Wells Fargo and subject to other customary conditions. The Company expects to continue discussions with various other potential lenders to join the facility; however, there can be no assurances that additional lenders will join the Wells Facility. Borrowings under the Wells Facility generally bear interest at a rate per annum equal to LIBOR plus 3.25%, and the Wells Facility has an advance rate of 50% against eligible debt investments. The Wells Facility is secured by all of the assets of Hercules Funding II. The Wells Facility requires payment of a non-use fee on a scale of 0.0% to 0.50% depending on the average monthly outstanding balance under the facility relative to the maximum amount of commitments at such time. For the years ended December 31, 2018 and 2017, this non-use fee was approximately $397,000 and $604,000, respectively.
The Wells Facility also includes various financial and other covenants applicable to the Company and the Company’s subsidiaries, in addition to those applicable to Hercules Funding II, including covenants relating to certain changes of control of the Company and Hercules Funding II. Among other things, these covenants also require the Company to maintain certain financial ratios, including a maximum debt to worth ratio, minimum interest coverage ratio, minimum portfolio funding liquidity, and a minimum tangible net worth in an amount, when added to outstanding subordinated indebtedness, that is in excess of $500.0 million plus 90% of the cumulative amount of equity raised after June 30, 2014.
160
As of December 31, 2018, the minimum tangible net worth covenant has increased to $870.8 million as a result of the public offering of 18.2 million shares of common stock for total gross proceeds of approximately $242.8 million under the Prior Equity Distribution Agreement through February 2017, and the Equity Distribution Agreement for the issuance of 1.6 million shares for gross proceeds of $20.5 million during 2017, and the issuance of 12.0 million shares for gross proceeds of $148.7 million during the year ended December 31, 2018. See “Note 6 – Stockholder’s Equity.”
The Wells Facility provides for customary events of default, including, without limitation, with respect to payment defaults, breach of representations and covenants, certain key person provisions, cross acceleration provisions to certain other debt, lien and judgment limitations, and bankruptcy.
On June 20, 2011 the Company paid $1.1 million in structuring fees in connection with the original Wells Facility. In connection with an amendment to the original Wells Facility in August 2014, and subsequent amendments in December 2015 and July 2018, the Company paid an additional $750,000, $188,000, and $47,000 in structuring fees, respectively. These fees are being amortized through the end of the term of the Wells Facility.
The Company had aggregate draws of $188.5 million on the available facility during the year ended December 31, 2018 offset by repayments of $175.4 million. As of December 31, 2018, the Company has borrowings outstanding of $13.1 million on the facility. There were no borrowings outstanding on the facility at December 31, 2017.
For the years ended December 31, 2018, 2017 and 2016, the components of interest expense and related fees and cash paid for interest expense for the Wells Facility are as follows:
|
|
|
Year Ended December 31, |
|
|||||||||
|
(in thousands) |
|
2018 |
|
|
2017 |
|
|
2016 |
|
|||
|
Interest expense |
|
$ |
1,181 |
|
|
$ |
2 |
|
|
$ |
539 |
|
|
Amortization of debt issuance cost (loan fees) |
|
|
178 |
|
|
|
324 |
|
|
|
492 |
|
|
Total interest expense and fees |
|
$ |
1,359 |
|
|
$ |
326 |
|
|
$ |
1,031 |
|
|
Cash paid for interest expense |
|
$ |
1,181 |
|
|
$ |
41 |
|
|
$ |
577 |
|
Union Bank Facility
On May 5, 2016, the Company, through a special purpose wholly owned subsidiary, Hercules Funding III LLC (“Hercules Funding III”), as borrower, entered into the Union Bank Facility with Union Bank, as the arranger and administrative agent, and the lenders party to the Union Bank Facility from time to time. The Union Bank Facility replaced the Prior Union Bank Facility. Any references to amounts related to the Union Bank Facility prior to May 5, 2016 were incurred and relate to the Prior Union Bank Facility.
On July 18, 2016, the Company entered into the First Amendment to the Loan and Security Agreement, dated as of May 5, 2016 with Union Bank. The Amendment amends certain definitions relating to borrowings which accrue interest based on the London Interbank Offered Rate (“LIBOR Loans”) and (ii) the method(s) for calculating interest on and the paying of certain fees related to such LIBOR Loans.
The Union Bank Facility contains an accordion feature, in which the Company can increase the credit line up to an aggregate of $200.0 million, funded by additional lenders and with the agreement of Union Bank and subject to other customary conditions. There can be no assurances that additional lenders will join the Union Bank Facility to increase available borrowings. Borrowings under the Union Bank Facility generally bear interest at either (i) if such borrowing is a base rate loan, a base rate per annum equal to the federal funds rate plus 1.00%, LIBOR plus 1.00% or Union Bank’s prime rate, in each case, plus a margin of 1.25% or (ii) if such borrowing is a LIBOR loan, a rate per annum equal to LIBOR plus 3.25%, and the Union Bank Facility generally has an advance rate of 50% against eligible debt investments. The Union Bank Facility is secured by all of the assets of Hercules Funding III.
The Company paid a one-time $562,500 structuring fee in connection with the Union Bank Facility. The Union Bank Facility requires payment of a non-use fee during the revolving credit availability period on a scale of 0.25% to 0.50% depending on the average monthly outstanding balance under the facility relative to the maximum amount of commitments at such time. For the years ended December 31, 2018 and 2017, the Company incurred non-use fees under the Union Bank Facility and Prior Union Bank Facility of approximately $298,000 and $380,000, respectively.
The Union Bank Facility also includes various financial and other covenants applicable to the Company and the Company’s subsidiaries, in addition to those applicable to Hercules Funding III, including covenants relating to certain changes of control of the Company and Hercules Funding III. Among other things, these covenants also require the Company to maintain certain financial ratios, including a maximum debt to worth ratio, minimum interest coverage ratio, minimum portfolio funding liquidity, and a
161
minimum tangible net worth in an amount that is in excess of $500.0 million plus 90% of the cumulative amount of equity raised after June 30, 2014.
On May 25, 2018, the Company entered into the Second Amendment to the Union Bank Facility with Union Bank, as the arranger and administrative agent, and the lenders party thereto from time to time. The amendment amends certain provisions of the Union Bank Facility to increase Union Bank’s commitments thereunder from $75.0 million to $100.0 million.
As of December 31, 2018, the minimum tangible net worth covenant increased to $914.1 million as a result of the public offering of 18.2 million shares of common stock for a total net proceeds of approximately $239.8 million under the Prior Equity Distribution Agreement through February 2017, and the Equity Distribution Agreement for the issuance of 1.6 million shares for net proceeds of $20.0 million during 2017, and the issuance of 12.0 million shares for net proceeds of $144.7 million during the year ended December 31, 2018. See “Note 6 – Stockholder’s Equity.”
The Union Bank Facility provides for customary events of default, including with respect to payment defaults, breach of representations and covenants, servicer defaults, certain key person provisions, cross default provisions to certain other debt, lien and judgment limitations, and bankruptcy.
The Union Bank Facility matures on May 5, 2020, unless terminated sooner in accordance with its terms.
In connection with the Union Bank Facility, the Company and Hercules Funding III also entered into the Sale Agreement, by and among Hercules Funding III, as borrower, the Company, as originator and servicer, and Union Bank, as agent. Under the Sale Agreement, the Company agrees to (i) sell or transfer certain loans to Hercules Funding III under the Union Bank Facility and (ii) act as servicer for the loans sold or transferred.
The Company had aggregate draws of $165.0 million on the available facility during the year ended December 31, 2018, offset by repayments of $125.2 million. As of December 31, 2018, the Company has borrowings outstanding of $39.8 million on the facility. There were no borrowings outstanding on the Facility at December 31, 2017.
For the years ended December 31, 2018, 2017 and 2016, the components of interest expense and related fees and cash paid for interest expense for the previous and current Union Bank Facility are as follows:
|
|
|
Year Ended December 31, |
|
|||||||||
|
(in thousands) |
|
2018 |
|
|
2017 |
|
|
2016 |
|
|||
|
Interest expense |
|
$ |
1,667 |
|
|
$ |
— |
|
|
$ |
189 |
|
|
Amortization of debt issuance cost (loan fees) |
|
|
338 |
|
|
|
388 |
|
|
|
356 |
|
|
Total interest expense and fees |
|
$ |
2,005 |
|
|
$ |
388 |
|
|
$ |
545 |
|
|
Cash paid for interest expense |
|
$ |
1,629 |
|
|
$ |
80 |
|
|
$ |
38 |
|
5. Income Taxes
The Company intends to operate so as to qualify to be subject to tax as a RIC under Subchapter M of the Code and, as such, will not be subject to U.S. federal income tax on the portion of taxable income (including gains) distributed as dividends for U.S. federal income tax purposes to stockholders. Taxable income includes the Company’s taxable interest, dividend and fee income, reduced by certain deductions, as well as taxable net realized securities gains. Taxable income generally differs from net income for financial reporting purposes due to temporary and permanent differences in the recognition of income and expenses, and generally excludes net unrealized appreciation or depreciation, as such gains or losses are not included in taxable income until they are realized.
To qualify and be subject to tax as a RIC, the Company is required to meet certain income and asset diversification tests in addition to distributing dividends of an amount generally at least equal to 90% of its investment company taxable income, as defined by the Code and determined without regard to any deduction for distributions paid, to its stockholders. The amount to be paid out as a distribution is determined by the Board of Directors each quarter and is based upon the annual earnings estimated by the management of the Company. To the extent that the Company’s earnings fall below the amount of dividend distributions declared, however, a portion of the total amount of the Company’s distributions for the fiscal year may be deemed a return of capital for tax purposes to the Company’s stockholders.
162
Because federal income tax regulations differ from accounting principles generally accepted in the United States, distributions in accordance with tax regulations may differ from net investment income and realized gains recognized for financial reporting purposes. Differences may be permanent or temporary in nature. Permanent differences are reclassified among capital accounts in the financial statements to reflect their appropriate tax character. Permanent differences may also result from the change in the classification of short-term gains as ordinary income for tax purposes. Temporary differences arise when certain items of income, expense, gain or loss are recognized at some time in the future. Also, recent tax legislation requires that income be recognized for tax purposes no later than when recognized for financial reporting purposes.
During the year ended December 31, 2018 and 2017, the Company reclassified for book purposes amounts arising from permanent book/tax differences primarily related to accelerated revenue recognition for income tax purposes, respectively, as follows:
|
|
|
Year Ended December 31, |
|
|||||
|
(in thousands) |
|
2018 |
|
|
2017 |
|
||
|
Undistributed net investment income (distributions in excess of investment income) |
|
$ |
3,675 |
|
|
$ |
1,347 |
|
|
Accumulated realized gains |
|
|
9,317 |
|
|
|
6,916 |
|
|
Additional paid-in capital |
|
|
(12,992 |
) |
|
|
(8,263 |
) |
For income tax purposes, distributions paid to shareholders are reported as ordinary income, return of capital, long-term capital gains or a combination thereof. The tax character of distributions paid for the year ended December 31, 2018 was ordinary income in the amount of $114.2 million with no distributions made from long-term capital gain. The tax character of distributions paid for the year ended December 31, 2017 was ordinary income in the amount of $89.3 million.
The aggregate gross unrealized appreciation of the Company’s investments over cost for U.S. federal income tax purposes was $39.6 million and $32.5 million as of December 31, 2018 and 2017, respectively. The aggregate gross unrealized depreciation of the Company’s investments under cost for U.S. federal income tax purposes was $158.7 million and $119.7 million as of December 31, 2018 and 2017, respectively. The net unrealized depreciation over cost for U.S. federal income tax purposes was $119.1 million and $87.2 million as December 31, 2018 and 2017, respectively. The aggregate cost of securities for U.S. federal income tax purposes was $2.0 billion and $1.6 billion as of December 31, 2018 and 2017, respectively.
At December 31, 2018 and 2017, the components of distributable earnings on a tax basis detailed below differ from the amounts reflected in the Company’s Consolidated Statements of Assets and Liabilities by temporary book or tax differences primarily arising from the treatment of loan related yield enhancements.
|
|
|
Year Ended December 31, |
|
|||||
|
(in thousands) |
|
2018 |
|
|
2017 |
|
||
|
Accumulated Capital Gains |
|
$ |
3,200 |
|
|
$ |
(4,435 |
) |
|
Other Temporary Differences |
|
|
(6,875 |
) |
|
|
(563 |
) |
|
Undistributed Ordinary Income |
|
|
30,669 |
|
|
|
23,010 |
|
|
Unrealized Depreciation |
|
|
(119,853 |
) |
|
|
(85,631 |
) |
|
Components of Distributable Earnings |
|
$ |
(92,859 |
) |
|
$ |
(67,619 |
) |
As a RIC, the Company will be subject to a 4% nondeductible U.S. federal excise tax on certain undistributed income unless the Company makes distributions treated as dividends for U.S. federal income tax purposes in a timely manner to its stockholders in respect of each calendar year of an amount at least equal to the Excise Tax Avoidance Requirement. The Company will not be subject to this excise tax on any amount on which the Company incurred U.S. federal corporate income tax (such as the tax imposed on a RIC’s retained net capital gains).
Depending on the level of taxable income earned in a taxable year, the Company may choose to carry over taxable income in excess of current taxable year distributions from such taxable income into the next taxable year and incur a 4% excise tax on such taxable income, as required. The maximum amount of excess taxable income that may be carried over for distribution in the next taxable year under the Code is the total amount of distributions paid in the following taxable year, subject to certain declaration and payment guidelines. To the extent the Company chooses to carry over taxable income into the next taxable year, distributions declared and paid by the Company in a taxable year may differ from the Company’s taxable income for that taxable year as such distributions may include the distribution of current taxable year taxable income, the distribution of prior taxable year taxable income carried over into and distributed in the current taxable year, or returns of capital.
The Company has taxable subsidiaries which hold certain portfolio investments in an effort to limit potential legal liability and/or comply with source-income type requirements contained in the RIC tax provisions of the Code. These taxable subsidiaries are consolidated for U.S. GAAP and the portfolio investments held by the taxable subsidiaries are included in the Company’s
163
consolidated financial statements and are recorded at fair value. These taxable subsidiaries are not consolidated with the Company for income tax purposes and may generate income tax expense, or benefit, and tax assets and liabilities as a result of their ownership of certain portfolio investments. Any income generated by these taxable subsidiaries generally would be subject to tax taxed at normal corporate tax rates based on its taxable income.
For the year ended December 31, 2018, the Company paid approximately $713,000 of income tax and had $345,000 accrued but unpaid income tax as of the balance sheet. For the year ended December 31, 2017, the Company paid approximately $1.1 million of income tax and had no accrued but unpaid tax expense as of the balance sheet date.
The Company evaluates tax positions taken in the course of preparing the Company’s tax returns to determine whether the tax positions are “more-likely-than-not” to be sustained by the applicable tax authority. Tax benefits of positions not deemed to meet the more-likely-than-not threshold, or uncertain tax positions, would be recorded as a tax expense in the current year. It is the Company’s policy to recognize accrued interest and penalties, if any, related to unrecognized tax benefits as a component of provision for income taxes.
Based on an analysis of the Company’s tax position, there are no uncertain tax positions that met the recognition or measurement criteria. The Company is currently not undergoing any tax examinations. The Company does not anticipate any significant increase or decrease in unrecognized tax benefits for the next twelve months. The 2015- 2017 federal tax years for the Company remain subject to examination by the Internal Revenue Service. The 2014-2017 state tax years for the Company remain subject to examination by the state taxing authorities.
6. Stockholders’ Equity
On August 16, 2013, the Company entered into the Prior Equity Distribution Agreement. On March 7, 2016, the Company renewed the Prior Equity Distribution Agreement and on December 21, 2016, the Company further amended the agreement to increase the total shares available under the program. The Prior Equity Distribution Agreement, as amended, provided that the Company may offer and sell up to 12.0 million shares of its common stock from time to time through JMP, as its sales agent.
On September 7, 2017, the Company terminated the Prior Equity Distribution Agreement and entered into the new Equity Distribution Agreement. As a result, the remaining shares that were available under the Prior Equity Distribution agreement are no longer available for issuance. The Equity Distribution Agreement provides that the Company may offer and sell up to 12.0 million shares of its common stock from time to time through JMP, as its sales agent. Sales of the Company’s common stock, if any, may be made in negotiated transactions or transactions that are deemed to be “at the market,” as defined in Rule 415 under the Securities Act, including sales made directly on the NYSE or similar securities exchange or sales made to or through a market maker other than on an exchange, at prices related to the prevailing market prices or at negotiated prices.
During the year ended December 31, 2018, the Company sold 5.1 million shares of common stock for total accumulated net proceeds of approximately $63.3 million, including $1.5 of offering expenses under the Equity Distribution Agreement. During the year ended December 31, 2017, the Company sold 4.9 million shares of common stock, of which 3.3 million shares and 1.6 million were issued under the Prior Equity Distribution Agreement and the Equity Distribution Agreement, respectively. During the year ended December 31, 2017, the Company received total accumulated net proceeds of approximately $66.9 million, including $962,000 of offering expenses, from these sales, of which $46.9 million, including offering expenses of $532,000, was received under the Prior Equity Distribution Agreement and $20.0 million, including offering expenses of $430,000, was received under the Equity Distribution Agreement, respectively.
The Company generally uses net proceeds from these offerings to make investments, to repurchase or pay down liabilities and for general corporate purposes. As of December 31, 2018, approximately 5.3 million shares remain available for issuance and sale under the Equity Distribution Agreement.
On June 14, 2018, the Company closed the June 2018 Equity Offering. The offering generated net proceeds, before expenses, of $81.3 million, including the underwriting discount and commissions of $2.6 million.
On December 17, 2018, the Company’s Board of Directors authorized a stock repurchase plan permitting us to repurchase up to $25.0 million of our common stock. We may repurchase shares of our common stock in the open market, including block purchases, at prices that may be above or below the net asset value as reported in the most recently published financial statements, in accordance with the guidelines specified in Rule 10b-18 and Rule 10b5-1 of the Exchange Act. We expect that the share repurchase program will be in effect until June 18, 2019, or until the approved dollar amount has been used to repurchase shares. During the year ended December 31, 2018, we repurchased 376,466 shares of our common stock at an average price per share of $10.77 and a total cost of
164
approximately $4.1 million. As of December 31, 2018, approximately $20.9 million of common stock remains eligible for repurchase under the stock repurchase plan.
The Company has issued stock options for common stock subject to future issuance, of which 481,032 and 590,525 were outstanding at December 31, 2018 and December 31, 2017, respectively.
7. Equity Incentive Plans
The Company and its stockholders authorized and adopted the 2004 Plan for purposes of attracting and retaining the services of its executive officers and key employees.
The Company and its stockholders have authorized and adopted the 2006 Plan for purposes of attracting and retaining the services of its Board of Directors. On June 21, 2017, the 2006 Plan expired in accordance with its terms and no additional awards may be granted under the 2006 Plan.
On June 21, 2007, the stockholders approved amendments to the 2004 Plan and the 2006 Plan allowing for the grant of restricted stock. The amended Plans limit the combined maximum amount of restricted stock that may be issued under both Plans to 10% of the outstanding shares of the Company’s stock on the effective date of the Plans plus 10% of the number of shares of stock issued or delivered by the Company during the terms of the Plans. The amendments further specify that no one person shall be granted awards of restricted stock relating to more than 25% of the shares available for issuance under the 2004 Plan. Further, the amount of voting securities that would result from the exercise of all of the Company’s outstanding warrants, options and rights, together with any restricted stock issued pursuant to the Plans, at the time of issuance shall not exceed 25% of its outstanding voting securities, except that if the amount of voting securities that would result from such exercise of all of the Company’s outstanding warrants, options and rights issued to the Company’s directors, officers and employees, together with any restricted stock issued pursuant to the Plans, would exceed 15% of the Company’s outstanding voting securities, then the total amount of voting securities that would result from the exercise of all outstanding warrants, options and rights, together with any restricted stock issued pursuant to the Plans, at the time of issuance shall not exceed 20% of the Company’s outstanding voting securities.
During 2012, the Compensation Committee adopted a policy that provided for awards with different vesting schedules for short and long-term awards. All restricted stock grants under the 2004 Plan made prior to March 4, 2013 continue to vest on a monthly basis following their one-year anniversary over the succeeding 36 months. Under the 2004 Plan, restricted stock awarded subsequent to March 3, 2013 vests subject to continued employment based on two vesting schedules: short-term awards vest one-half on the one year anniversary of the date of the grant and quarterly over the succeeding 12 months, and long-term awards vest one-fourth on the one year anniversary of the date of grant and quarterly over the succeeding 36 months. No restricted stock was granted pursuant to the 2004 Plan prior to 2009.
On December 29, 2016, the Board of Directors approved an amendment and restatement of the 2004 Plan. The amended plan provides, in addition to the preexisting types of awards available for grant thereunder and among other things, (1) for the grant of restricted stock units; (2) for the deferral of the receipt of the shares of the Company’s common stock underlying vested restricted stock units; (3) that grantees may receive up to 10% of the value of the tentative restricted stock unit grants proposed for any grantee in the form of an option to acquire shares of the Company’s common stock; (4) that awards of restricted stock units may include performance vesting conditions; (5) that awards may require that all or a portion of the shares of the Company’s common stock delivered in respect of any vested restricted stock unit award be subject to a specified post-delivery holding period; and (6) that restricted stock unit awards may accrue distribution equivalents in respect of the Company’s common stock underlying any restricted stock unit award payable in the form of cash or additional shares of the Company’s common stock to the extent, and in respect of, any vested restricted stock units.
On May 2, 2018, the Company granted long-term Retention Performance Stock Unit awards (the “Retention PSUs”) and separate cash bonus awards with similar terms (the “Cash Awards”) to senior personnel under its 2004 Equity Incentive Plan. The awards are designed to provide incentives that increase along with the total shareholder return (“TSR”). On May 2, 2018, the target number of Retention PSUs granted to senior personnel was 1,299,757 in the aggregate and the target amount of the Cash Awards granted to senior personnel was $4.0 million in the aggregate. As of December 31, 2018, there were 1.3 million Retention PSUs outstanding and the target amount of the Cash Awards was $3.0 million in the aggregate.
The Retention PSUs and Cash Awards do not vest until the fourth anniversary “cliff vest” of the grant date (or a change in control of the Company, if earlier) and the Retention PSUs must generally be held and not disposed of until the fifth anniversary of the grant date, except in the event of death, disability or a change in control (the “Performance Period”). No Retention PSUs or Cash Awards will vest if the Company’s TSR relative to certain specified publicly traded business development companies (BDCs) is not at or above the 25th percentile level of such BDCs. 50% of the target Cash Award and target number of Retention PSUs will vest if the Company’s TSR performance relative to such BDCs is at the 25th percentile level. 100% of the target Cash Award and target number
165
of Retention PSUs will vest if the Company’s TSR performance relative to such BDCs is at the 50th percentile level. 200% of the target Cash Award and target number of Retention PSUs will vest if the Company’s TSR performance relative to such BDCs is at the 90th percentile level. If the Company’s TSR performance is between the 25th percentile and the 50th percentile, or between the 50th percentile and the 90th percentile, of such BDCs, the amount of the Cash Awards vested and payable and the number of vested and payable Retention PSUs will be determined by linear interpolation between the foregoing metrics. Dividend equivalents will accrue in respect only of the Retention PSUs in the form of additional Retention PSUs, but will not be paid unless the Retention PSUs to which such dividend equivalents relate actually vest. The Cash Awards are not eligible to accrue dividend equivalents.
The Company follows ASC Topic 718 (“Compensation – Stock Compensation”) to account for the Retention PSUs and Cash Awards granted. Under ASC Topic 718, compensation cost associated with Retention PSUs is measured at the grant date based on the fair value of the award and is recognized over the Performance Period. As the Cash Awards are settled in cash, the award is expensed as a liability, and will be re-measured at each reporting period until the Performance Period is complete. The compensation expense for these awards is based on the per unit grant date valuation using a Monte-Carlo simulation multiplied by the target payout level. The payout level is calculated based the Company’s TSR relative to specified BDCs during the performance period.
As of December 31, 2018, all of Retention PSUs and Cash Awards were unvested and there was approximately $15.2 million of total unrecognized compensation costs related to the Retention PSUs. These costs are expected to be recognized over a weighted average remaining vesting period of 3.34 years. As of December 31, 2018, there was approximately $554,000 of total compensation expense related to the Cash Awards. The accumulated expense related to the Cash Awards is included within the Consolidated Statement of Assets and Liabilities.
On May 13, 2018, the Board of Directors further amended and restated the 2004 Plan and renamed it the Hercules Capital, Inc. Amended and Restated 2018 Equity Incentive Plan. Under the 2004 Plan, prior to the amendment and restatement, the Company was authorized to issue 12.0 million shares of common stock. The 2018 Equity Incentive Plan, among other things, increased the number of shares available for issuance to eligible participants by an additional 6.7 million shares. Unless sooner terminated by the Board, the 2018 Equity Incentive Plan will terminate on the day before the tenth anniversary of the date the 2018 Equity Incentive Plan was initially adopted in 2018 by the Board. On May 13, 2018, the Board of Directors adopted the Director Plan. The Director Plan provides equity compensation in the form of restricted stock to the Company’s non-employee directors. Subject to certain adjustments, the maximum aggregate number of shares of stock that may be authorized for issuance as restricted stock awards granted under the Director Plan is 300,000 shares. Unless sooner terminated by the Board, the Director Plan will terminate on the day before the tenth anniversary of the date the Director Plan was initially adopted in 2018 by the Board. The 2018 Equity Incentive Plan and the Director Plan were each approved by stockholders on June 28, 2018. For further information, please see our Proxy Statement filed with the SEC on May 29, 2018 in connection with our 2018 Annual Meeting of Stockholders.
Additionally, on May 29, 2018, the Company filed an exemptive application with the SEC and an amendment to the application on September 27, 2018, with respect to the 2018 Equity Incentive Plan and the Director Plan for an exemptive order from certain provisions of the 1940 Act. On January 30, 2019, the Company received approval from the SEC on its request for exemptive relief that permits it to issue restricted stock to non-employee directors under the Director Plan and restricted stock and restricted stock units to certain of its employees, officers, and directors (excluding non-employee directors) under the 2018 Equity Incentive Plan. The exemptive order also allows participants in the Director Plan and the 2018 Equity Incentive Plan to (i) elect to have the Company withhold shares of its common stock to pay for the exercise price and applicable taxes with respect to an option exercise (“net issuance exercise”) and/or (ii) permit the holders of restricted stock to elect to have it withhold shares of its stock to pay the applicable taxes due on restricted stock at the time of vesting. Each individual would be able to make a cash payment at the time of option exercise or to pay taxes on restricted stock.
166
The following table summarizes the common stock options activities for each of the three periods ended December 31, 2018, 2017, and 2016:
|
|
Common Stock Options |
|
|
Weighted Average Exercise Price |
|
|||
|
Shares Outstanding at December 31, 2015 |
|
|
622,171 |
|
|
$ |
14.25 |
|
|
Granted |
|
|
230,000 |
|
|
$ |
12.16 |
|
|
Exercised |
|
|
(36,500 |
) |
|
$ |
11.05 |
|
|
Forfeited |
|
|
(82,895 |
) |
|
$ |
13.41 |
|
|
Expired |
|
|
(64,605 |
) |
|
$ |
15.05 |
|
|
Shares Outstanding at December 31, 2016 |
|
|
668,171 |
|
|
$ |
13.73 |
|
|
Granted |
|
|
115,000 |
|
|
$ |
14.24 |
|
|
Exercised |
|
|
(29,921 |
) |
|
$ |
11.31 |
|
|
Forfeited |
|
|
(39,394 |
) |
|
$ |
13.98 |
|
|
Expired |
|
|
(123,331 |
) |
|
$ |
15.36 |
|
|
Shares Outstanding at December 31, 2017 |
|
|
590,525 |
|
|
$ |
13.60 |
|
|
Granted |
|
|
114,000 |
|
|
$ |
12.55 |
|
|
Exercised |
|
|
(63,769 |
) |
|
$ |
11.05 |
|
|
Forfeited |
|
|
(53,438 |
) |
|
$ |
13.27 |
|
|
Expired |
|
|
(106,286 |
) |
|
$ |
15.08 |
|
|
Shares Outstanding at December 31, 2018 |
|
|
481,032 |
|
|
$ |
13.40 |
|
|
Shares Expected to Vest at December 31, 2018 |
|
|
157,516 |
|
|
$ |
13.67 |
|
Options generally vest 33% one year after the date of grant and ratably over the succeeding 24 months. All options may be exercised for a period ending seven years after the date of grant. At December 31, 2018, options for approximately 481,032 shares were outstanding at a weighted average exercise price of approximately $13.40 per share with weighted average of remaining contractual term of 4.79 years and an aggregate intrinsic value of $8,000. At December 31, 2018, options for approximately 323,516 shares were exercisable at a weighted average exercise price of approximately $13.67 per share with weighted average of remaining contractual term of 4.07 years and an aggregate intrinsic value of $7,500.
The Company determined that the fair value of options granted under the Plans during the years ended December 31, 2018, 2017, and 2016 was approximately $57,000, $79,000 and $837,000, respectively. During the years ended December 31, 2018, 2017, and 2016, approximately $54,000, $73,000 and $169,000 of share-based cost due to stock option grants was expensed, respectively. As of December 31, 2018, there was approximately $75,000 of total unrecognized compensation costs related to stock options. These costs are expected to be recognized over a weighted average period of 2.08 years.
The Company follows ASC Topic 718 (“Compensation – Stock Compensation”) to account for stock options granted. Under ASC Topic 718, compensation expense associated with stock-based compensation is measured at the grant date based on the fair value of the award and is recognized over the vesting period. Determining the appropriate fair value model and calculating the fair value of stock-based awards at the grant date requires judgment, including estimating stock price volatility, forfeiture rate and expected option life. The fair value of options granted is based upon a Black Scholes option pricing model using the assumptions in the following table for each of the three periods ended December 31, 2018, 2017, and 2016 is as follows:
|
|
Year Ended December 31, |
|
|||||||||
|
2018 |
|
|
2017 |
|
|
2016 |
|
||||
|
Expected Volatility |
|
21.19 |
% |
|
|
23.07 |
% |
|
|
23.73 |
% |
|
Expected Dividends |
|
10 |
% |
|
|
10 |
% |
|
|
10 |
% |
|
Expected term (in years) |
|
4.5 |
|
|
|
4.5 |
|
|
|
4.5 |
|
|
Risk-free rate |
2.19% - 3.08 |
% |
|
1.57% - 2.20 |
% |
|
0.87% - 1.98 |
% |
|||
In 2018, 2017, and 2016, the Company granted approximately 334,995, 10,111 and 555,547 shares, respectively, of restricted stock awards pursuant to the Plans. The Company determined that the fair values, based on grant date close price, of restricted stock awards granted under the Plans during the years ended December 31, 2018, 2017, and 2016 were approximately $4.4 million, $150,000 and $6.7 million. As of December 31, 2018, there was approximately $3.1 million of total unrecognized compensation cost related to restricted stock awards. These costs are expected to be recognized over a weighted average period of 1.97 years.
167
The following table summarizes the activities for the Company’s unvested restricted stock awards for each of the three periods ended, December 31, 2018, 2017, and 2016:
|
|
|
Unvested Restricted Stock Awards |
|
|||||
|
|
|
Restricted |
|
|
Weighted Average |
|
||
|
|
|
Stock Awards |
|
|
Grant Date Fair Value |
|
||
|
Unvested at December 31, 2015 |
|
|
850,072 |
|
|
$ |
13.59 |
|
|
Granted |
|
|
555,547 |
|
|
$ |
12.02 |
|
|
Vested |
|
|
(569,118 |
) |
|
$ |
13.58 |
|
|
Forfeited |
|
|
(36,943 |
) |
|
$ |
12.70 |
|
|
Unvested at December 31, 2016 |
|
|
799,558 |
|
|
$ |
12.54 |
|
|
Granted |
|
|
10,111 |
|
|
$ |
14.83 |
|
|
Vested |
|
|
(511,749 |
) |
|
$ |
12.69 |
|
|
Forfeited |
|
|
(36,675 |
) |
|
$ |
11.91 |
|
|
Unvested at December 31, 2017 |
|
|
261,245 |
|
|
$ |
12.43 |
|
|
Granted |
|
|
334,995 |
|
|
$ |
13.04 |
|
|
Vested |
|
|
(212,285 |
) |
|
$ |
12.47 |
|
|
Forfeited |
|
|
(3,085 |
) |
|
$ |
11.70 |
|
|
Unvested at December 31, 2018 |
|
|
380,870 |
|
|
$ |
12.95 |
|
In 2018 and 2017, the Company granted approximately 411,689 and 600,461 shares, respectively, of restricted stock units pursuant to the Plans. The Company determined that the fair values, based on grant date close price, of restricted stock units granted under the Plans during the years ended December 31, 2018 and 2017 were approximately $6.8 million and $13.0 million. As of December 31, 2018 there was approximately $6.2 million of total unrecognized compensation cost related to restricted stock units. These costs are expected to be recognized over a weighted average period of 1.61 years.
The following table summarizes the activities for the Company’s unvested restricted stock units for the year ended December 31, 2018 and 2017:
|
|
|
Unvested Restricted Stock Units |
|
|||||
|
|
|
Restricted |
|
|
Weighted Average |
|
||
|
|
|
Stock Units |
|
|
Grant Date Fair Value |
|
||
|
Unvested at December 31, 2016 |
|
|
— |
|
|
$ |
— |
|
|
Granted |
|
|
600,461 |
|
|
$ |
14.21 |
|
|
Distribution Equivalent Unit Granted |
|
|
54,674 |
|
|
$ |
13.02 |
|
|
Vested |
|
|
— |
|
|
$ |
— |
|
|
Forfeited |
|
|
(60,813 |
) |
|
$ |
13.40 |
|
|
Unvested at December 31, 2017 |
|
|
594,322 |
|
|
$ |
12.99 |
|
|
Granted |
|
|
411,689 |
|
|
$ |
13.04 |
|
|
Distribution Equivalent Unit Granted |
|
|
103,774 |
|
|
$ |
— |
|
|
Vested (1) |
|
|
(362,630 |
) |
|
$ |
14.21 |
|
|
Forfeited |
|
|
(14,622 |
) |
|
$ |
13.38 |
|
|
Unvested at December 31, 2018 |
|
|
732,533 |
|
|
$ |
13.50 |
|
|
(1) |
Pursuant to the December 29, 2016 amendment and restatement of the 2004 plan, receipt of the shares of the Company’s common stock underlying vested restricted stock units will be deferred for 4 years from grant date unless certain conditions are met. As such, vested restricted stock units will not be issued as common stock upon vesting until the completion of the deferral period. |
During the years ended December 31, 2018, 2017, and 2016 the Company expensed approximately $8.2 million, $7.2 million and $7.0 million of compensation expense related to restricted stock awards and restricted stock units, respectively.
168
Shares used in the computation of the Company’s basic and diluted earnings per share are as follows:
|
|
|
Year Ended December 31, |
|
|||||||||
|
(in thousands, except per share data) |
|
2018 |
|
|
2017 |
|
|
2016 |
|
|||
|
Numerator |
|
|
|
|
|
|
|
|
|
|
|
|
|
Net increase in net assets resulting from operations |
|
$ |
76,496 |
|
|
$ |
78,998 |
|
|
$ |
68,703 |
|
|
Less: Distributions declared-common and restricted shares |
|
|
(114,728 |
) |
|
|
(103,087 |
) |
|
|
(92,333 |
) |
|
Undistributed earnings |
|
|
(38,232 |
) |
|
|
(24,089 |
) |
|
|
(23,630 |
) |
|
Undistributed earnings-common shares |
|
|
(38,232 |
) |
|
|
(24,089 |
) |
|
|
(23,630 |
) |
|
Add: Distributions declared-common shares |
|
|
114,153 |
|
|
|
102,516 |
|
|
|
91,065 |
|
|
Numerator for basic and diluted change in net assets per common share |
|
$ |
75,921 |
|
|
$ |
78,427 |
|
|
$ |
67,435 |
|
|
|
|
|
|
|
|
|
|
|
|
|
|
|
|
Denominator |
|
|
|
|
|
|
|
|
|
|
|
|
|
Basic weighted average common shares outstanding |
|
|
90,929 |
|
|
|
82,519 |
|
|
|
73,753 |
|
|
Common shares issuable |
|
|
128 |
|
|
|
121 |
|
|
|
22 |
|
|
Weighted average common shares outstanding assuming dilution |
|
|
91,057 |
|
|
|
82,640 |
|
|
|
73,775 |
|
|
|
|
|
|
|
|
|
|
|
|
|
|
|
|
Change in net assets per common share |
|
|
|
|
|
|
|
|
|
|
|
|
|
Basic |
|
$ |
0.83 |
|
|
$ |
0.95 |
|
|
$ |
0.91 |
|
|
Diluted |
|
$ |
0.83 |
|
|
$ |
0.95 |
|
|
$ |
0.91 |
|
In the table above, unvested share-based payment awards that have non-forfeitable rights to distributions or distribution equivalents are treated as participating securities for calculating earnings per share. Unvested common stock options and restricted stock units are also considered for the purpose of calculating diluted earnings per share.
For the years ended December 31, 2018 and 2017, the effect of the 2022 Convertible Notes under the treasury stock method were anti-dilutive and, accordingly, were excluded from the calculation of diluted earnings per share. The 2016 Convertible Notes were fully settled on or before their contractual maturity date of April 15, 2016, as such there was no potential additional dilutive effect for the year ended December 31, 2016.
The calculation of change in net assets resulting from operations per common share—assuming dilution, excludes all anti-dilutive shares. For the year ended December 31, 2018, the number of anti-dilutive shares, as calculated based on the weighted average closing price of the Company’s common stock for the periods, consisted of 4.2 million shares of 2022 Convertible Notes, 62,462 shares of unvested common stock options, no shares of unvested restricted stock units and 13,444 shares of unvested Retention PSUs. For the year ended December 31, 2017, the number of anti-dilutive shares consisted of 2.8 million shares of 2022 Convertible Notes, 46,831 shares of unvested common stock options, and no shares of unvested restricted stock units. For the year ended December 31, 2016, the number of anti-dilutive shares related to unvested common stock options was 676,133 shares.
At December 31, 2018 and 2017, the Company was authorized to issue 200.0 million shares of common stock with a par value of $0.001. Each share of common stock entitles the holder to one vote.
169
Following is a schedule of financial highlights for the five years ended December 31, 2018, 2017, 2016, 2015, and 2014:
|
|
|
Year Ended December 31, |
|
|
|||||||||||||||||
|
|
2018 |
|
|
2017 |
|
|
2016 |
|
|
2015 |
|
|
2014 |
|
|
||||||
|
Per share data (1): |
|
|
|
|
|
|
|
|
|
|
|
|
|
|
|
|
|
|
|
|
|
|
Net asset value at beginning of period |
|
$ |
9.96 |
|
|
$ |
9.90 |
|
|
$ |
9.94 |
|
|
$ |
10.18 |
|
|
$ |
10.51 |
|
|
|
Net investment income |
|
|
1.20 |
|
|
|
1.17 |
|
|
|
1.36 |
|
|
|
1.06 |
|
|
|
1.16 |
|
|
|
Net realized gain (loss) on investments |
|
|
(0.12 |
) |
|
|
(0.32 |
) |
|
|
0.06 |
|
|
|
0.07 |
|
|
|
0.32 |
|
|
|
Net unrealized appreciation (depreciation) on investments |
|
|
(0.23 |
) |
|
|
0.11 |
|
|
|
(0.49 |
) |
|
|
(0.51 |
) |
|
|
(0.33 |
) |
|
|
Total from investment operations |
|
|
0.85 |
|
|
|
0.96 |
|
|
|
0.93 |
|
|
|
0.62 |
|
|
|
1.15 |
|
|
|
Net increase (decrease) in net assets from capital share transactions (1) |
|
|
0.23 |
|
|
|
0.26 |
|
|
|
0.18 |
|
|
|
0.26 |
|
|
|
(0.37 |
) |
|
|
Distributions of net investment income (6) |
|
|
(1.26 |
) |
|
|
(1.07 |
) |
|
|
(1.14 |
) |
|
|
(1.04 |
) |
|
|
(1.27 |
) |
|
|
Distributions of capital gains (6) |
|
|
— |
|
|
|
(0.18 |
) |
|
|
(0.11 |
) |
|
|
(0.22 |
) |
|
|
— |
|
|
|
Stock-based compensation expense included in investment income (2) |
|
|
0.12 |
|
|
|
0.09 |
|
|
|
0.10 |
|
|
|
0.14 |
|
|
|
0.16 |
|
|
|
Net asset value at end of period |
|
$ |
9.90 |
|
|
$ |
9.96 |
|
|
$ |
9.90 |
|
|
$ |
9.94 |
|
|
$ |
10.18 |
|
|
|
|
|
|
|
|
|
|
|
|
|
|
|
|
|
|
|
|
|
|
|
|
|
|
Ratios and supplemental data: |
|
|
|
|
|
|
|
|
|
|
|
|
|
|
|
|
|
|
|
|
|
|
Per share market value at end of period |
|
$ |
11.05 |
|
|
$ |
13.12 |
|
|
$ |
14.11 |
|
|
$ |
12.19 |
|
|
$ |
14.88 |
|
|
|
Total return (3) |
|
|
(7.56 |
%) |
|
|
1.47 |
% |
|
|
26.87 |
% |
|
|
(9.70 |
%) |
|
|
(1.75 |
%) |
|
|
Shares outstanding at end of period |
|
|
96,501 |
|
|
|
84,424 |
|
|
|
79,555 |
|
|
|
72,118 |
|
|
|
64,715 |
|
|
|
Weighted average number of common shares outstanding |
|
|
90,929 |
|
|
|
82,519 |
|
|
|
73,753 |
|
|
|
69,479 |
|
|
|
61,862 |
|
|
|
Net assets at end of period |
|
$ |
955,444 |
|
|
$ |
840,967 |
|
|
$ |
787,944 |
|
|
$ |
717,134 |
|
|
$ |
658,864 |
|
|
|
Ratio of total expense to average net assets (4) |
|
|
10.73 |
% |
|
|
11.37 |
% |
|
|
11.25 |
% |
|
|
11.55 |
% |
|
|
10.97 |
% |
|
|
Ratio of net investment income before investment gains and losses to average net assets (4) |
|
|
11.78 |
% |
|
|
11.61 |
% |
|
|
13.65 |
% |
|
|
10.15 |
% |
|
|
10.94 |
% |
|
|
Portfolio turnover rate (5) |
|
|
38.76 |
% |
|
|
49.03 |
% |
|
|
36.22 |
% |
|
|
46.34 |
% |
|
|
56.15 |
% |
|
|
Weighted average debt outstanding |
|
$ |
826,931 |
|
|
$ |
784,455 |
|
|
$ |
635,365 |
|
|
$ |
615,198 |
|
|
$ |
535,127 |
|
|
|
Weighted average debt per common share |
|
$ |
9.09 |
|
|
$ |
9.51 |
|
|
$ |
8.61 |
|
|
$ |
8.85 |
|
|
$ |
8.65 |
|
|
|
(1) |
All per share activity is calculated based on the weighted average shares outstanding for the relevant period, except net increase (decrease) in net assets from capital share transactions, which is based on the common shares outstanding as of the relevant balance sheet date. |
|
(2) |
Stock option expense is a non-cash expense that has no effect on net asset value. Pursuant to ASC Topic 718, net investment income includes the expense associated with the granting of stock options which is offset by a corresponding increase in paid-in capital. |
|
(3) |
The total return for the years ended December 31, 2018, 2017, 2016, 2015, and 2014 equals the change in the ending market value over the beginning of the period price per share plus distributions paid per share during the period, divided by the beginning price assuming the distribution is reinvested on the date of the distribution. As such, the total return is not annualized. The total return does not reflect any sales load that must be paid by investors. |
|
(4) |
The ratios are calculated based on weighted average net assets for the relevant period and are annualized. |
|
(5) |
The portfolio turnover rate for the years ended December 31, 2018, 2017, 2016, 2015, and 2014 equals the lesser of investment portfolio purchases or sales during the period, divided by the average investment portfolio value during the period. As such, portfolio turnover rate is not annualized. |
|
(6) |
Includes distributions on unvested restricted stock awards. |
170
10. Commitments and Contingencies
The Company’s commitments and contingencies consist primarily of unused commitments to extend credit in the form of loans to the Company’s portfolio companies. A portion of these unfunded contractual commitments as of December 31, 2018 are dependent upon the portfolio company reaching certain milestones before the debt commitment becomes available. Furthermore, the Company’s credit agreements contain customary lending provisions which allow the Company relief from funding obligations for previously made commitments in instances where the underlying company experiences materially adverse events that affect the financial condition or business outlook for the Company. Since a portion of these commitments may expire without being drawn, unfunded contractual commitments do not necessarily represent future cash requirements. As such, the Company’s disclosure of unfunded contractual commitments includes only those which are available at the request of the portfolio company and unencumbered by milestones.
At December 31, 2018, the Company had approximately $139.0 million of unfunded commitments, including undrawn revolving facilities, which were available at the request of the portfolio company and unencumbered by milestones.
The Company also had approximately $55.5 million of non-binding term sheets outstanding at December 31, 2018. Non-binding outstanding term sheets are subject to completion of the Company’s due diligence and final investment committee approval process, as well as the negotiation of definitive documentation with the prospective portfolio companies. These non-binding term sheets generally convert to contractual commitments in approximately 90 days from signing. Not all non-binding term sheets are expected to close and do not necessarily represent future cash requirements.
The fair value of the Company’s unfunded commitments is considered to be immaterial as the yield determined at the time of underwriting is expected to be materially consistent with the yield upon funding, given that interest rates are generally pegged to market indices and given the existence of milestones, conditions and/or obligations imbedded in the borrowing agreements.
As of December 31, 2018, the Company’s unfunded contractual commitments available at the request of the portfolio company, including undrawn revolving facilities, and unencumbered by milestones are as follows:
|
(in thousands) |
|
|
|
|
|
Portfolio Company |
|
Unfunded Commitments (1) |
|
|
|
Thumbtack, Inc. |
|
$ |
25,000 |
|
|
Couchbase, Inc. |
|
|
20,000 |
|
|
Impossible Foods, Inc. |
|
|
20,000 |
|
|
Postmates, Inc. |
|
|
15,000 |
|
|
Businessolver.com, Inc. |
|
|
9,563 |
|
|
DocuTAP, Inc. |
|
|
6,000 |
|
|
Achronix Semiconductor Corporation |
|
|
5,000 |
|
|
Clarabridge, Inc. |
|
|
5,000 |
|
|
Evernote Corporation |
|
|
5,000 |
|
|
PH Group Holdings |
|
|
5,000 |
|
|
Xometry, Inc. |
|
|
4,000 |
|
|
Lithium Technologies, Inc. |
|
|
3,623 |
|
|
Fastly, Inc. |
|
|
3,333 |
|
|
Intent Media, Inc. |
|
|
3,000 |
|
|
Emma, Inc. |
|
|
2,963 |
|
|
Convercent, Inc. |
|
|
2,500 |
|
|
Credible Behavioral Health, Inc. |
|
|
2,500 |
|
|
Greenphire, Inc. |
|
|
500 |
|
|
Insurance Technologies Corporation |
|
|
500 |
|
|
Salsa Labs, Inc. |
|
|
500 |
|
|
Total |
|
$ |
138,982 |
|
|
(1) |
Amount represents unfunded commitments, including undrawn revolving facilities, which are available at the request of the portfolio company. Amount excludes unfunded commitments which are unavailable due to the borrower having not met certain milestones. |
171
Certain premises are leased or licensed under agreements which expire at various dates through June 2027. Total rent expense amounted to approximately $2.1 million, $1.8 million and $1.7 million, during the years ended December 31, 2018, 2017 and 2016, respectively. The Company’s contractual obligations as of December 31, 2018 include:
|
|
|
Payments due by period (in thousands) |
|
|||||||||||||||||
|
Contractual Obligations (1) |
|
Total |
|
|
Less than 1 year |
|
|
1 - 3 years |
|
|
3 - 5 years |
|
|
After 5 years |
|
|||||
|
Borrowings (2)(3)(5) |
|
$ |
980,466 |
|
|
$ |
96,617 |
|
|
$ |
103,599 |
|
|
$ |
465,250 |
|
|
$ |
315,000 |
|
|
Operating Lease Obligations (4) |
|
|
15,915 |
|
|
|
3,217 |
|
|
|
5,766 |
|
|
|
5,420 |
|
|
|
1,512 |
|
|
Total |
|
$ |
996,381 |
|
|
$ |
99,834 |
|
|
$ |
109,365 |
|
|
$ |
470,670 |
|
|
$ |
316,512 |
|
|
(1) |
Excludes commitments to extend credit to the Company’s portfolio companies. |
|
(2) |
Includes $149.0 million in principal outstanding under the SBA debentures, $150.0 million of the 2022 Notes, $83.5 million of the 2024 Notes, 75.0 million of the 2025 Notes, $40.0 million of the 2033 Notes, $230.0 million of the 2022 Convertible Notes, $200.0 million of the 2027 Asset-Backed Notes, $13.1 million under the Wells Facility, and $39.8 million under the Union Credit Facility as of December 31, 2018. |
|
(3) |
Amounts represent future principal repayments and not the carrying value of each liability. See Note 4 to the Company’s consolidated financial statements. |
|
(4) |
Facility leases and licenses. |
|
(5) |
Reflects announced redemption of a portion of the 2024 Notes in December 2018. See “Note 14– Subsequent Events.” |
The Company may, from time to time, be involved in litigation arising out of its operations in the normal course of business or otherwise. Furthermore, third parties may try to seek to impose liability on the Company in connection with the activities of its portfolio companies. While the outcome of any current legal proceedings cannot at this time be predicted with certainty, the Company does not expect any current matters will materially affect the Company’s financial condition or results of operations; however, there can be no assurance whether any pending legal proceedings will have a material adverse effect on the Company’s financial condition or results of operations in any future reporting period.
11. Indemnification
The Company has entered into indemnification agreements with our directors and executive officers. The indemnification agreements are intended to provide our directors and executive officers the maximum indemnification permitted under Maryland law and the 1940 Act. Each indemnification agreement provides that we shall indemnify the director or executive officer who is a party to the agreement, or an “Indemnitee,” including the advancement of legal expenses, if, by reason of his or her corporate status, the Indemnitee is, or is threatened to be, made a party to or a witness in any threatened, pending, or completed proceeding, to the maximum extent permitted by Maryland law and the 1940 Act.
The Company and its executives and directors are covered by Directors and Officers Insurance, with the directors and officers being indemnified by us to the maximum extent permitted by Maryland law subject to the restrictions in the 1940 Act.
12. Concentrations of Credit Risk
The Company’s customers are primarily privately held companies and public companies which are active in the drug discovery & development, software, internet consumer & business services, media/content/info, sustainable and renewable technology, medical devices & equipment, drug delivery, healthcare services, specialty pharmaceuticals, information services, consumer & business products, surgical devices, semiconductors, electronics & computer hardware, communications & networking, biotechnology tools, diversified financial services and diagnostic industry sectors. These sectors are characterized by high margins, high growth rates, consolidation and product and market extension opportunities. Value for companies in these sectors is often vested in intangible assets and intellectual property.
Industry and sector concentrations vary as new loans are recorded and loans pay off. Loan revenue, consisting of interest, fees, and recognition of gains on equity and warrant or other equity-related interests, can fluctuate materially when a loan is paid off or a related warrant or equity interest is sold. Revenue recognition in any given year can be highly concentrated among several portfolio companies.
For the years ended December 31, 2018 and December 31, 2017, the Company’s ten largest portfolio companies represented approximately 28.2% and 34.6% of the total fair value of the Company’s investments in portfolio companies, respectively. At both December 31, 2018 and December 31, 2017, the Company had seven portfolio companies that represented 5% or more of the Company’s net assets. At December 31, 2018, the Company had five equity investments representing approximately 53.0% of the total fair value of the Company’s equity investments, and each represented 5% or more of the total fair value of the Company’s equity investments. At December 31, 2017, the Company had nine equity investments which represented approximately 67.1% of the total fair value of the Company’s equity investments, and each represented 5% or more of the total fair value of such investments.
172
13. Selected Quarterly Data (Unaudited)
The following tables set forth certain quarterly financial information for each of the last eight quarters ended December 31, 2018. This information was derived from the Company’s unaudited consolidated financial statements. Results for any quarter are not necessarily indicative of results for the full year or for any further quarter.
|
|
|
Quarter Ended |
|
|||||||||||||
|
(in thousands, except per share data) |
|
March 31, 2018 |
|
|
June 30, 2018 |
|
|
September 30, 2018 |
|
|
December 31, 2018 |
|
||||
|
Total investment income |
|
$ |
48,700 |
|
|
$ |
49,562 |
|
|
$ |
52,602 |
|
|
$ |
56,889 |
|
|
Net investment income |
|
|
26,063 |
|
|
|
22,774 |
|
|
|
29,302 |
|
|
|
30,590 |
|
|
Net increase (decrease) in net assets resulting from operations |
|
|
5,946 |
|
|
|
52,060 |
|
|
|
35,629 |
|
|
|
(17,139 |
) |
|
Change in net assets resulting from operations per common share (basic) |
|
$ |
0.07 |
|
|
$ |
0.59 |
|
|
$ |
0.37 |
|
|
$ |
(0.18 |
) |
|
|
|
|
|
|
|
|
|
|
|
|
|
|
|
|
|
|
|
|
|
Quarter Ended |
|
|||||||||||||
|
|
|
March 31, 2017 |
|
|
June 30, 2017 |
|
|
September 30, 2017 |
|
|
December 31, 2017 |
|
||||
|
Total investment income |
|
$ |
46,365 |
|
|
$ |
48,452 |
|
|
$ |
45,865 |
|
|
$ |
50,198 |
|
|
Net investment income |
|
|
22,678 |
|
|
|
25,275 |
|
|
|
23,973 |
|
|
|
24,518 |
|
|
Net increase (decrease) in net assets resulting from operations |
|
|
(5,588 |
) |
|
|
33,149 |
|
|
|
33,072 |
|
|
|
18,365 |
|
|
Change in net assets resulting from operations per common share (basic) |
|
$ |
(0.07 |
) |
|
$ |
0.40 |
|
|
$ |
0.40 |
|
|
$ |
0.22 |
|
14. Subsequent Events
Distribution Declaration
On February 13, 2019 the Company’s Board of Directors declared a cash distribution of $0.31 per share to be paid on March 11, 2019 to shareholders of record as of March 4, 2019. This distribution represents the Company’s fifty-fourth consecutive distribution since the Company’s IPO, bringing the total cumulative distribution to date to $15.28 per share.
Restricted Stock Unit Grants
On January 31, 2019, the Company granted 922,494 restricted stock units pursuant to the amended 2004 Plan.
ATM Equity Program Issuances
Subsequent to December 31, 2018 and as of February 15, 2019, the Company did not sell any shares of common under the Equity Distribution Agreement with JMP. As of February 15, 2019 approximately 5.3 million shares remain available for issuance and sale under the equity distribution agreement.
Share Repurchase Program
Subsequent to December 31, 2018 and as of February 15, 2019, the Company did not repurchase any shares of its common stock. As of February 15, 2019, approximately $20.9 million of common stock remains eligible for repurchase under the stock repurchase plan.
Redemption of 2024 Notes
On December 7, 2018, the Company’s Board of Directors approved a full redemption, in two equal transactions, of $83.5 million of the outstanding aggregate principal amount of the 2024 Notes. The 2024 Notes were fully redeemed on January 14, 2019 and February 4, 2019.
Wells Fargo Facility
On January 11, 2019, the Company entered into the Seventh Amendment to the Wells Facility. Among others, the Amendment amends certain key provisions of the Wells Facility to increase Wells Fargo Capital Finance’s commitments thereunder from $75.0 million to $125.0 million, reduces the current interest rate to LIBOR plus 3.00% with a natural floor of 3.00%, and extends the maturity date to January 2023.
173
On February 20, 2019, the Company, through a special purpose wholly-owned subsidiary, Hercules Funding IV LLC, as borrower, entered into the 2019 Union Bank Credit Facility with Union Bank, as the arranger and administrative agent, and the lenders party thereto from time to time. Under the 2019 Union Bank Credit Facility, the lenders have made commitments of $200.0 million and the facility contains an uncommitted accordion feature, in which the Company can increase the credit line up to an aggregate of $300.0 million. Borrowings under the 2019 Union Bank Credit Facility will generally bear interest at a rate per annum equal to LIBOR plus 2.70%, and the facility will generally have an advance rate of 55% against eligible debt investments. The 2019 Union Bank Credit Facility matures on February 20, 2022, plus a 12-month amortization period, unless sooner terminated in accordance with its terms.
Election of Directors
On January 11, 2019, the Board of Directors elected Carol L. Foster as a director of the Company. Ms. Foster will be entitled to the applicable annual retainer and restricted stock awards pursuant to the Company’s director compensation arrangements. Ms. Foster will also be entitled to enter into an indemnification agreement with the Company. Ms. Foster will hold office as a Class I director for a term expiring in 2020 and does not currently serve on any committees of the Company.
On February 4, 2019, the Board of Directors elected Gayle Crowell as our director. Ms. Crowell will be entitled to the applicable annual retainer and restricted stock awards pursuant to our director compensation arrangements. Ms. Crowell will also be entitled to enter into an indemnification agreement with us. Ms. Crowell will hold office as a Class II director for a term expiring in 2021 and does not currently serve on any committees.
2028 Asset-Backed Notes
On January 22, 2019, the Company completed a term debt securitization in connection with which an affiliate of the Company made an offering of $250,000,000 in aggregate principal amount of the 2028 Asset-Backed Notes, which were rated A(sf) KBRA. The Notes were issued by the 2019 Securitization Issuer pursuant to an indenture, dated as of January 22, 2019, by and between U.S. Bank National Association, as indenture trustee, and the 2019 Securitization Issuer, were offered pursuant to a note purchase agreement, dated as of January 14, 2019, by and among the Company, the 2019 Trust Depositor, the 2019 Securitization Issuer, Guggenheim Securities, LLC, as Initial Purchaser, MUFG Securities Americas Inc., as a co-manager, and Wells Fargo Securities, LLC, as a co-manager, and are backed by a pool of senior loans made to certain portfolio companies of the Company and secured by certain assets of those portfolio companies and are to be serviced by the Company. The outstanding principal balance of the pool of loans as of December 31, 2018 was approximately $357,179,128. Interest on the 2028 Asset-Backed Notes will be paid, to the extent of funds available, at a fixed rate of 4.703% per annum. The 2028 Asset-Backed Notes have a stated maturity of February 22, 2028.
Portfolio Company Developments
As of February 15, 2019, we held warrants or equity positions in five companies that have filed registration statements on Form S-1 with the SEC in contemplation of potential initial public offerings. Four companies filed confidentially under the JOBS Act and one company filed a preliminary prospectus in connection with a proposed public offering on the Toronto Stock Exchange (TSX). There can be no assurance that these companies will complete their initial public offerings in a timely manner or at all. In addition, subsequent to December 31, 2018, the Company’s portfolio companies announced or completed the following events:
|
|
1. |
In December 2018, the Company’s portfolio company, Art.com, Inc., one of the largest online sellers of art and wall décor globally, entered into a definitive agreement to be acquired by Walmart (NYSE: WMT), a multinational retail corporation that operates a chain of hypermarket, discount department stores and grocery stores. The deal was completed in February 2019. Terms of the acquisition were not disclosed. |
|
|
2. |
In January 2018, the Company’s portfolio company, Labcyte, Inc., a global biotechnology tools company developing acoustic liquid handling, was acquired by Beckman Coulter Life Sciences, a developer and manufacturer of products that simplify, automate and innovate complex biomedical testing. Labcyte will transition into Beckman Coulter Life Sciences under the larger Danaher Life Sciences platform of companies. Terms of the acquisition were not disclosed. |
|
|
3. |
In February 2019, the Company’s portfolio company Stealth Bio Therapeutics Corp., (NASDAQ: MITO), a clinical-stage biopharmaceutical company developing therapeutics to treat mitochondrial dysfunction, completed its IPO offering 6.5 million American Depositary Shares, at an initial public offering price of $12.00 per ADS. |
|
|
4. |
In February 2019, the Company’s portfolio company Avedro, Inc. (NASDAQ: AVDR), a leading commercial-stage ophthalmic medical technology company focused on treating corneal ectatic disorders and improving vision to reduce dependency on eyeglasses or contact lenses, completed its IPO offering 5.0 million shares at an initial public offering price of $14.00 per share |
174
Not Applicable.
1. Disclosure Controls and Procedures
The Company’s chief executive and chief financial officers, under the supervision and with the participation of the Company’s management, conducted an evaluation of the Company’s disclosure controls and procedures, as defined in Rules 13a-15(e) and 15d-15(e) under the Exchange Act. As of the end of the period covered by this Annual Report, the Company’s chief executive and chief financial officers have concluded that the Company’s disclosure controls and procedures were effective to ensure that information required to be disclosed by the Company in reports that the Company files or submits under the Exchange Act is recorded, processed, summarized, and reported within the time periods specified in SEC rules and forms, and that information required to be disclosed by the Company in the reports that the Company files or submits under the Exchange Act is accumulated and communicated to the Company’s management, including the Company’s chief executive and chief financial officers, as appropriate to allow timely decisions regarding required disclosure.
2. Internal Control Over Financial Reporting
a. Management’s Annual Report on Internal Control over Financial Reporting
The Company is responsible for establishing and maintaining adequate internal control over financial reporting and for the assessment of the effectiveness of internal control over financial reporting. As defined by the SEC, internal control over financial reporting is a process designed under the supervision of the Company’s principal executive and principal financial and accounting officer, approved and monitored by the Company’s Board of Directors, and implemented by management and other personnel, to provide reasonable assurance regarding the reliability of financial reporting and the preparation of financial statements in accordance with U.S. GAAP.
The Company’s internal control over financial reporting is supported by written policies and procedures, that (1) pertain to the maintenance of records that, in reasonable detail, accurately and fairly reflect the transactions and dispositions of the Company’s assets; (2) provide reasonable assurance that transactions are recorded as necessary to permit preparation of financial statements in accordance with U.S. GAAP, and that receipts and expenditures of the Company are being made only in accordance with authorizations of the Company’s management and directors; and (3) provide reasonable assurance regarding prevention or timely detection of unauthorized acquisition, use or disposition of the Company’s assets that could have a material effect on the financial statements.
Because of its inherent limitations, internal control over financial reporting may not prevent or detect misstatements. Also, projections of any evaluation of effectiveness to future periods are subject to the risk that controls may become inadequate because of changes in conditions, or that the degree of compliance with the policies or procedures may deteriorate.
Management of the Company conducted an assessment of the effectiveness of the Company’s internal control over financial reporting as of December 31, 2018 based on criteria established in Internal Control— Integrated Framework (2013) issued by the Committee of Sponsoring Organizations of the Treadway Commission, or the COSO Framework. Based on this assessment, management has concluded that the Company’s internal control over financial reporting was effective as of December 31, 2018.
Report of the Independent Registered Public Accounting Firm
The effectiveness of the Company’s internal control over financial reporting as of December 31, 2018 has been audited by PricewaterhouseCoopers LLP, an independent registered public accounting firm who also audited the Company’s consolidated financial statements, as stated in their report, which is included in this Annual Report on Form 10K.
Changes in Internal Control over Financial Reporting in 2018
There have been no changes in the Company’s internal control over financing reporting, as defined in Rules 13a-15(f) and 15d-15(f) of the Exchange Act, which occurred during the Company’s most recently completed fiscal quarter that has materially affected, or is reasonably likely to materially affect, the Company’s internal control over financial reporting.
None.
175
Information in response to this Item is incorporated herein by reference to the information provided in the Company’s definitive Proxy Statement for the Company’s 2019 Annual Meeting of Shareholders, or the 2019 Proxy Statement, to be filed with the SEC pursuant to Regulation 14A under the Exchange Act under the headings “Proposal I: Election Of Directors,” “Information About Executive Officers Who Are Not Directors” and “Certain Relationships And Transactions.”
The Company has adopted a code of business conduct and ethics that applies to directors, officers and employees. The code of business conduct and ethics is available on the Company’s website at http//www.htgc.com. The Company will report any amendments to or waivers of a required provision of the code of business conduct and ethics on the Company’s website or in a Form 8-K.
The information with respect to compensation of executives and directors is contained under the caption “Executive Compensation” in the Company’s 2019 Proxy Statement and is incorporated in this Annual Report by reference in response to this item.
|
Item 12. |
Security Ownership of Certain Beneficial Owners and Management and Related Stockholder Matters |
The information with respect to security ownership of certain beneficial owners and management is contained under the captions “Security Ownership of Certain Beneficial Owners and Management” and “Executive Compensation” in the Company’s 2019 Proxy Statement and is incorporated in this Annual Report by reference in response to this item.
The information with respect to certain relationships and related transactions is contained under the caption “Certain Relationships and Transactions” and the caption “Proposal I: Election of Directors” in the Company’s 2019 Proxy Statement and is incorporated in this Annual Report by reference in response to this item.
The information with respect to principal accountant fees and services is contained under the captions “Principal Accountant Fees and Services” and “Proposal II: Ratification of Selection of Independent Registered Public Accountants” in the Company’s 2019 Proxy Statement and is incorporated in this Annual Report by reference to this item.
176
|
1. |
|
Financial Statements |
|
|
|
|
|
|
|
|
|
|
|
|
|
|
The following financial statements of Hercules Capital, Inc. (formerly Hercules Technology Growth Capital, Inc.; the “Company” or the “Registrant”) are filed herewith: |
|
|
|
|
|
|
|
|
|
|
|
|
|
AUDITED FINANCIAL STATEMENTS |
|
|
|
|
|
|
Consolidated Statements of Assets and Liabilities as of December 31, 2018 and December 31, 2017 |
|
98 |
|
|
|
|
Consolidated Statements of Operations for the three years ended December 31, 2018 |
|
100 |
|
|
|
|
Consolidated Statements of Changes in Net Assets for the three years ended December 31, 2018 |
|
101 |
|
|
|
|
Consolidated Statements of Cash Flows for the three years ended December 31, 2018 |
|
102 |
|
|
|
|
Consolidated Schedule of Investments as of December 31, 2018 |
|
104 |
|
|
|
|
Consolidated Schedule of Investments as of December 31, 2017 |
|
119 |
|
|
|
|
|
134 |
|
|
|
|
|
|
|
|
|
2. |
|
The following financial statement schedule is filed herewith: |
|
|
|
|
|
|
|
Consolidated Schedule of Investments In and Advances to Affiliates as of December 31, 2018 |
|
178 |
|
|
|
|
|
|
|
|
3. |
|
Exhibits required to be filed by Item 601 of Regulation S-K. |
|
|
|
|
|
|
|
|
|
|
Not applicable.
177
Schedule 12-14
HERCULES CAPITAL, INC.
CONSOLIDATED SCHEDULE OF INVESTMENTS IN AND ADVANCES TO AFFILIATES
As of and for the year ended December 31, 2018
(in thousands)
|
|
|
|
|
Amount of |
|
|
|
|
|
|
As of |
|
|
|
|
|
|
|
|
|
|
Net Change in |
|
|
As of |
|
|||||||||
|
|
|
|
|
Interest |
|
|
|
|
|
|
December 31, |
|
|
|
|
|
|
|
|
|
|
Unrealized |
|
|
December 31, |
|
|||||||||
|
|
|
|
|
Credited to |
|
|
Realized |
|
|
2017 |
|
|
Gross |
|
|
Gross |
|
|
Appreciation/ |
|
|
2018 |
|
||||||||||||
|
Portfolio Company |
|
Investment(1) |
|
Income(2) |
|
|
Gain (Loss) |
|
|
Fair Value |
|
|
Additions (3) |
|
|
Reductions (4) |
|
|
(Depreciation) |
|
|
Fair Value |
|
||||||||||||
|
Control Investments |
|
|
|
|
|
|
|
|
|
|
|
|
|
|
|
|
|
|
|
|
|
|
|
|
|
|
|
|
|
|
|||||
|
Majority Owned Control Investments |
|
|
|
|
|
|
|
|
|
|
|
|
|
|
|
|
|
|
|
|
|
|
|
|
|
|
|
|
|
|
|||||
|
Achilles Technology Management Co II, Inc. |
|
Common Stock |
|
$ |
— |
|
|
$ |
(2,900 |
) |
|
$ |
242 |
|
|
$ |
— |
|
|
$ |
(3,100 |
) |
|
$ |
2,858 |
|
|
$ |
— |
|
|||||
|
Gibraltar Business Capital, LLC (8) |
|
Unsecured Debt |
|
|
1,508 |
|
|
|
— |
|
|
|
— |
|
|
|
14,729 |
|
|
|
— |
|
|
|
(328 |
) |
|
|
14,401 |
|
|||||
|
|
|
Preferred Stock |
|
|
— |
|
|
|
— |
|
|
|
— |
|
|
|
26,122 |
|
|
|
— |
|
|
|
(2,720 |
) |
|
|
23,402 |
|
|||||
|
|
|
Common Stock |
|
|
— |
|
|
|
— |
|
|
|
— |
|
|
|
1,884 |
|
|
|
— |
|
|
|
(196 |
) |
|
|
1,688 |
|
|||||
|
Total Majority Owned Control Investments |
|
|
|
$ |
1,508 |
|
|
$ |
(2,900 |
) |
|
$ |
242 |
|
|
$ |
42,735 |
|
|
$ |
(3,100 |
) |
|
$ |
(386 |
) |
|
$ |
39,491 |
|
|||||
|
Other Control Investments |
|
|
|
|
|
|
|
|
|
|
|
|
|
|
|
|
|
|
|
|
|
|
|
|
|
|
|
|
|
|
|||||
|
Second Time Around (Simplify Holdings, LLC) (7) |
|
Senior Debt |
|
$ |
— |
|
|
$ |
(1,743 |
) |
|
$ |
— |
|
|
$ |
— |
|
|
$ |
(1,781 |
) |
|
$ |
1,781 |
|
|
$ |
— |
|
|||||
|
Tectura Corporation (5) |
|
Senior Debt |
|
|
1,883 |
|
|
|
335 |
|
|
|
19,219 |
|
|
|
961 |
|
|
|
(335 |
) |
|
|
(1,717 |
) |
|
|
18,128 |
|
|||||
|
|
|
Preferred Stock |
|
|
— |
|
|
|
— |
|
|
|
— |
|
|
|
— |
|
|
|
— |
|
|
|
— |
|
|
|
— |
|
|||||
|
|
|
Common Stock |
|
|
— |
|
|
|
— |
|
|
|
— |
|
|
|
900 |
|
|
|
— |
|
|
|
(900 |
) |
|
|
— |
|
|||||
|
Total Other Control Investments |
|
|
|
$ |
1,883 |
|
|
$ |
(1,408 |
) |
|
$ |
19,219 |
|
|
$ |
1,861 |
|
|
$ |
(2,116 |
) |
|
$ |
(836 |
) |
|
$ |
18,128 |
|
|||||
|
Total Control Investments |
|
|
|
$ |
3,391 |
|
|
$ |
(4,308 |
) |
|
$ |
19,461 |
|
|
$ |
44,596 |
|
|
$ |
(5,216 |
) |
|
$ |
(1,222 |
) |
|
$ |
57,619 |
|
|||||
|
|
|
|
|
|
|
|
|
|
|
|
|
|
|
|
|
|
|
|
|
|
|
|
|
|
|
|
|
|
|
|
|||||
|
Affiliate Investments |
|
|
|
|
|
|
|
|
|
|
|
|
|
|
|
|
|
|
|
|
|
|
|
|
|
|
|
|
|
|
|||||
|
Optiscan BioMedical, Corp. |
|
Preferred Warrants |
|
$ |
— |
|
|
$ |
(680 |
) |
|
$ |
86 |
|
|
$ |
— |
|
|
$ |
(680 |
) |
|
$ |
772 |
|
|
$ |
178 |
|
|||||
|
|
|
Preferred Stock |
|
|
— |
|
|
|
— |
|
|
|
6,205 |
|
|
|
1,301 |
|
|
|
— |
|
|
|
(707 |
) |
|
|
6,799 |
|
|||||
|
Solar Spectrum Holdings LLC (p.k.a. Sungevity, Inc.) (6) |
|
Senior Debt |
|
|
2,058 |
|
|
|
— |
|
|
|
13,604 |
|
|
|
1,800 |
|
|
|
(4,000 |
) |
|
|
— |
|
|
|
11,404 |
|
|||||
|
|
|
Common Stock |
|
|
— |
|
|
|
— |
|
|
|
11,400 |
|
|
|
— |
|
|
|
— |
|
|
|
(8,285 |
) |
|
|
3,115 |
|
|||||
|
Stion Corporation |
|
Preferred Warrants |
|
|
— |
|
|
|
(1,378 |
) |
|
|
— |
|
|
|
— |
|
|
|
(1,378 |
) |
|
|
1,378 |
|
|
|
— |
|
|||||
|
Total Affiliate Investments |
|
$ |
2,058 |
|
|
$ |
(2,058 |
) |
|
$ |
31,295 |
|
|
$ |
3,101 |
|
|
$ |
(6,058 |
) |
|
$ |
(6,842 |
) |
|
$ |
21,496 |
|
|||||||
|
Total Control and Affiliate Investments |
|
$ |
5,449 |
|
|
$ |
(6,366 |
) |
|
$ |
50,756 |
|
|
$ |
47,697 |
|
|
$ |
(11,274 |
) |
|
$ |
(8,064 |
) |
|
$ |
79,115 |
|
|||||||
|
(1) |
Stock and warrants are generally non-income producing and restricted. |
|
(2) |
Represents the total amount of interest or dividends credited to income for the period an investment was an affiliate or control investment. |
|
(3) |
Gross additions include increases in the cost basis of investments resulting from new portfolio investments, paid-in-kind interest or dividends, the amortization of discounts and closing fees and the exchange of one or more existing securities for one or more new securities. |
|
(4) |
Gross reductions include decreases in the cost basis of investments resulting from principal repayments or sales and the exchange of one or more existing securities for one or more new securities. Gross reductions also include previously recognized depreciation on investments that become control or affiliate investments during the period. |
|
(5) |
As of March 31, 2017, the Company's investment in Tectura Corporation became classified as a control investment as of result of obtaining more than 50% representation on the portfolio company's board. In May 2018, the Company purchased common shares, thereby obtaining greater than 25% of voting securities of Tectura as of June 30, 2018. |
|
(6) |
As of September 30, 2017, the Company's investment in Solar Spectrum Holdings LLC (p.k.a. Sungevity, Inc.) became classified as an affiliate investment due to a reduction in equity ownership. Note that this investment was classified as a control investment as of June 30, 2017 after the Company obtained a controlling financial interest. |
|
(7) |
As of February 2018, the Company’s investments in Second Time Around (Simplify Holdings, LLC) were deemed wholly worthless and written off for a realized loss. |
|
(8) |
As of March 31, 2018, the Company's investment in Gibraltar Business Capital, LLC became classified as a control investment as a result of obtaining a controlling financial interest. |
178
HERCULES CAPITAL, INC.
CONSOLIDATED SCHEDULE OF INVESTMENTS IN AND ADVANCES TO AFFILIATES
As of and for the year ended December 31, 2018
(in thousands)
|
Portfolio Company |
|
Industry |
|
Type of Investment (1) |
|
Maturity Date |
|
Interest Rate and Floor |
|
Principal or Shares |
|
|
Cost |
|
|
Value (2) |
|
|||||||||||
|
Control Investments |
|
|
|
|
|
|
|
|
|
|
|
|
|
|
|
|
|
|
||||||||||
|
Majority Owned Control Investments |
|
|
|
|
|
|
|
|
|
|
|
|
||||||||||||||||
|
Gibraltar Business Capital, LLC |
|
Diversified Financial Services |
|
Unsecured Debt |
|
March 2023 |
|
Interest rate FIXED 14.50% |
|
$ |
15,000 |
|
|
$ |
14,729 |
|
|
$ |
14,401 |
|
||||||||
|
|
|
Diversified Financial Services |
|
Preferred Stock |
|
|
|
|
|
|
10,602,752 |
|
|
|
26,122 |
|
|
|
23,402 |
|
||||||||
|
|
|
Diversified Financial Services |
|
Common Stock |
|
|
|
|
|
|
830,000 |
|
|
|
1,884 |
|
|
|
1,688 |
|
||||||||
|
Total Gibraltar Business Capital, LLC |
|
|
|
|
|
|
|
|
|
$ |
42,735 |
|
|
$ |
39,491 |
|
||||||||||||
|
Total Majority Owned Control Investments (4.13%)* |
|
|
|
|
|
|
|
|
|
|
|
$ |
42,735 |
|
|
$ |
39,491 |
|
||||||||||
|
Other Control Investments |
|
|
|
|
|
|
|
|
|
|
|
|
|
|
|
|
|
|
||||||||||
|
Tectura Corporation |
|
Internet Consumer & Business Services |
|
Senior Secured Debt |
|
June 2021 |
|
Interest rate FIXED 6.00%, PIK Interest 3.00% |
|
$ |
20,924 |
|
|
$ |
20,924 |
|
|
$ |
18,128 |
|
||||||||
|
|
|
Internet Consumer & Business Services |
|
Senior Secured Debt |
|
June 2021 |
|
PIK Interest 8.00% |
|
$ |
10,680 |
|
|
|
240 |
|
|
|
— |
|
||||||||
|
|
|
Internet Consumer & Business Services |
|
Preferred Series BB Equity |
|
|
|
|
|
|
1,000,000 |
|
|
|
— |
|
|
|
— |
|
||||||||
|
|
|
Internet Consumer & Business Services |
|
Common Stock |
|
|
|
|
|
|
414,994,863 |
|
|
|
900 |
|
|
|
— |
|
||||||||
|
Total Tectura Corporation |
|
|
|
|
|
|
|
|
|
|
|
|
|
$ |
22,064 |
|
|
$ |
18,128 |
|
||||||||
|
Total Other Control Investments (1.90%)* |
|
|
|
|
|
|
|
|
|
|
|
$ |
22,064 |
|
|
$ |
18,128 |
|
||||||||||
|
Total Control Investments (6.03%)* |
|
|
|
|
|
|
|
|
|
|
|
$ |
64,799 |
|
|
$ |
57,619 |
|
||||||||||
|
Affiliate Investments |
|
|
|
|
|
|
|
|
|
|
|
|
|
|
|
|
|
|
||||||||||
|
Optiscan BioMedical, Corp. |
|
Medical Devices & Equipment |
|
Preferred Series B Equity |
|
|
|
|
|
|
61,855 |
|
|
$ |
3,000 |
|
|
$ |
393 |
|
||||||||
|
|
|
Medical Devices & Equipment |
|
Preferred Series C Equity |
|
|
|
|
|
|
19,273 |
|
|
|
655 |
|
|
|
111 |
|
||||||||
|
|
|
Medical Devices & Equipment |
|
Preferred Series D Equity |
|
|
|
|
|
|
551,038 |
|
|
|
5,257 |
|
|
|
3,524 |
|
||||||||
|
|
|
Medical Devices & Equipment |
|
Preferred Series E Equity |
|
|
|
|
|
|
311,989 |
|
|
|
2,609 |
|
|
|
2,771 |
|
||||||||
|
|
|
Medical Devices & Equipment |
|
Preferred Series E Warrants |
|
|
|
|
|
|
74,424 |
|
|
|
573 |
|
|
|
178 |
|
||||||||
|
Total Optiscan BioMedical, Corp. |
|
|
|
|
|
|
|
|
|
|
|
$ |
12,094 |
|
|
$ |
6,977 |
|
||||||||||
|
Solar Spectrum Holdings LLC (p.k.a. Sungevity, Inc.) |
|
Sustainable and Renewable Technology |
|
Senior Secured Debt |
|
August 2019 |
|
Interest rate PRIME + 8.70% or Floor rate of 12.95%, 5.00% Exit Fee |
|
$ |
10,000 |
|
|
$ |
10,151 |
|
|
$ |
10,151 |
|
||||||||
|
|
|
Sustainable and Renewable Technology |
|
Senior Secured Debt |
|
February 2019 |
|
PIK Interest 10.00% |
|
$ |
649 |
|
|
|
650 |
|
|
|
650 |
|
||||||||
|
|
|
Sustainable and Renewable Technology |
|
Senior Secured Debt |
|
February 2019 |
|
Interest rate PRIME + 10.70% or Floor rate of 15.70%, PIK Interest 2.00% |
|
$ |
603 |
|
|
|
603 |
|
|
|
603 |
|
||||||||
|
|
|
Sustainable and Renewable Technology |
|
Common Stock |
|
|
|
|
|
|
380 |
|
|
|
61,502 |
|
|
|
3,115 |
|
||||||||
|
|
|
Sustainable and Renewable Technology |
|
Common Warrants |
|
|
|
|
|
|
0.69 |
|
|
|
— |
|
|
|
— |
|
||||||||
|
Total Solar Spectrum Holdings LLC (p.k.a. Sungevity, Inc.) |
|
|
$ |
72,906 |
|
|
$ |
14,519 |
|
|||||||||||||||||||
|
Total Affiliate Investments (2.25%)* |
|
|
$ |
85,000 |
|
|
$ |
21,496 |
|
|||||||||||||||||||
|
Total Control and Affliate Investments (8.28%)* |
|
|
$ |
149,799 |
|
|
$ |
79,115 |
|
|||||||||||||||||||
* Value as a percent of net assets
|
(1) |
Stock and warrants are generally non-income producing and restricted. |
|
(2) |
All of the Company’s control and affiliate investments are Level 3 investments valued using significant unobservable inputs. |
179
Please note that the agreements included as exhibits to this Form 10-K are included to provide information regarding their terms and are not intended to provide any other factual or disclosure information about us or the other parties to the agreements. The agreements contain representations and warranties by each of the parties to the applicable agreement that have been made solely for the benefit of the other parties to the applicable agreement and may not describe the actual state of affairs as of the date they were made or at any other time.
|
Exhibit Number |
|
Description |
|
|
|
|
|
3(a) |
|
|
|
|
|
|
|
3(b) |
|
|
|
|
|
|
|
3(c) |
|
|
|
|
|
|
|
3(d) |
|
|
|
|
|
|
|
3(e) |
|
|
|
|
|
|
|
3(f) |
|
|
|
|
|
|
|
4(a) |
|
Specimen certificate of the Company’s common stock, par value $.001 per share. (60) |
|
|
|
|
|
4(b) |
|
|
|
|
|
|
|
4(c) |
|
|
|
|
|
|
|
4(d) |
|
|
|
|
|
|
|
4(e) |
|
|
|
|
|
|
|
4(f) |
|
Indenture between the Registrant and U.S. Bank National Association, dated as of March 6, 2012.(26) |
|
|
|
|
|
4(g) |
|
|
|
|
|
|
|
4(h) |
|
|
|
|
|
|
|
4(i) |
|
|
|
|
|
|
|
4(j) |
|
|
|
|
|
|
|
4(k) |
|
Form of 7.00% Senior Note due 2019, dated as of July 6, 2012 (Additional April 2019 Note).(27) |
|
|
|
|
|
4(l) |
|
Form of 7.00% Senior Note due 2019, dated as of July 12, 2012 (Over-Allotment April 2019 Note).(28) |
|
|
|
|
|
4(m) |
|
|
|
|
|
|
|
4(n) |
|
|
|
|
|
|
|
4(o) |
|
|
|
|
|
|
|
4(p) |
|
|
|
|
|
|
|
4(q) |
|
Form of 6.25% Note due 2024, dated as of August 11, 2014 (Over-Allotment July 2024 Note).(40) |
|
|
|
|
|
4(r) |
|
Form of 6.25% Note due 2024, dated as of May 2, 2016 (Additional July 2024 Note).(52) |
|
|
|
|
|
4(s) |
|
Form of 6.25% Note due 2024, dated as of June 27, 2016 (Additional July 2024 Note).(53) |
|
|
|
|
|
4(t) |
|
Form of 6.25% Note due 2024, dated as of July 5, 2016 (Additional July 2024 Note).(54) |
|
|
|
|
|
4(u) |
|
Form of 6.25% Note due 2024, dated as of October 11, 2016 (Additional July 2024 Note).(56) |
|
|
|
|
|
4(v) |
|
|
|
|
|
|
180
|
Exhibit Number |
|
Description |
|
|
||
|
|
|
|
|
4(x) |
|
|
|
|
|
|
|
4(y) |
|
|
|
|
|
|
|
4(z) |
|
Form of 4.625% Note due 2022, dated as of October 23, 2017 (included as part of Exhibit 4(y)).(63) |
|
|
|
|
|
4(aa) |
|
|
|
|
|
|
|
4(bb) |
|
Form of 5.25% Note due 2025, dated as of April 23, 2018 (included as part of Exhibit 4(aa)).(66) |
|
|
|
|
|
4(cc) |
|
|
|
|
|
|
|
4(dd) |
|
Form of 6.25% Note due 2033, dated September 24, 2018 (included as part of Exhibit 4(cc)).(69) |
|
|
|
|
|
4(ee) |
|
|
|
|
|
|
|
4(ff) |
|
|
|
|
|
|
|
4(gg) |
|
|
|
|
|
|
|
4(hh) |
|
|
|
|
|
|
|
10(a) |
|
|
|
|
|
|
|
10(b) |
|
|
|
|
|
|
|
10(c) |
|
|
|
|
|
|
|
10(d) |
|
|
|
|
|
|
|
10(e) |
|
|
|
|
|
|
|
10(f) |
|
|
|
|
|
|
|
10(g) |
|
|
|
|
|
|
|
10(h) |
|
Hercules Capital, Inc. Amended and Restated 2004 Equity Incentive Plan.(10) |
|
|
|
|
|
10(i) |
|
|
|
|
|
|
|
10(j) |
|
Form of Custodian Agreement between the Company and Union Bank of California, N.A..(3) |
|
|
|
|
|
10(k) |
|
|
|
|
|
|
|
10(l) |
|
|
|
|
|
|
|
10(m) |
|
Form of Incentive Stock Option Award under the 2004 Equity Incentive Plan.(3) |
181
|
Exhibit Number |
|
Description |
|
|
Form of Nonstatutory Stock Option Award under the 2004 Equity Incentive Plan.(3) |
|
|
|
|
|
|
10(o) |
|
|
|
10(p) |
|
|
|
|
|
|
|
10(q) |
|
|
|
|
|
|
|
10(r) |
|
Lease Agreement, dated as of June 13, 2006, between the Company and 400 Hamilton Associates.(4) |
|
|
|
|
|
10(s) |
|
|
|
|
|
|
|
10(t) |
|
|
|
|
|
|
|
10(u) |
|
|
|
10(v) |
|
|
|
|
|
|
|
10(w) |
|
|
|
|
|
|
|
10(x) |
|
|
|
10(y) |
|
|
|
|
|
|
|
10(z) |
|
|
|
|
|
|
|
10(aa) |
|
|
|
|
|
|
|
10(bb) |
|
|
|
|
|
|
|
10(cc) |
|
|
|
|
|
|
|
10(dd) |
|
|
|
|
|
|
|
10(ee) |
|
|
|
|
|
|
|
10(ff) |
|
|
|
|
|
|
|
10(gg) |
|
|
|
|
|
|
182
|
Exhibit Number |
|
Description |
|
|
||
|
|
|
|
|
10(ii) |
|
|
|
|
|
|
|
10(jj) |
|
|
|
|
|
|
|
10(kk) |
|
|
|
|
|
|
|
10(ll) |
|
|
|
|
|
|
|
10(mm) |
|
|
|
|
|
|
|
10(nn) |
|
|
|
|
|
|
|
10(oo) |
|
|
|
|
|
|
|
10(pp) |
|
|
|
10(qq) |
|
|
|
|
|
|
|
10(rr) |
|
|
|
|
|
|
|
10(ss) |
|
|
|
|
|
|
|
10(tt) |
|
|
|
|
|
|
|
10(uu) |
|
|
|
|
|
|
|
10(vv) |
|
|
|
|
|
|
|
10(ww) |
|
|
|
|
|
|
|
10(xx) |
|
|
|
|
|
|
|
10(yy) |
|
|
|
|
|
|
|
10(zz) |
|
|
|
|
|
|
|
10(aaa) |
|
|
|
|
|
|
|
10(bbb) |
|
|
|
|
|
|
183
|
Exhibit Number |
|
Description |
|
|
||
|
|
|
|
|
10(ddd) |
|
|
|
|
|
|
|
10(eee) |
|
|
|
|
|
|
|
10(fff) |
|
|
|
|
|
|
|
10(ggg) |
|
|
|
10(hhh) |
|
|
|
|
|
|
|
10(iii) |
|
|
|
|
|
|
|
10(jjj) |
|
|
|
|
|
|
|
10(kkk) |
|
|
|
10(lll) |
|
|
|
|
|
|
|
10(mmm) |
|
|
|
10(nnn) |
|
|
|
|
|
|
|
10(ooo) |
|
|
|
|
|
|
|
10(ppp) |
|
Form of Performance Restricted Stock Unit Award Agreement.(10) |
|
|
|
|
|
10(qqq) |
|
|
|
|
|
|
|
10(rrr) |
|
|
|
|
|
|
|
10(sss) |
|
|
|
|
|
|
|
10(ttt) |
|
|
|
10(uuu)
|
|
184
|
Exhibit Number |
|
Description |
|
|
Form of Retention Performance Stock Unit Award Agreement.(67)
|
|
|
10(www) |
|
|
|
|
|
|
|
10(xxx) |
|
|
|
|
|
|
|
10(yyy) |
|
|
|
|
|
|
|
10(zzz) |
|
|
|
|
|
|
|
10(aaaa) |
|
|
|
|
|
|
|
10(bbbb) |
|
|
|
|
|
|
|
10(cccc) |
|
|
|
|
|
|
|
10(dddd) |
|
|
|
|
|
|
|
10(eeee) |
|
|
|
|
|
|
|
10(ffff) |
|
Hercules Capital, Inc. Amended and Restated 2018 Equity Incentive Plan.(74) |
|
|
|
|
|
10(gggg) |
|
|
|
|
|
|
|
10(hhhh) |
|
|
|
|
|
|
|
10(iiii) |
|
Form of Restricted Stock Award Agreement (2018 Equity Incentive Plan).(74) |
|
|
|
|
|
10(jjjj) |
|
Form of Restricted Stock Award Agreement (Director Plan).(74) |
|
|
|
|
|
10(kkkk) |
|
|
|
|
|
|
|
10(llll) |
|
|
|
|
|
|
|
10(mmmm) |
|
|
|
|
|
|
|
10(nnnn) |
|
|
|
|
|
|
|
14.1*
|
|
|
|
14.2 |
|
|
|
|
|
|
|
21.1* |
|
|
|
|
|
|
185
|
Exhibit Number |
|
Description |
|
|
Consent of PricewaterhouseCoopers LLP, independent registered public accounting firm. |
|
|
|
|
|
|
31.1* |
|
|
|
|
|
|
|
31.2* |
|
|
|
|
|
|
|
32.1* |
|
|
|
|
|
|
|
32.2* |
|
|
|
|
|
|
|
(1) |
Previously filed as part of Pre-Effective Amendment No. 2, as filed on June 8, 2005 (File No. 333-122950), to the Registration Statement on Form N-2 of the Company. |
|
(2) |
Previously filed as part of the Current Report on Form 8-K of the Company, as filed on August 5, 2005. |
|
(3) |
Previously filed as part of Pre-Effective Amendment No. 1, as filed on May 17, 2005 (File No. 333-122950) to the Registration Statement on Form N-2 of the Company. |
|
(4) |
Previously filed as part of the Current Report on Form 8-K of the Company, as filed on August 1, 2006. |
|
(5) |
Previously filed as part of the Current Report on Form 8-K of the Company, as filed on August 3, 2006. |
|
(6) |
Previously filed as part of the Current Report on Form 8-K of the Company, as filed on December 6, 2006. |
|
(7) |
Previously filed as part of the Current Report on Form 8-K of the Company, as filed on March 9, 2007. |
|
(8) |
Previously filed as part of the Current Report on Form 8-K of the Company, as filed on November 2, 2017. |
|
(9) |
Previously filed as part of the Registration Statement on Form N-2 of the Company (File No. 333-122950), as filed on February 22, 2005. |
|
(10) |
Previously filed as part of the Current Report on Form 8-K of the Company, as filed on January 5, 2017. |
|
(11) |
Previously filed as part of the Securities to be Offered to Employees in Employee Benefit Plans on Form S-8, as filed on October 2, 2007. |
|
(12) |
Previously filed as part of the Post-Effective Amendment No. 3, as filed on March 9, 2006 (File No. 333-126604), to the Registration Statement on Form N-2 of the Company. |
|
(13) |
Previously filed as part of the Current Report on Form 8-K of the Company, as filed on April 3, 2007. |
|
(14) |
Previously filed as part of the Current Report on Form 8-K of the Company, as filed on May 4, 2007. |
|
(15) |
Previously filed as part of the Pre-Effective Amendment No. 1, as filed on May 15, 2007 (File No. 333-141828), to the Registration Statement on Form N-2 of the Company. |
|
(16) |
Previously filed as part of Pre-Effective Amendment No. 2, as filed on June 5, 2008 (File No. 333-150403), to the Registration Statement on Form N-2 of the Company. |
|
(17) |
Previously filed as part of the Post-Effective Amendment No. 3, as filed on March 9, 2006 (File No. 333-126604), to the Registration Statement on Form N-2 of the Company. |
|
(18) |
Previously filed as part of the Current Report on Form 8-K of the Company, as filed on August 27, 2008. |
|
(19) |
Previously filed as part of the Annual Report on Form 10-K of the Company, as filed on March 16, 2009. |
|
(20) |
Previously filed as part of the Quarterly Report on Form 10-Q of the Company, as filed on May 11, 2009. |
|
(21) |
Previously filed as part of the Current Report on Form 8-K of the Company, as filed on February 17, 2010. |
|
(22) |
Previously filed as part of the Current Report on Form 8-K of the Company, as filed on April 11, 2011. |
|
(23) |
Previously filed as part of the Current Report on Form 8-K of the Company, as filed on April 18, 2011. |
|
(24) |
Previously filed as part of the Current Report on Form 8-K of the Company, as filed on June 24, 2011. |
|
(25) |
Previously filed as part of the Current Report on Form 8-K of the Company, as filed on November 4, 2011. |
|
(26) |
Previously filed as part of Post-Effective Amendment No. 1, as filed on April 17, 2012 (File No. 333-179431), to the Registration Statement on Form N-2 of the Company. |
|
(27) |
Previously filed as part of Post-Effective Amendment No. 2, as filed on July 6, 2012 (File No. 333-179431), to the Registration Statement on Form N-2 of the Company. |
|
(28) |
Previously filed as part of Post-Effective Amendment No. 3, as filed on July 12, 2012 (File No. 333-179431), to the Registration Statement on Form N-2 of the Company. |
|
(29) |
Previously filed as part of Post-Effective Amendment No. 5, as filed on September 24, 2012 (File No. 333-179431), to the Registration Statement on Form N-2 of the Company. |
|
(30) |
Previously filed as part of Post-Effective Amendment No. 7, as filed on October 2, 2012 (File No. 333-179431), to the Registration Statement on Form N-2 of the Company. |
|
(31) |
Previously filed as part of Post-Effective Amendment No. 8, as filed on October 17, 2012 (File No. 333-179431), to the Registration Statement on Form N-2 of the Company. |
186
|
(32) |
Previously filed as part of the Quarterly Report on Form 10-Q of the Company, as filed on May 8, 2012. |
|
(33) |
Previously filed as part of the Current Report on Form 8-K of the Company, as filed on August 2, 2012. |
|
(34) |
Previously filed as part of Post-Effective Amendment No. 4, as filed on September 19, 2012 (File No. 333-179431), to the Registration Statement on Form N-2 of the Company. |
|
(35) |
Previously filed as part of the Pre-Effective Amendment No. 1, as filed on October 17, 2006 (File No. 333-136918), to the Registration Statement on Form N-2 of the Company. |
|
(36) |
Previously filed as part of the Current Report on Form 8-K of the Company, as filed on December 20, 2012. |
|
(37) |
Previously filed as part of the Annual report on Form 10-K of the Company, as filed on February 27, 2014. |
|
(38) |
Previously filed as part of Post-Effective Amendment No. 4, as filed on July 11, 2014 (File No. 333-187447), to the Registration Statement on Form N-2 of the Company. |
|
(39) |
Previously filed as part of Post-Effective Amendment No. 5, as filed on July 14, 2014 (File No. 333-187447), to the Registration Statement on Form N-2 of the Company. |
|
(40) |
Previously filed as part of Post-Effective Amendment No. 6, as filed on August 11, 2014 (File No. 333-187447), to the Registration Statement on Form N-2 of the Company. |
|
(41) |
Previously filed as part of the Current Report on Form 8-K of the Company, as filed on August 19, 2014. |
|
(42) |
Previously filed as part of the Quarterly Report on Form 10-Q of the Company, as filed on November 6, 2014. |
|
(43) |
Previously filed as part of the Registration Statement on Form N-2 of the Company (File No. 333-203511), as filed on April 20, 2015. |
|
(44) |
Previously filed as part of the Quarterly Report on Form 10-Q of the Company, as filed on May 7, 2015. |
|
(45) |
Previously filed as part of the Current Report on Form 8-K of the Company, as filed on June 30, 2015. |
|
(46) |
Previously filed as part of the Current Report on Form 8-K of the Company, as filed on July 13, 2015. |
|
(47) |
Previously filed as part of the Current Report on Form 8-K of the Company, as filed on November 13, 2015. |
|
(48) |
Previously filed as part of the Current Report on Form 8-K of the Company, as filed on December 18, 2015. |
|
(49) |
Previously filed as part of the Current Report on Form 8-K of the Company, as filed on February 25, 2016. |
|
(50) |
Previously filed as part of the Current Report on Form 8-K of the Company, as filed on April 11, 2016. |
|
(51) |
Previously filed as part of the Current Report on Form 8-K of the Company, as filed on May 10, 2016. |
|
(52) |
Previously filed as part of Post-Effective Amendment No. 3, as filed on May 2, 2016 (File No. 333-203511), to the Registration Statement on Form N-2 of the Company. |
|
(53) |
Previously filed as part of Post-Effective Amendment No. 6, as filed on June 27, 2016 (File No. 333-203511), to the Registration Statement on Form N-2 of the Company. |
|
(54) |
Previously filed as part of Post-Effective Amendment No. 7, as filed on July 5, 2016 (File No. 333-203511), to the Registration Statement on Form N-2 of the Company. |
|
(55) |
Previously filed as part of the Current Report on Form 8-K of the Company, as filed on July 19, 2016. |
|
(56) |
Previously filed as part of the Post-Effective Amendment No. 10, as filed on October 14, 2016 (File No. 333-203511), to the Registration Statement on Form N-2 of the Company. |
|
(57) |
Previously filed as part of the Current Report on Form 8-K of the Company, as filed on January 25, 2017. |
|
(58) |
Previously filed as part of the Current Report on Form 8-K of the Company, as filed on March 8, 2016. |
|
(59) |
Previously filed as part of the Current Report on Form 8-K of the Company, as filed on July 22, 2016. |
|
(60) |
Previously filed as part of the Annual Report on Form 10-K of the Company, as filed on February 25, 2016. |
|
(61) |
Previously filed as part of the Current Report on Form 8-K of the Company, as filed on April 7, 2017. |
|
(62) |
Previously filed as part of the Pre-Effective Amendment No. 2, as filed on September 5, 2017 (File No. 333-214767), to the Registration Statement on Form N-2 of the Company. |
|
(63) |
Previously filed as part of the Post-Effective Amendment No. 2, as filed on October 25, 2017 (File No. 333-214767), to the Registration Statement on Form N-2 of the Company. |
|
(64) |
Previously filed as part of the Current Report on Form 8-K of the Company, as filed on October 26, 2017. |
|
(65) |
Previously filed as part of the Current Report on Form 8-K of the Company, as filed on November 2, 2017. |
|
(66) |
Previously filed as part of Post-Effective Amendment No. 4, as filed on April 26, 2018 (File No. 333-214767), to the Registration Statement on Form N-2 of the Company. |
|
(67) |
Previously filed as part of the Quarterly Report on Form 10-Q of the Company, as filed on May 3, 2018. |
|
(68) |
Previously filed as part of the Current Report on Form 8-K of the Company, as filed on June 1, 2018. |
|
(69) |
Previously filed as part of Post-Effective Amendment No. 2, as filed on September 24, 2018 (File No. 333-224281), to the Registration Statement on Form N-2 of the Company. |
|
(70) |
Previously filed as part of the Quarterly Report on Form 10-Q of the Company, as filed on November 1, 2018. |
|
(71) |
Previously filed as part of the Current Report on Form 8-K of the Company, as filed on November 2, 2018. |
|
(72) |
Previously filed as part of the Current Report on Form 8-K of the Company, as filed on January 17, 2019. |
|
(73) |
Previously filed as part of the Current Report on Form 8-K of the Company, as filed on January 22, 2019. |
|
(74) |
Previously filed as part of the Current Report on Form 8-K of the Company, as filed on January 31, 2019. |
|
(75) |
Previously filed as part of the Current Report on Form 8-K of the Company, as filed on February 21, 2019. |
|
* |
Filed herewith |
187
Pursuant to the requirements of Section 13 or 15(d) of the Securities Exchange Act of 1934, the registrant has duly caused this report to be signed on its behalf by the undersigned, thereunto duly authorized.
|
|
HERCULES CAPITAL, INC.
|
||
|
|
|
|
|
|
Date: February 21, 2019 |
By: |
|
/S/ Manuel A. Henriquez |
|
|
|
|
Manuel A. Henriquez |
|
|
|
|
Chief Executive Officer |
In accordance with the Securities Exchange Act of 1934, this report has been signed below by the following persons on behalf of the registrant and in the following capacities on February 21, 2019.
|
Signature |
|
Title |
|
Date |
|||
|
|
|
|
|
|
|||
|
/S/ Manuel A. Henriquez |
|
Chairman of the Board, President and Chief |
|
February 21, 2019 |
|||
|
Manuel A. Henriquez |
|
Executive Officer (Principal Executive Officer) |
|
|
|||
|
|
|
|
|
|
|||
|
/S/ David Lund |
|
Interim Chief Financial Officer, and |
|
February 21, 2019 |
|||
|
David Lund |
|
Interim Chief Accounting Officer |
|
|
|||
|
|
|
|
|
|
|||
|
/S/ Robert P. Badavas |
|
Director |
|
February 21, 2019 |
|||
|
Robert P. Badavas |
|
|
|
|
|||
|
|
|
|
|
|
|||
|
/S/ Thomas Fallon |
|
Director |
|
February 21, 2019 |
|||
|
Thomas Fallon |
|
|
|
|
|||
|
|
|
|
|
|
|||
|
/S/ Joseph F. Hoffman |
|
Director |
|
February 21, 2019 |
|||
|
Joseph F. Hoffman |
|
|
|
|
|||
|
|
|
|
|
|
|||
|
/S/ Brad Koenig |
|
Director |
|
February 21, 2019 |
|||
|
Brad Koenig |
|
|
|
|
|||
|
|
|
|
|
|
|||
|
/S/ Jorge Titinger |
|
Director |
|
February 21, 2019 |
|||
|
Jorge Titinger |
|
|
|
|
|||
|
|
|
|
|
|
|||
|
/S/ Doreen Woo Ho |
|
Director |
|
February 21, 2019 |
|||
|
Doreen Woo Ho |
|
|
|
|
|||
|
|
|
Director |
|
February 21, 2019 |
|||
|
Carol L. Foster |
|
|
|
|
|||
|
|
|
|
|
|
|||
|
/S/ Gayle Crowell |
|
Director |
|
February 21, 2019 |
|||
|
Gayle Crowell |
|
|
|
|
|||
|
|
|
|
|
|
|||
188